EUR/USD Daily Video, October 10, 2011

Sive Morten

Special Consultant to the FPA
Messages
18,644
Good morning,
market is developing in parallel channel on daily time frame, that's why currently we have no reason for discussing of some significant moves.
So, today we will focus on price action inside the channel and what levels to watch:


The technical portion of Sive's analysis owes a great deal to Joe DiNapoli's methods, and uses a number of Joe's proprietary indicators. Please note that Sive's analysis is his own view of the market and is not endorsed by Joe DiNapoli or any related companies
 
Last edited by a moderator:
eur/usd srinivas (india)

Hi sive,

thanks a lot for your efforts its realy usefull stull for us thanks once again for the daily updates.

Regards,
srinivas(india)
 
Fib Retracement/Expansion

Hi Sive,

My question is when do you delete or eliminate a Fib Retracement/Expansion level from the chart. Is it once a Fib level is hit or bounce from it or market go through the level?

I am using MT4, and it's very difficult to manage all the levels on a chart. It's getting very difficult because with all the levels that you're showing us, the chart become very crowded. Do you suggest any another free software other than MT4 for charting. I know the software that you are using is not free. Any other suggestions.

I am attaching the 4hour chart of the EURUSD of todays date after drawing all the levels that you just show us on your todays video and you will understand what are my concerns and struggles that I am facing.


Thank you for all your hard work, it's very helpful to my trading analysis.
 

Attachments

  • eurusd 4hour - saturday oct 08.jpg
    eurusd 4hour - saturday oct 08.jpg
    111.6 KB · Views: 423
Hi Sive,

My question is when do you delete or eliminate a Fib Retracement/Expansion level from the chart. Is it once a Fib level is hit or bounce from it or market go through the level?

I am using MT4, and it's very difficult to manage all the levels on a chart. It's getting very difficult because with all the levels that you're showing us, the chart become very crowded. Do you suggest any another free software other than MT4 for charting. I know the software that you are using is not free. Any other suggestions.

I am attaching the 4hour chart of the EURUSD of todays date after drawing all the levels that you just show us on your todays video and you will understand what are my concerns and struggles that I am facing.


Thank you for all your hard work, it's very helpful to my trading analysis.

Hi Samfx,
If market has jumped from the level - level is still valid. We should delete level only after market has broken it, though here are some additional nuances exist..

I suggest you to visit our school and read chapters about support resistance and Fib work:

Forex Military School | Complete Forex Education by a Pro Banker - Forex Peace Army Forum

Speaking about software - I'm not sure about absolutely free, but Damian uses some software with DiNapoli tools. Ask him about it.
 
Hello samfx,

I don't know if this will help, but I try to make my charts look like Sive's by adjustments in the Fibo properties.
In the "Fibo Levels" tab I delete all the levels not used.
In the "Parameters" tab I leave "Ray" unselected and by adjusting the date, I move the fibo line away from the far right of the chart.
In the "Visualization" tab I select what timeframes are need. I hope this is of some help
 
Hi Samfx

I open a chart for each timeframe (ie Monthly, weekly, daily chart and so on...).

With Sive's weekly analysis, on a Saturday or Sunday, I plot the relevant levels to each time frame respectively and like kappa2547, I delete the fib levels that are not required for that particular timeframe. It's a lot of work the first time round but from the next week on you only need to update the previous charts.


Following Sive's daily video I then add or delete levels that become important to 4hr & 1hr timeframe, even down to 15mns and 5mns. it allows me to become less confused, looking at less relevant levels on smaller timeframes.

What it also allows me to do is to step back (i.e. look at larger timeframes), and remind me of the overall picture often explained on the weekly analysis but sometimes half forgotten by wednesday afternoon. Also you can see the market in every timeframe which gives you time to estimate your next support or resistance levels to watch out for

hope this helps. Time will help you find your own methods eventually.

Kind thoughts
 
Thanks for showing everyday the videos

;)Hello Sive,
Thanks for showing everyday the video´s.
I learn a lot from it.

Greetings,
Joke
 
Appreciation

Hi dear Sive,

I appreciate and thank you very much. God bless you!!!

Alkis (Greece...)
 
Off topic question regarding GBP/JPY daily DRPO buy

Goodday everybody, I have a question regarding the entering point after the confirmation bar of a DRPO. You will find some charts regarding this pair and my analysis since I dont wanna drop a question just like that. (I do it on this thread since I dont wanna mess up the weekly review of EUR/USD :p)

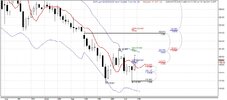
Monthly: From this chart I can see that price action has the form of a descending triangle wich should be treated as indecision. Reversal or continuation are both possible. September bar has achieved new all-time lows and closed above previous low (jan 2009) inside the triangle after reaching COP. Current bar show small range and has (for now) the shape of a hammer. Reaching and LPO and W&R of previous low are two bullish signs. Although is too early in the month to speak about this , touching the bottom of the triangle could take price action to the upper border. let's see weekly chart to have a better view.

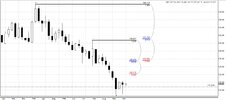
Weekly time frame: market closed only during one week below the all-time low. We can also see that last week formed a hammer giving as a possible hint for bullish direction.

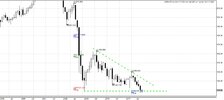
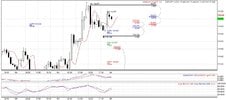
Daily: On this time frame we can appreciate the DRPO im talking about. Nice thrust down close above below and above giving us the confirmation bar on the 7th of October. Failure would occur if theres a close below .618 (118.12) or below the 3x3 DMA right? . Nearest target should be 1.00 expansion in agreement with daily overbought and with daily confluence resistance. but I just don't know how to properly enter this signal. I've looked through Joe's TWDL and couldn't find the correct information. I like .382 retracement of last swing up to enter, although since this is a strong directional signal I'm wondering maybe I should enter at the market a little bit like with the RRTs.

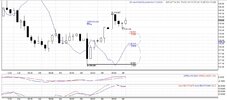
4-hour chart: show is a good moment to fade the stochastics. previous bar was a hammer aswell. This makes me wanna enter at-the-market although if i take a look on 1 hour chart there could be an ABCD bearish pattern with 1.00 extension just 10 pips above the .382 daily retracement at 118,93 .


So... Sive if u managed to read till this point, thanks...lol . What's a proper entry for a DRPO signal after the confirmation bar? A shallow retracement I suppose but..could that mean not even .382 retracement? and...what do u think about overall analysis? there's a lot of conclusions based on what I see but I might just get the facts wrong..I would appreciate very much your view on this subject. Thank you and have a good day.

PS:I didnt drawpivot points since I think the good pivot points are the ones from futures, not forex.
 

Attachments

  • motnhly.jpg
    motnhly.jpg
    142.3 KB · Views: 200
  • weekly.jpg
    weekly.jpg
    147.6 KB · Views: 198
  • daily.jpg
    daily.jpg
    180.7 KB · Views: 199
  • 4-hour.jpg
    4-hour.jpg
    248.1 KB · Views: 196
  • 1-hour.jpg
    1-hour.jpg
    219.4 KB · Views: 198
DROPs

There's also another D DROP on Cable.
I like it better than the one on GBPJPY, but GBPJPY has good potential as well. It will be followed closely.
On Cable, set already limit and stop buy orders as shown in the chart.
I play these patterns with caution since a failure could be significant. So, TPs and SLs are set once the order gets filled, usually FIBs Extensions and/or D/W Pivots.

Regards and your toughts Sive will be, as always, greatly appreciated...!!!

Thank you...!!!
 

Attachments

  • GJ 10.9.11.jpg
    GJ 10.9.11.jpg
    299.2 KB · Views: 196
  • GU 10.9.11.jpg
    GU 10.9.11.jpg
    398.7 KB · Views: 197
Back
Top