EUR/USD Daily Video, November 02, 2011

Sive Morten

Special Consultant to the FPA
Messages
18,669
Good morning,
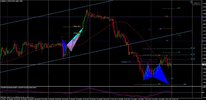
market has hit our target that we've discussed yesterday and showing some signs of retracement. There could be three different patterns, that could trigger it. Most probable target of retracement is 1.3850-1.3880, but 1.40 is also possible:


The technical portion of Sive's analysis owes a great deal to Joe DiNapoli's methods, and uses a number of Joe's proprietary indicators. Please note that Sive's analysis is his own view of the market and is not endorsed by Joe DiNapoli or any related companies.
 
Last edited by a moderator:
Hi Sive,
Do you think that a Fib level 38.2, 50.0 or 61.8 could act as support and resistance like a Pivot Points. I mean if a support Fib level is broken let say by 100 pips and market returned back up to that level (support Fib level that was just broken). Do you think this level is a resistance now after it's been broken? or you just take of your chart?

We can see it today on the 4hour chart the 38.2 level from the big swing up has been broken. And we can see that market returned to this level and bounced back down.

I know that we have other fib levels at the same level/zone We have the 50 Fib, and the 38.2 fib from the most recent big trust down. And also we have the 127 exp/target from the ABC that you showed us yesterday inside the butterfly buy that it was forming. But also the broken 38.2 level con-inside at the same level.

Thank you Sive for the daily analysis, it's very helpful.
 

Attachments

  • eurusd - 1hour - wed nov 02.jpg
    eurusd - 1hour - wed nov 02.jpg
    131.9 KB · Views: 53
  • eurusd - 4hour - wed nov 02.jpg
    eurusd - 4hour - wed nov 02.jpg
    153.7 KB · Views: 52
Last edited:
Hi Sive,
Do you think that a Fib level 38.2, 50.0 or 61.8 could act as support and resistance like a Pivot Points. I mean if a support Fib level is broken let say by 100 pips and market returned back up to that level (support Fib level that was just broken). Do you think this level is a resistance now after it's been broken? or you just take of your chart?

We can see it today on the 4hour chart the 38.2 level from the big swing up has been broken. And we can see that market returned to this level and bounced back down.

I know that we have other fib levels at the same level/zone We have the 50 Fib, and the 38.2 fib from the most recent big trust down. And also we have the 127 exp/target from the ABC that you showed us yesterday inside the butterfly buy that it was forming. But also the broken 38.2 level con-inside at the same level.

Thank you Sive for the daily analysis, it's very helpful.

Hi Samfx,
simetimes it could happen. For instance, when market disprespect some significant level (usually this is common for K-areas) and breaks it through, like it doesn't exist. In this case, market later could return and retest this level from opposite side. This is quite common price action.

Another possibility very often appears on intraday charts during trending days, but could be seen on longer-term charts also.
Usually market in such days shows very shallow retracements. And it happens so that market breaks, say, 0.382 level then stops somewhere between 0.382 and 0.5 and start to flirting with 0.382 but now from the opposite side - uses it as support (if break was to the upside). It looks like market is preparing to breakout of 0.5. and so on. That is very often could be seen.

in our FPA school will be the chapter dedicated to trending days - here you'll see on example how it could look.

But in most cases, when market breaks some level, I treat it has ereased by price action and do not take into consideration any more.
 
Back
Top