Sive Morten
Special Consultant to the FPA
- Messages
- 18,621
Monthly
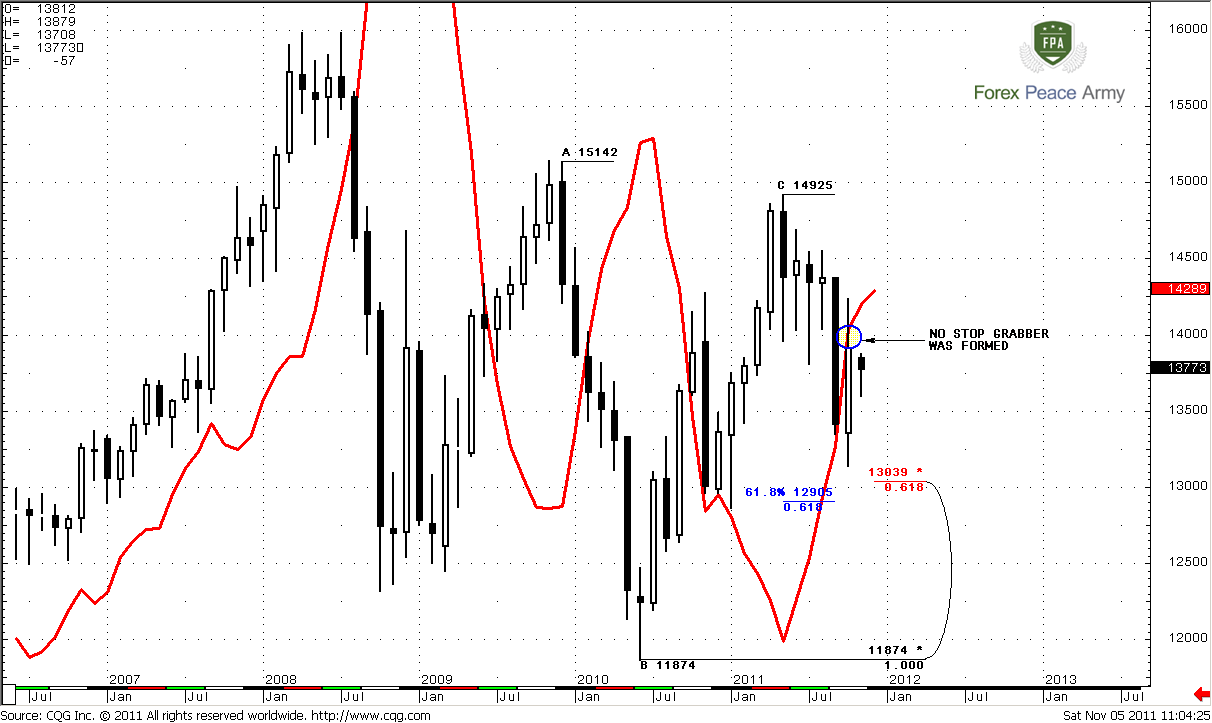
On past week, finally, situation on monthly chart has been resolved. Market has failed to form bullish stop grabber pattern and destroy perspectives of move to 1.50 area. From another point of view – this is absolutely in a row with quarterly dollar index analysis that we’ve discussed on previous week and overall fundamental situation on market. Greece turmoil could lead markets to real Doom & Gloom. Since you’ve asked on forum to give some clarification to that problem – let’s try to do this, but we can’t tell much, since even EU governors can’t.
GREECE
Now the major question is will Greece hold in EU or not. There are couple of process are underway there. First, there was a voting yesterday about Papandreou perspectives to stay as a head of Government. Yesterday’s voting was 153 against 150 that he will stay as a head for awhile but his power will be applied to creating of coalition cabinet. After that he promises to be retired from the Government head. Greece does not apply such way of government for last 20 years. So, what to expect from it and what results of its government will be – this is additional risk.
The most probable head of coalition cabinet will be current Finance Minister Evangelos Venizelos, who clearly appears against referendum. How two these events – referendum and coalition cabinet are linked with each other? The major idea is that coalition cabinet is a government of two major politician parties in Greece. So, if they are agreed with each other and will rule Country together – there is no need to launch referendum. Papandreou itself has said that he agrees to not launch referendum if cabinet will be created.
Now the second major problem is a size of financial help to Greece. In nearest term perspective (till 8th of December) Athens needs EUR 8 Billion, otherwise according to Lisbon Agreement Greece will leave EU, and hence, EUR zone. How it will impact on EUR – impossible to predict now, it’s mostly like Pandora’s Box. From the one side – rest of EU will not need to provide 160 Bln. help to Greece and at the moment this could support EUR, but in long-term perspective this will hurt EUR, due to destroying of common economic space and could lead to some other geopolitical problems.
So, that’s been said in nearest two months there are two crucial events – creating of coalition cabinet and receiving of 8 Bln. of help. If either first or second even will not happen – this will significantly increase risk of Greece’s eliminating from EU. The rest of EU help (160 Bln) has been frozen till coalition cabinet will be formed.
Now let’s continue with technical picture. Although long term bearish bias holds, investors will not be hurry up for two reasons – they need some more certainty with Greece and because of the end of the year. From that perspective it is more probable that market will turn to some wide range trading. That’s why our analysis style till the end of the year mostly should be based on searching of clear patterns to trade – as in terms of entering the trade as in terms of taking profit.
On monthly chart we see that nearest downward target 1.2905 in Agreement with 1.3039 Fib support. Market is neither at oversold nor at overbought.
Weekly
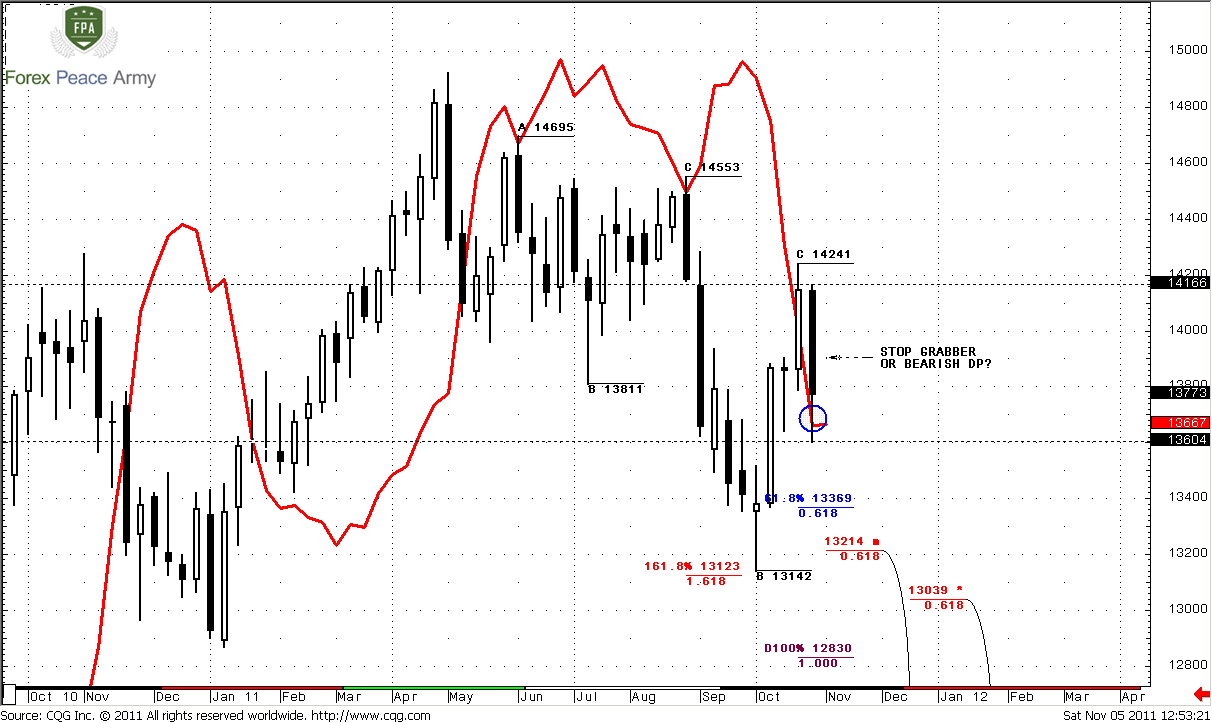
Here is very difficult to say something definite. Trend is bullish, market is neither at oversold nor at overbought. After hitting of 1.618 target in Agreement of minor 0.618 support level market has jumped out. Currently we see that there are two contradictive patterns could be formed here. First one is bullish stop grabber. During past week market has tried to shift trend bearish, but failed and closed above MACDP line. Second one is bearish dynamic pressure, and I think that this pattern has more chances to succeed, taking in consideration overall situation in EU and technical issues on monthly chart. We see that although trend has turned bullish, price action does not support it. I could turn so, that this contradiction will not be solved fast, since for that purpose market has to take either high at 1.4166-1.4241 or take the low at 1.3604. Also, for dynamic pressure is typical to create lower highs and gradually move price lower and lower. Still Stop grabber will fail only if market will close below its low – 1.3604 or change trend to bearish. So, as you can see both of these patterns are linked with each other. Nearest target to the downside is 1.3369 – 0.618 Fib extension from most recent AB-CD pattern.
Daily
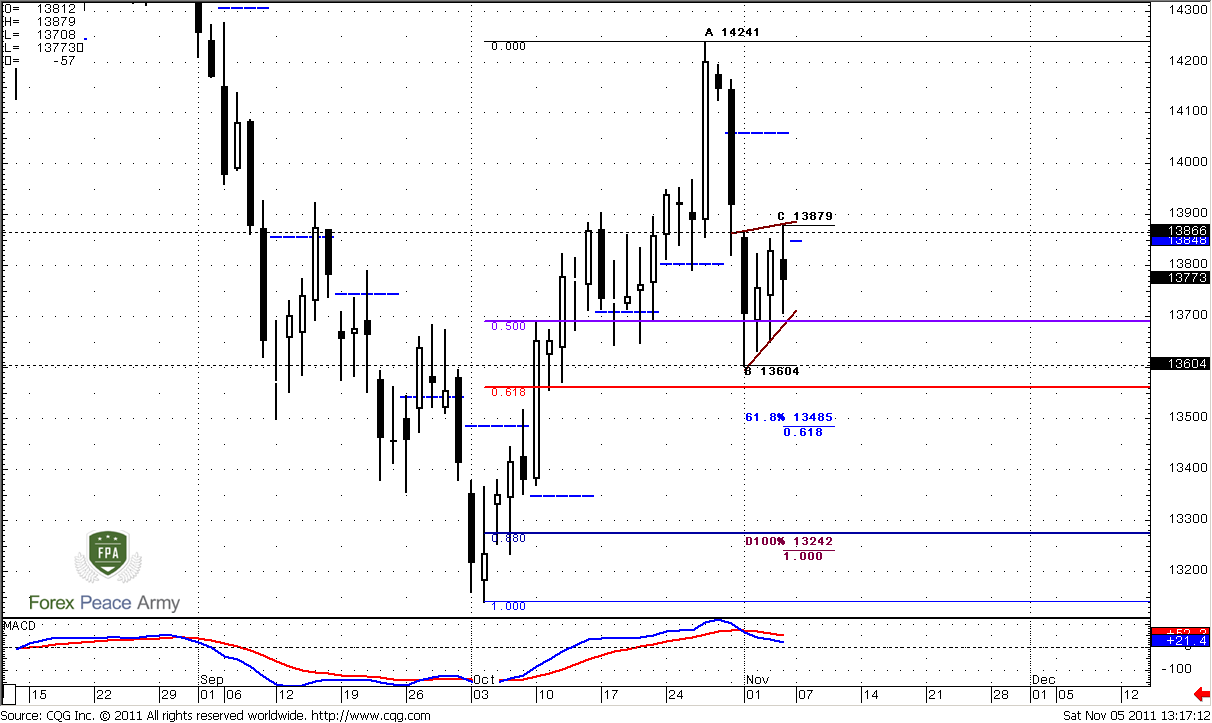
On daily time frame trend is bearish, no oversold or overbought. There are few patterns that we can discuss. In general, we might say, that market stays indecision, since during whole week market stands in the range of black candle. All that we can discuss here is potential classical pennant pattern, that in theory is a continuation one. Initial plunge down could be treated as mast, so the potential classical target of pennant is approximately 1.34 area.
Weekly pivot point for coming week stands at 1.3848. Let’s try on the intraday chart to find out – should we expect possible upward breakout or some kind of Wash&Rinse, or market should show downward continuation without surprises….
4-hour
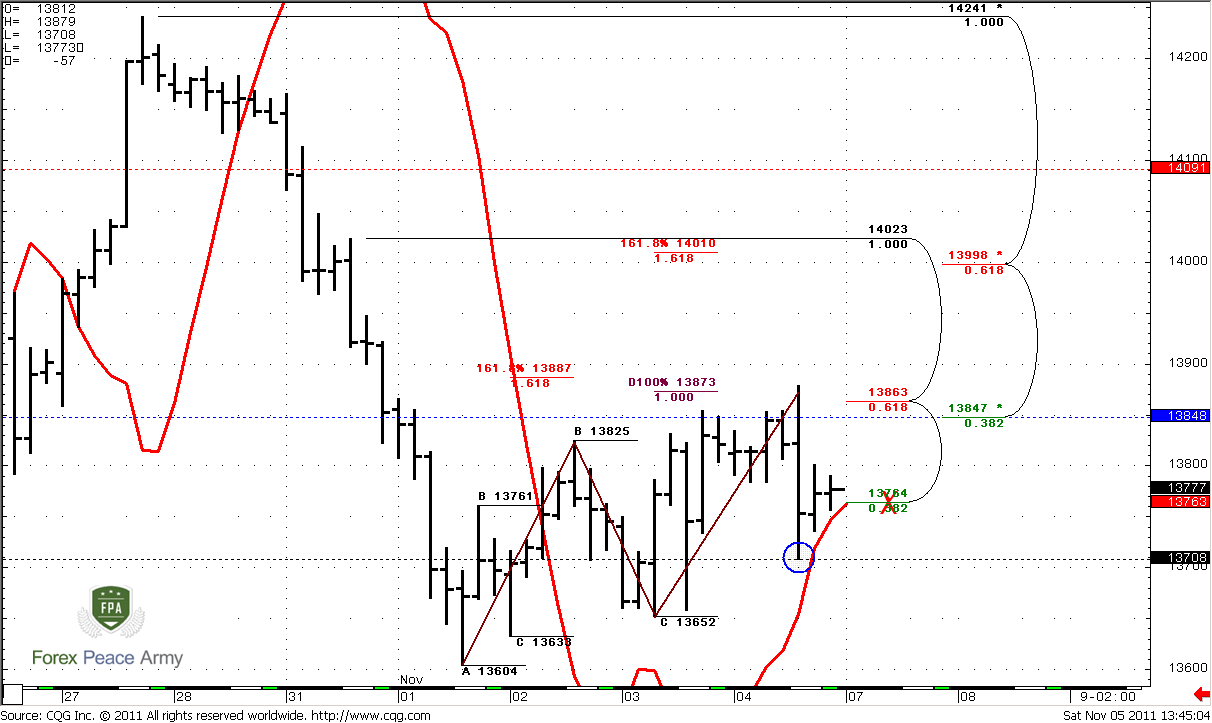
…and this time frame tells us that W&R or upward breakout of pennant is possible - very interesting situation here. First, market yesterday has accomplished our assumption about hitting of 1.3873 target due hourly dynamic pressure, completed AB=CD and shown plunge after that. But take a look what is happening here. Trend holds bullish, although two recent bars are not quite stop grabbers, but there could appear some. Such stop grabbers are very good-looking. They are typically appearing in such conditions. They tell us that market could take out high around 1.3879. This could happen in 2 ways – fist, one is just W&R, may be it will hit 1.3887 target during this move from initial AB-CD that has not been hit yet. Second is true breakout and continuation to Agreement at 1.40 area. Also take a not that this is in a row with touching of pivot that stands in the same K-area around 1.3848 – market trades them in 70% of cases.
From another point of view – we need erasing of that context by moving market below 1.3708 and shifting trend to bearish.
So, if you’re bullish, and stop grabber will appear – it will allow you to enter in very good trade with tight stop. This context will be cancelled if market will move below the lows of stop grabbers – 1.3708 and shift trend bearish. That is very close to current market.
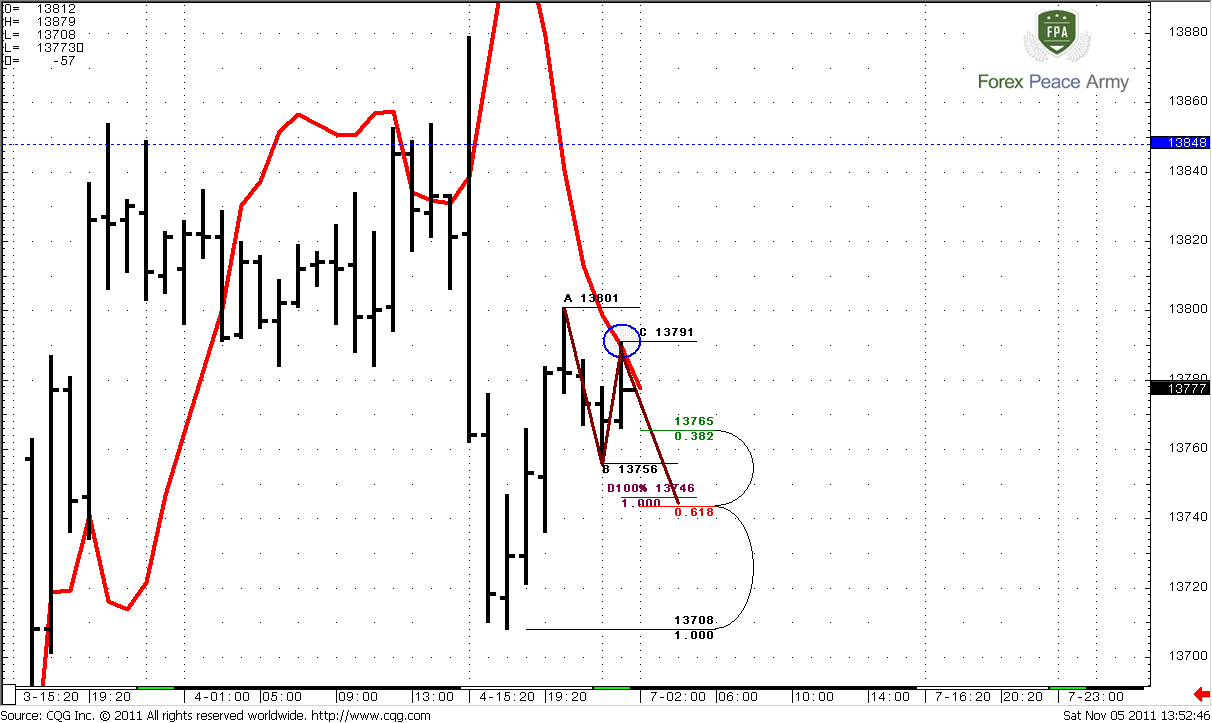
Hourly
This time frame tells that appearing of Stop grabber on 4-hour chart is very probable. Take a note from above chart that MACD level of trend shifting for next 4-hour bar is 1.3763. Now let’s take a look at hourly chart.
Here we clear see bearish stop grabber that should lead at least to 1.3756 lows, but more probable that market will fulfill AB=CD pattern and complete Gartley “222” Buy. This is also create an Agreement with 0.618 Fib support at 1.3744-1.3746. If market within 4-hours after that will return back above 1.3763 – Stop grabber on 4-hour chart will be completed and we should be aware of W&R of previous highs around 1.3879 or even further upward continuation. As you can see – there is not all so simple with bearish pennant on daily…
Conclusion:
In nearest perspective long-term bias is moderately bearish. Still, due to insufficient certainty with Greece, market could stand indecision for sometime and probably we will have to deal mostly with short-term trades.
Be very careful with intraday charts in the beginning of the week, because situation is a bit advanced. Catch those moments, that we’ve just discussed.
The technical portion of Sive's analysis owes a great deal to Joe DiNapoli's methods, and uses a number of Joe's proprietary indicators. Please note that Sive's analysis is his own view of the market and is not endorsed by Joe DiNapoli or any related companies.
On past week, finally, situation on monthly chart has been resolved. Market has failed to form bullish stop grabber pattern and destroy perspectives of move to 1.50 area. From another point of view – this is absolutely in a row with quarterly dollar index analysis that we’ve discussed on previous week and overall fundamental situation on market. Greece turmoil could lead markets to real Doom & Gloom. Since you’ve asked on forum to give some clarification to that problem – let’s try to do this, but we can’t tell much, since even EU governors can’t.
GREECE
Now the major question is will Greece hold in EU or not. There are couple of process are underway there. First, there was a voting yesterday about Papandreou perspectives to stay as a head of Government. Yesterday’s voting was 153 against 150 that he will stay as a head for awhile but his power will be applied to creating of coalition cabinet. After that he promises to be retired from the Government head. Greece does not apply such way of government for last 20 years. So, what to expect from it and what results of its government will be – this is additional risk.
The most probable head of coalition cabinet will be current Finance Minister Evangelos Venizelos, who clearly appears against referendum. How two these events – referendum and coalition cabinet are linked with each other? The major idea is that coalition cabinet is a government of two major politician parties in Greece. So, if they are agreed with each other and will rule Country together – there is no need to launch referendum. Papandreou itself has said that he agrees to not launch referendum if cabinet will be created.
Now the second major problem is a size of financial help to Greece. In nearest term perspective (till 8th of December) Athens needs EUR 8 Billion, otherwise according to Lisbon Agreement Greece will leave EU, and hence, EUR zone. How it will impact on EUR – impossible to predict now, it’s mostly like Pandora’s Box. From the one side – rest of EU will not need to provide 160 Bln. help to Greece and at the moment this could support EUR, but in long-term perspective this will hurt EUR, due to destroying of common economic space and could lead to some other geopolitical problems.
So, that’s been said in nearest two months there are two crucial events – creating of coalition cabinet and receiving of 8 Bln. of help. If either first or second even will not happen – this will significantly increase risk of Greece’s eliminating from EU. The rest of EU help (160 Bln) has been frozen till coalition cabinet will be formed.
Now let’s continue with technical picture. Although long term bearish bias holds, investors will not be hurry up for two reasons – they need some more certainty with Greece and because of the end of the year. From that perspective it is more probable that market will turn to some wide range trading. That’s why our analysis style till the end of the year mostly should be based on searching of clear patterns to trade – as in terms of entering the trade as in terms of taking profit.
On monthly chart we see that nearest downward target 1.2905 in Agreement with 1.3039 Fib support. Market is neither at oversold nor at overbought.
Weekly
Here is very difficult to say something definite. Trend is bullish, market is neither at oversold nor at overbought. After hitting of 1.618 target in Agreement of minor 0.618 support level market has jumped out. Currently we see that there are two contradictive patterns could be formed here. First one is bullish stop grabber. During past week market has tried to shift trend bearish, but failed and closed above MACDP line. Second one is bearish dynamic pressure, and I think that this pattern has more chances to succeed, taking in consideration overall situation in EU and technical issues on monthly chart. We see that although trend has turned bullish, price action does not support it. I could turn so, that this contradiction will not be solved fast, since for that purpose market has to take either high at 1.4166-1.4241 or take the low at 1.3604. Also, for dynamic pressure is typical to create lower highs and gradually move price lower and lower. Still Stop grabber will fail only if market will close below its low – 1.3604 or change trend to bearish. So, as you can see both of these patterns are linked with each other. Nearest target to the downside is 1.3369 – 0.618 Fib extension from most recent AB-CD pattern.
Daily
On daily time frame trend is bearish, no oversold or overbought. There are few patterns that we can discuss. In general, we might say, that market stays indecision, since during whole week market stands in the range of black candle. All that we can discuss here is potential classical pennant pattern, that in theory is a continuation one. Initial plunge down could be treated as mast, so the potential classical target of pennant is approximately 1.34 area.
Weekly pivot point for coming week stands at 1.3848. Let’s try on the intraday chart to find out – should we expect possible upward breakout or some kind of Wash&Rinse, or market should show downward continuation without surprises….
4-hour
…and this time frame tells us that W&R or upward breakout of pennant is possible - very interesting situation here. First, market yesterday has accomplished our assumption about hitting of 1.3873 target due hourly dynamic pressure, completed AB=CD and shown plunge after that. But take a look what is happening here. Trend holds bullish, although two recent bars are not quite stop grabbers, but there could appear some. Such stop grabbers are very good-looking. They are typically appearing in such conditions. They tell us that market could take out high around 1.3879. This could happen in 2 ways – fist, one is just W&R, may be it will hit 1.3887 target during this move from initial AB-CD that has not been hit yet. Second is true breakout and continuation to Agreement at 1.40 area. Also take a not that this is in a row with touching of pivot that stands in the same K-area around 1.3848 – market trades them in 70% of cases.
From another point of view – we need erasing of that context by moving market below 1.3708 and shifting trend to bearish.
So, if you’re bullish, and stop grabber will appear – it will allow you to enter in very good trade with tight stop. This context will be cancelled if market will move below the lows of stop grabbers – 1.3708 and shift trend bearish. That is very close to current market.
Hourly
This time frame tells that appearing of Stop grabber on 4-hour chart is very probable. Take a note from above chart that MACD level of trend shifting for next 4-hour bar is 1.3763. Now let’s take a look at hourly chart.
Here we clear see bearish stop grabber that should lead at least to 1.3756 lows, but more probable that market will fulfill AB=CD pattern and complete Gartley “222” Buy. This is also create an Agreement with 0.618 Fib support at 1.3744-1.3746. If market within 4-hours after that will return back above 1.3763 – Stop grabber on 4-hour chart will be completed and we should be aware of W&R of previous highs around 1.3879 or even further upward continuation. As you can see – there is not all so simple with bearish pennant on daily…
Conclusion:
In nearest perspective long-term bias is moderately bearish. Still, due to insufficient certainty with Greece, market could stand indecision for sometime and probably we will have to deal mostly with short-term trades.
Be very careful with intraday charts in the beginning of the week, because situation is a bit advanced. Catch those moments, that we’ve just discussed.
The technical portion of Sive's analysis owes a great deal to Joe DiNapoli's methods, and uses a number of Joe's proprietary indicators. Please note that Sive's analysis is his own view of the market and is not endorsed by Joe DiNapoli or any related companies.
")