Sive Morten
Special Consultant to the FPA
- Messages
- 18,648
Monthly
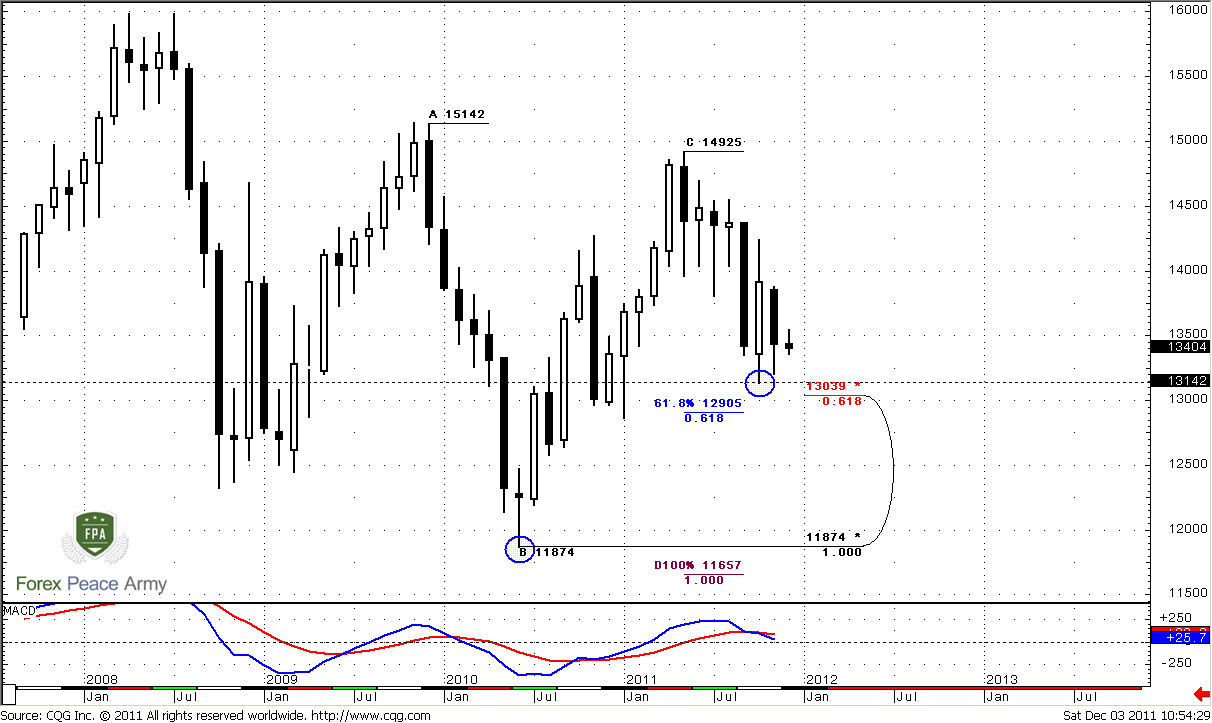
Our long-term forecast, that assumes possible move to 1.15 area still holds. Monthly trend is bearish, and, in general, we can see downward move during November. Market stands neither at oversold nor at overbought, next support area is 1.2905-1.3040. Pay attention that as this target as next one around 1.15 area stands below previous lows. It means that these lows hardly will hold if market will reach them, of cause.
Weekly
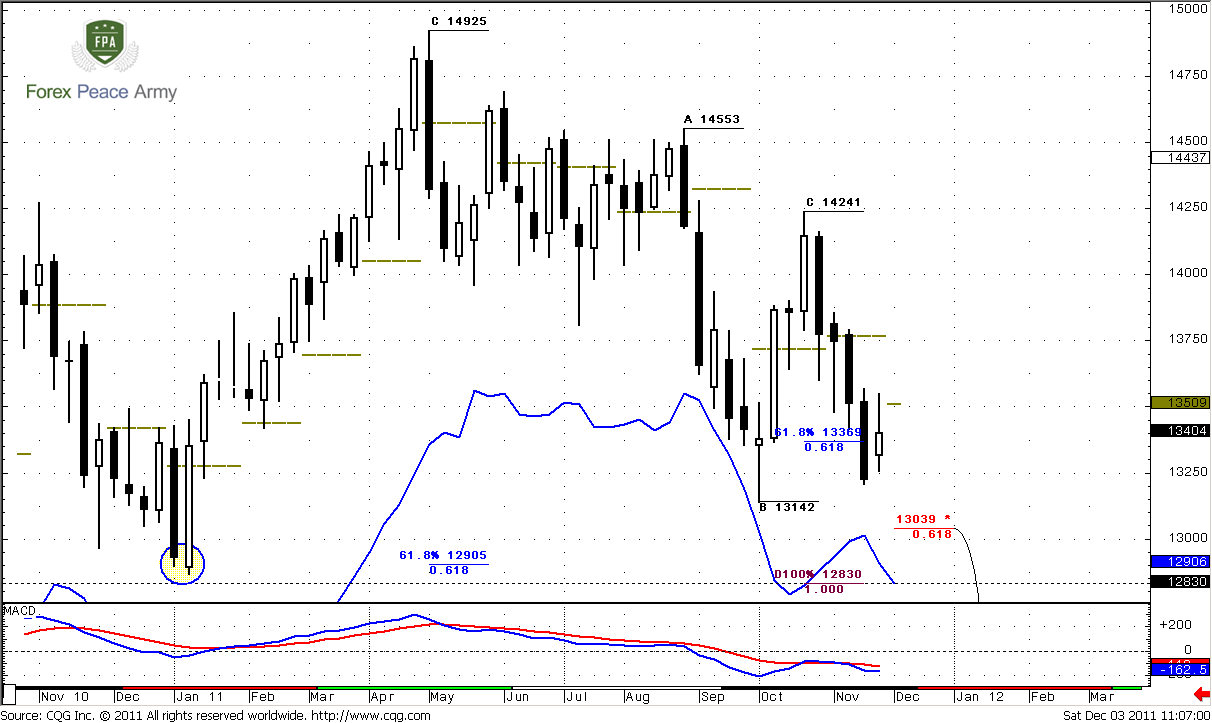
In general, long-term analysis is quite the same for current week, since market just formed inside week – it does not add much action on the chart. Weekly trend is strongly bearish. Our major focus in medium-term perspective is most recent AB=CD pattern with target at 1.2830 and weekly oversold – very close to monthly Agreement. Monthly and weekly analysis tell that market should continue move to the downside, at least to 1.28-1.30 area – both trends are bearish, no oversold and absence of any solid support levels below the market.
Daily
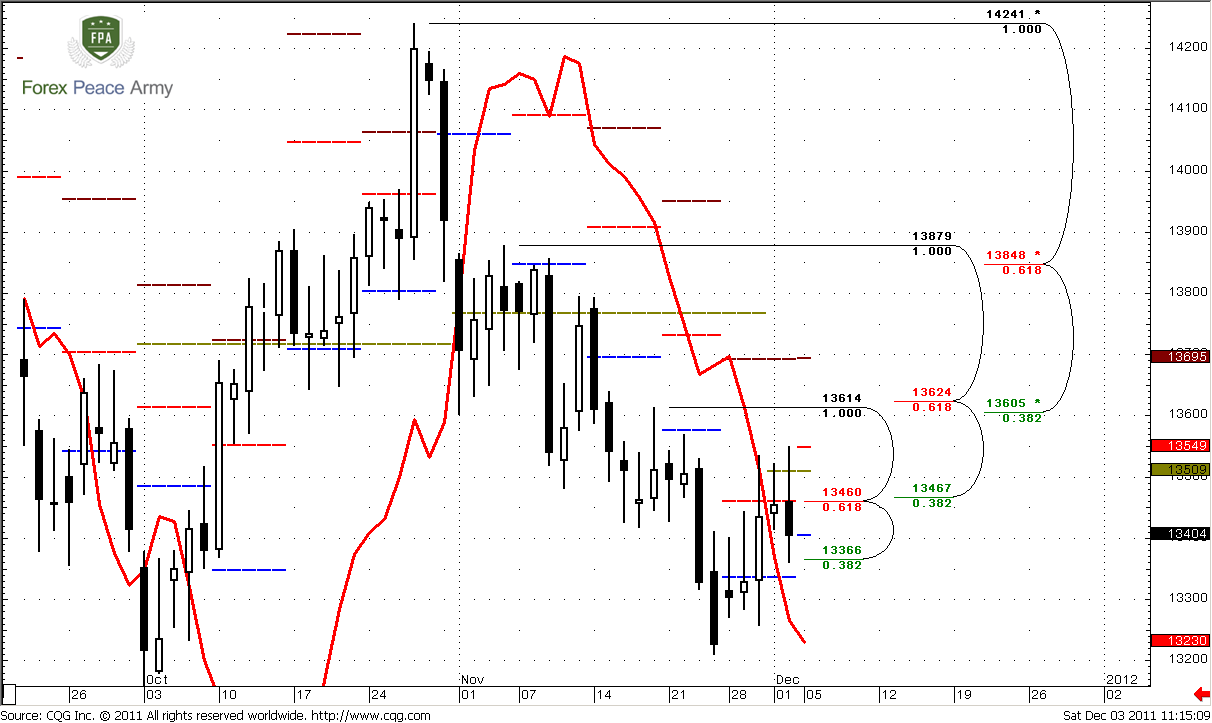
So, retracement that we’ve discussed on previous week – right to pivot resistance 1 has happened. Actually, it seems that market hints on downward continuation – at least there are more signs of that, rather than upward continuation. In fact, the only bullish sign is trend – it’s bullish, but take a look at price action. Bearish dynamic pressure on daily time frame could start on coming week. This is the first issue that we will have to keep an eye on. Second, market was not able to close above pivot resistance 1 for 3 days in a row, despite the fact that it has deeply pierced this level of strong resistance that also includes daily K-area. I can’t say that this Fib level still works, because penetration was really solid, but this is the fact – market has held whole the week below it. Third, this was 1.0 Extension target of AB=CD pattern and market has not even reached 1.3605 – 0.382 Fib resistance level. Usually, if even market reaches 0.618 resistance after completing of AB=CD – this is treated as normal price action. The last one is Friday’s trading bar – this is reversal bar. IT has created new high and close below the low of previous trading session. This is bearish price action.
Although market still could show, say, deeper AB=CD retracement or something like that right to next K-resistance around 1.36-1.3630, but currently there are no signs of it on daily time frame.
4-hour
This time frame is not as simple as it seems. I know that we see W&R of previous high, solid plunge by NFP release and bearish trend. But – market has reached just 0.618 Fib support after hitting of AB-CD target. This is normal. Another question is why this retracement was so fast – this adds bearishness to overall price action and taking into consideration all stuff that we’ve discussed – there is a high probability that this is a real continuation to the 1.2850-1.30 area. Still, probably it’s better to wait a bit more confirmation. Again – here we are dealing with personality. Somebody of you, may be decide to enter as soon as possible – this will not be mistake, this is already that is called personality and risk sensitivity. One of these confirmations could become taking a low at “c” point and erasing current AB-CD pattern that is still valid. Also it will erase positive splash by upward long candle – market will return again to previous assessment of European risks.
Colored lines on the chart are pivot (blue) at 1.3405 and pivot resistance 1 at 1.3549 (red).
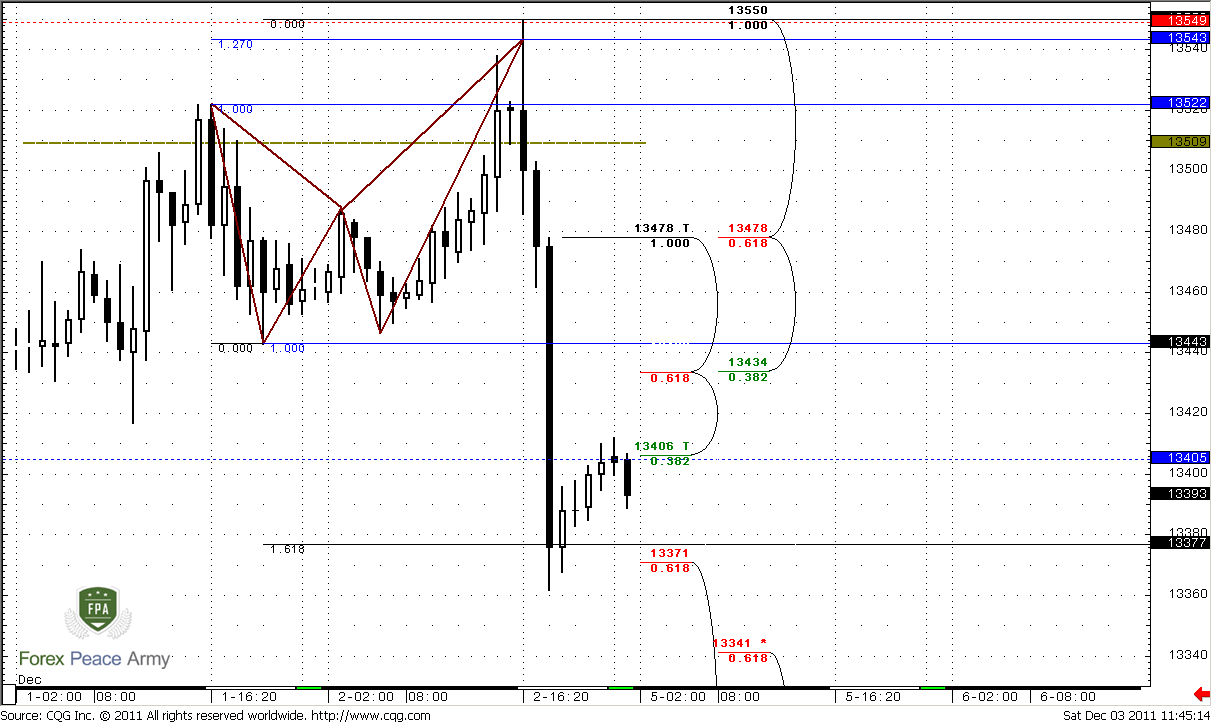
Hourly
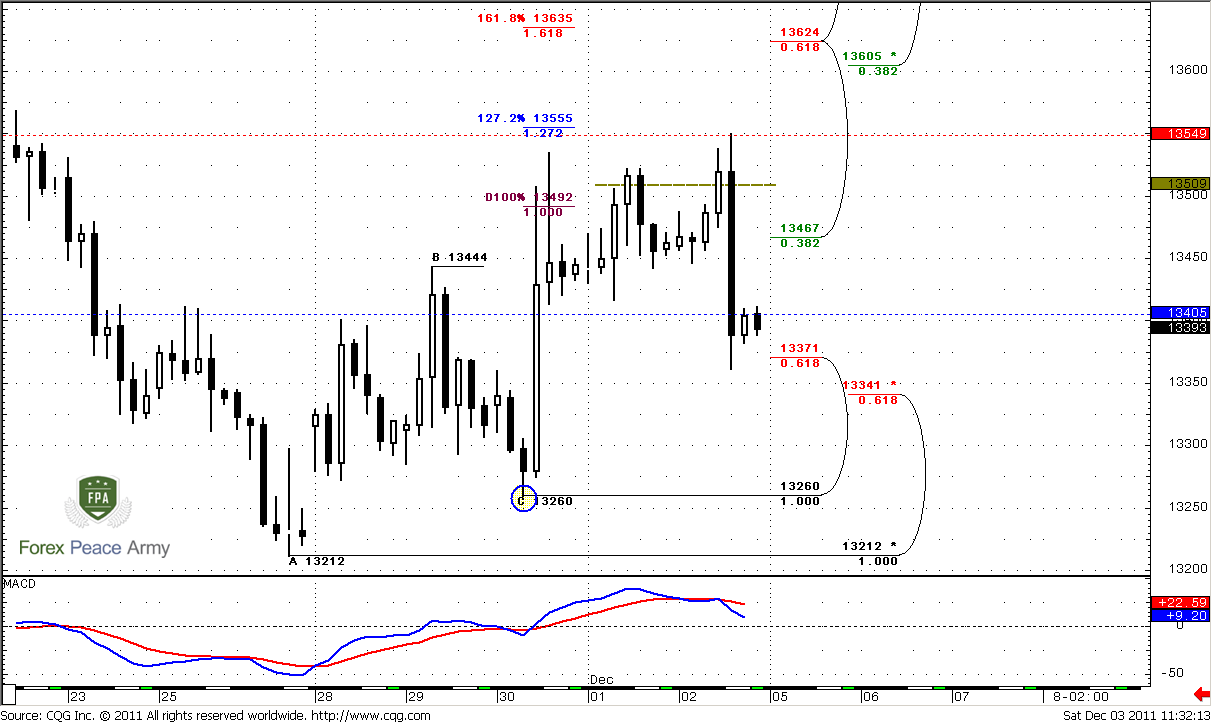
As you can see, our trading plan for Friday has been completed. Market has reached our nearest upward target at 1.3550 area and accomplished smaller butterfly “Sell”. Even more, market has reached 1.618 target of that pattern at 1.3377 – right near 0.618 Fib support.
So, if you still would like to enter short on Monday (may be this is not bad idea), then there are two things that you should keep an eye on. First signal in your favor will be, if market will continue move below 1.3340 – other words will break 0.618 Fib support on 4-hour time frame. This will move under question further continuation to the upside (also it seems that probability is not too much anyway). Second, market should not break 1.3478 hourly Fib resistance. Preferably if it will stay even below 1.3445 that includes K-resistance area + 50% resistance nasty down bar+ classical resistance.
Now, how to enter? Since plunge was really solid, you may try to enter with small lot right from 1.3410 – around pivot point, because market, if it will be aggressive could start falling right from this level. IF it will turn to AB-CD retracement up – then you will add more on Agreement around 1.3430-1.3440 area.
Conclusion:
Long-term bias looks solidly bearish. It makes sense to hold long-term bearish positions.
In short term perspective market has not destroyed all bridges to upward continuation yet. Theoretically there are some chances for deeper AB-CD retracement on daily right to 1.36-1.3630 K-resistance area. That’s why during coming week we have to keep an eye on possible bearish dynamic pressure on daily time frame.
Now it seems so, that probably market has reestablished downward move with medium-term trend. There are two ways how you may act. First, as we’ve discussed in hourly part of research. Second is to wait stronger confirmation of retracement end – moving below 1.3250 area. Still you may apply both of them – just split your trading position.
The technical portion of Sive's analysis owes a great deal to Joe DiNapoli's methods, and uses a number of Joe's proprietary indicators. Please note that Sive's analysis is his own view of the market and is not endorsed by Joe DiNapoli or any related companies.
Our long-term forecast, that assumes possible move to 1.15 area still holds. Monthly trend is bearish, and, in general, we can see downward move during November. Market stands neither at oversold nor at overbought, next support area is 1.2905-1.3040. Pay attention that as this target as next one around 1.15 area stands below previous lows. It means that these lows hardly will hold if market will reach them, of cause.
Weekly
In general, long-term analysis is quite the same for current week, since market just formed inside week – it does not add much action on the chart. Weekly trend is strongly bearish. Our major focus in medium-term perspective is most recent AB=CD pattern with target at 1.2830 and weekly oversold – very close to monthly Agreement. Monthly and weekly analysis tell that market should continue move to the downside, at least to 1.28-1.30 area – both trends are bearish, no oversold and absence of any solid support levels below the market.
Daily
So, retracement that we’ve discussed on previous week – right to pivot resistance 1 has happened. Actually, it seems that market hints on downward continuation – at least there are more signs of that, rather than upward continuation. In fact, the only bullish sign is trend – it’s bullish, but take a look at price action. Bearish dynamic pressure on daily time frame could start on coming week. This is the first issue that we will have to keep an eye on. Second, market was not able to close above pivot resistance 1 for 3 days in a row, despite the fact that it has deeply pierced this level of strong resistance that also includes daily K-area. I can’t say that this Fib level still works, because penetration was really solid, but this is the fact – market has held whole the week below it. Third, this was 1.0 Extension target of AB=CD pattern and market has not even reached 1.3605 – 0.382 Fib resistance level. Usually, if even market reaches 0.618 resistance after completing of AB=CD – this is treated as normal price action. The last one is Friday’s trading bar – this is reversal bar. IT has created new high and close below the low of previous trading session. This is bearish price action.
Although market still could show, say, deeper AB=CD retracement or something like that right to next K-resistance around 1.36-1.3630, but currently there are no signs of it on daily time frame.
4-hour
This time frame is not as simple as it seems. I know that we see W&R of previous high, solid plunge by NFP release and bearish trend. But – market has reached just 0.618 Fib support after hitting of AB-CD target. This is normal. Another question is why this retracement was so fast – this adds bearishness to overall price action and taking into consideration all stuff that we’ve discussed – there is a high probability that this is a real continuation to the 1.2850-1.30 area. Still, probably it’s better to wait a bit more confirmation. Again – here we are dealing with personality. Somebody of you, may be decide to enter as soon as possible – this will not be mistake, this is already that is called personality and risk sensitivity. One of these confirmations could become taking a low at “c” point and erasing current AB-CD pattern that is still valid. Also it will erase positive splash by upward long candle – market will return again to previous assessment of European risks.
Colored lines on the chart are pivot (blue) at 1.3405 and pivot resistance 1 at 1.3549 (red).
Hourly
As you can see, our trading plan for Friday has been completed. Market has reached our nearest upward target at 1.3550 area and accomplished smaller butterfly “Sell”. Even more, market has reached 1.618 target of that pattern at 1.3377 – right near 0.618 Fib support.
So, if you still would like to enter short on Monday (may be this is not bad idea), then there are two things that you should keep an eye on. First signal in your favor will be, if market will continue move below 1.3340 – other words will break 0.618 Fib support on 4-hour time frame. This will move under question further continuation to the upside (also it seems that probability is not too much anyway). Second, market should not break 1.3478 hourly Fib resistance. Preferably if it will stay even below 1.3445 that includes K-resistance area + 50% resistance nasty down bar+ classical resistance.
Now, how to enter? Since plunge was really solid, you may try to enter with small lot right from 1.3410 – around pivot point, because market, if it will be aggressive could start falling right from this level. IF it will turn to AB-CD retracement up – then you will add more on Agreement around 1.3430-1.3440 area.
Conclusion:
Long-term bias looks solidly bearish. It makes sense to hold long-term bearish positions.
In short term perspective market has not destroyed all bridges to upward continuation yet. Theoretically there are some chances for deeper AB-CD retracement on daily right to 1.36-1.3630 K-resistance area. That’s why during coming week we have to keep an eye on possible bearish dynamic pressure on daily time frame.
Now it seems so, that probably market has reestablished downward move with medium-term trend. There are two ways how you may act. First, as we’ve discussed in hourly part of research. Second is to wait stronger confirmation of retracement end – moving below 1.3250 area. Still you may apply both of them – just split your trading position.
The technical portion of Sive's analysis owes a great deal to Joe DiNapoli's methods, and uses a number of Joe's proprietary indicators. Please note that Sive's analysis is his own view of the market and is not endorsed by Joe DiNapoli or any related companies.
") )
)