EUR/USD Daily Video, December 12, 2011

Sive Morten

Special Consultant to the FPA
Messages
18,648
Good morning,
Long term bearish context is still intact. Still market still could show some upward continuation on daily time frame. Daily traders could use it to enter short, while intraday traders could try to enter Long:


The technical portion of Sive's analysis owes a great deal to Joe DiNapoli's methods, and uses a number of Joe's proprietary indicators. Please note that Sive's analysis is his own view of the market and is not endorsed by Joe DiNapoli or any related companies.
 
Last edited by a moderator:
Hello Sive,

Many thanks for your time. I have often times noticed that your price levels are different from mine by as much as 40 pips. So as a result when the price hits one of the levels you forecast my charts miss the mark. I use PFGBest and IBFX in the United States. I was wondering if you would take a minute and explain how this difference in price levels effects your briefings and how one could maybe correct for the different levels? I am able to generate Fib levels based on my charts but my PP, S1 and R1 are almost never the same as yours. I have an idea as to why this is but I want to make sure I am not going crazy... :)
Hi Sazu,
This difference is due using of futures quotes, instead of spot ones. Futures quotes a bit lower, because they also includes rate difference for contract term. As closer futures to expiration as closer futures price to spot one. This 40 pips difference will not be constant over time.
Your pivots are different from mine by the same reason. Check formulas in forex military school or in terms and definitions in root thread. IF your formulas are the same - hence you do everything correct.
 
I followed this analysis to buy.. Then wait for the rebound to the downside, and ive just been stopped out and lost a lot of pips as it plunged downwards.. Not good..
 
I followed this analysis to buy.. Then wait for the rebound to the downside, and ive just been stopped out and lost a lot of pips as it plunged downwards.. Not good..

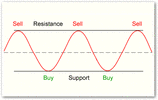
If trading were that easy, the chart would look like the curve on the pic below :).

TradingIsEasy.gif
 
I followed this analysis to buy.. Then wait for the rebound to the downside, and ive just been stopped out and lost a lot of pips as it plunged downwards.. Not good..

I dont where you got the idea that the analysis told you to buy????

If you follow this forum on a regular basis you will find it outlines all scenarios of what may happen,and is not a signalling service.
It is aimed at all types of traders from Positional to Scalpers.

Best of luck!
 
I dont where you got the idea that the analysis told you to buy????

If you follow this forum on a regular basis you will find it outlines all scenarios of what may happen,and is not a signalling service.
It is aimed at all types of traders from Positional to Scalpers.

Best of luck!

I'm aware of that, but the Analysis title itself says short buy 'till just below the tip of the triangle, then a plunge downwards and breakout, if you watched it you can see that. However unfortunately I chose one of the scenarios which did not happen, and it did not go up at all, just plunged down, which is why & where I got quite a loss. Unfortunate, but next time I will have to move my stops closer, it's a shame to loose but trading is a rollercoaster I guess, and can't really be predicted by anyone for sure, I look forward to the next profitable day.

Has anyone baught and tried the Dinapoli indicators and used them for analysis by the way?

Thanks & hope most of you made money on this, and were not so blindly careless like myself. :(
 
I followed this analysis to buy.. Then wait for the rebound to the downside, and ive just been stopped out and lost a lot of pips as it plunged downwards.. Not good..

Dear Louis,
I'm really sorry, that you've lost some of your assets. I'm telling this without any sarcasm. I'm really get worried when people lose money when use my analysis. There are some reasons for that:

1. Most of all solid losses comes from misunderstanding the way how I analyze the market. To use it properly we should apply the same technique. For instance, in our weekly research we said, that market should move higher because hourly trend is bullish and by AB-CD pattern. What should we do, if market has taken the low of "C" point at 1.3325 and turned hourly trend to bearish? should we wait upward continuation? Probably not. But this conclusion comes from technique. So, if you do not quite understand the context and its invalidation point - it's better to not follow my analysis blindly. Make your own trading plan, use (or do not use) some of my ideas if you like them - but trade what personally you understand at 100%. I can't predict everything and tell what to do in all cases. So, you have to understand invalidation points of those patterns that I use to based my analysis on.

2. I'm not the prophet and just share with you my opinion and view on the market. I may be wrong - that happens very often.

3. As this was said already - this is not a signal service. Here we discuss different approaches to market. This is more educational part of the forum, rather than signaling. You should understand it, since I have not said where to place stop and profit.
 
Back
Top