Sive Morten
Special Consultant to the FPA
- Messages
- 18,644
Monthly
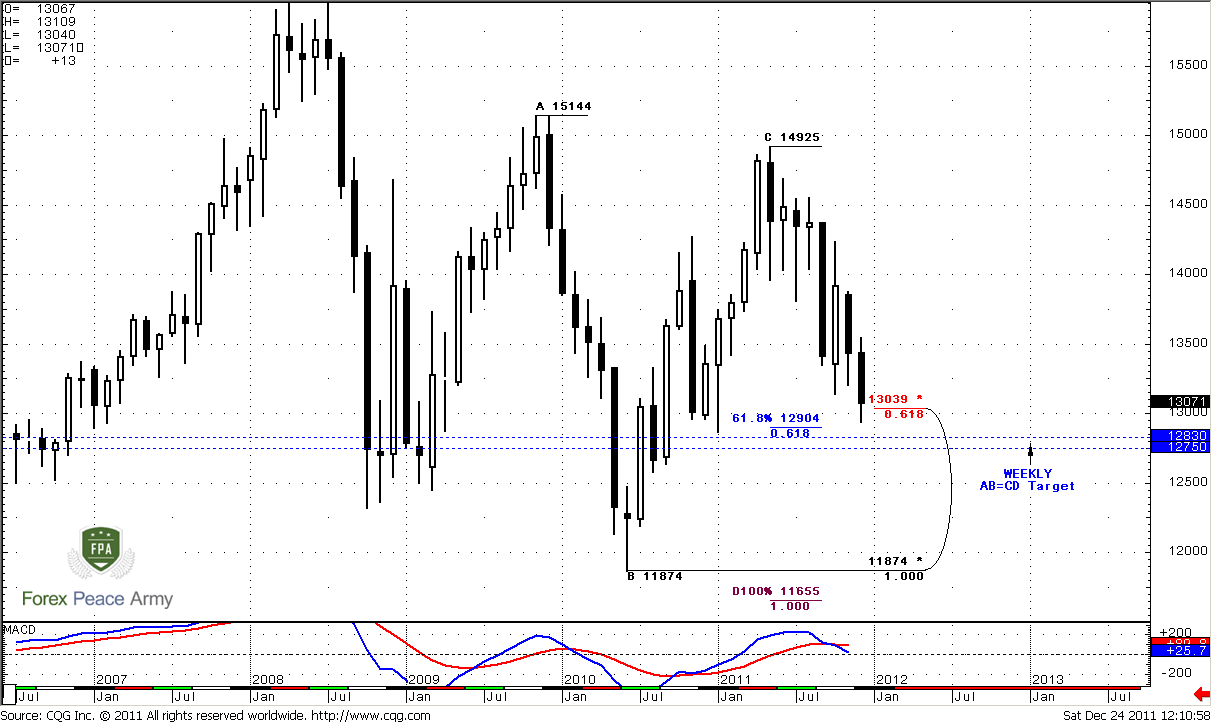
December month gradually comes to an end, and currently we see solid bearish price action by this month. Monthly trend holds bearish, market is not at oversold. So, long-term bearish bias still holds intact. Meantime, the most important information for us on monthly time frame is Agreement support level of 1.2905-1.3040. Since market has reached it – this is not the time currently think about increasing short position on lower time frames. Although we all know that anything could happen, market could just absolutely disrespect this level by some emergency event from EU, but we have to act according to current situation. Now, what we do see is that market at monthly Agreement. Probability suggests that commonly it leads to some retracement – either deep or small.
Another important moment is that weekly/daily AB=CD target that we are trading currently stands slightly lower that Agreement level. It could happen so, that retracement will start when market will pierce a bit monthly Agreement just to reach weekly AB=CD, because 100 pips move on monthly is a very small difference – it could be even seen on the chart. Currently puzzle is collecting – first, we see strong support at monthly, then we see AB=CD target at the same level on weekly, and, as we’ve discussed yesterday, there is a hint that probably on daily we will see 3-Drive “Buy”. All lower charts confirm monthly. So, this gives more confidence to this assumption.
Weekly
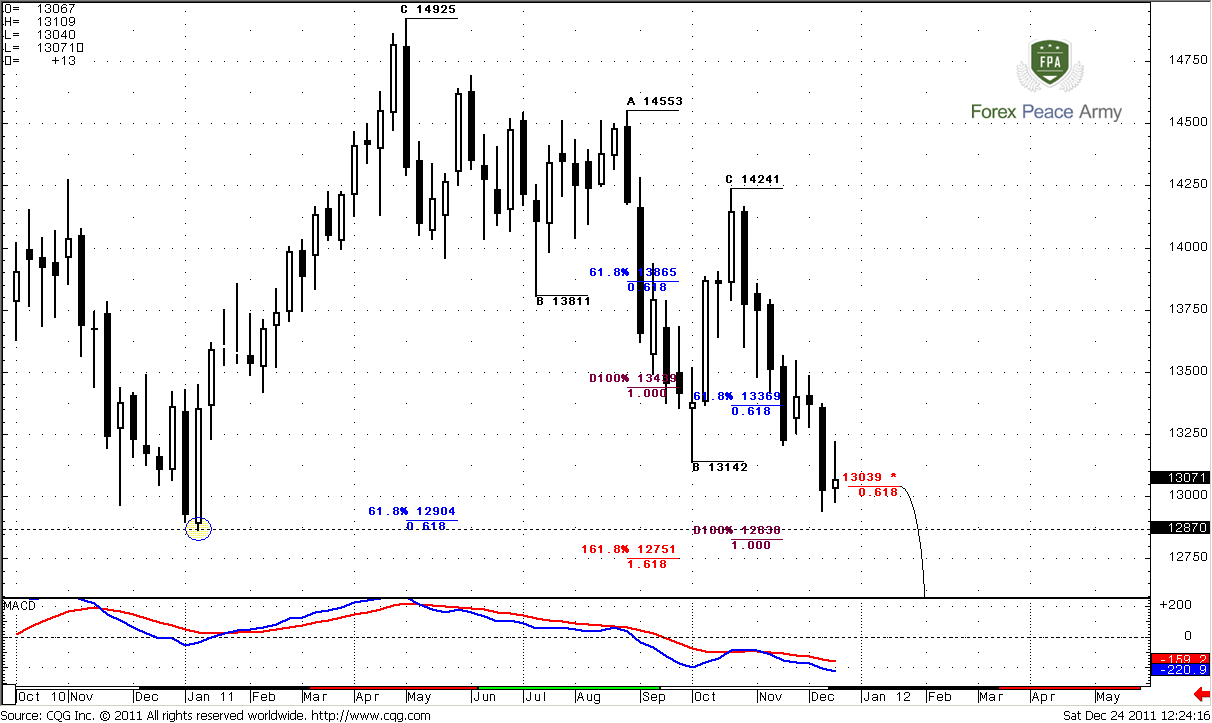
Trend holds bearish well. Market is not at oversold. Passed week was inside one for previous solid move down. From that point of view we do not see any development. Here you can just better see AB=CD pattern and its target. By the way, take a note that target stands slightly lower than previous significant 1.2870 low, so market could proceed slightly lower, fueled by stop triggering. In this case it can trigger 1.618 extension of different AB-CD at 1.2750 as well.
Here again I have to warn you that market in nearest days will have to struggle against monthly support. It might look as deeper retracements, pullbacks more choppiness on intraday charts and so on. So, if you’re long-term trader and want to increase position – it’s better to wait when this pullback will start or when there will be some clear signs that it will not happen at all. Otherwise, you may get to very desirable entry and even less desirable pullback after that. But still - the decision is yours.
Daily
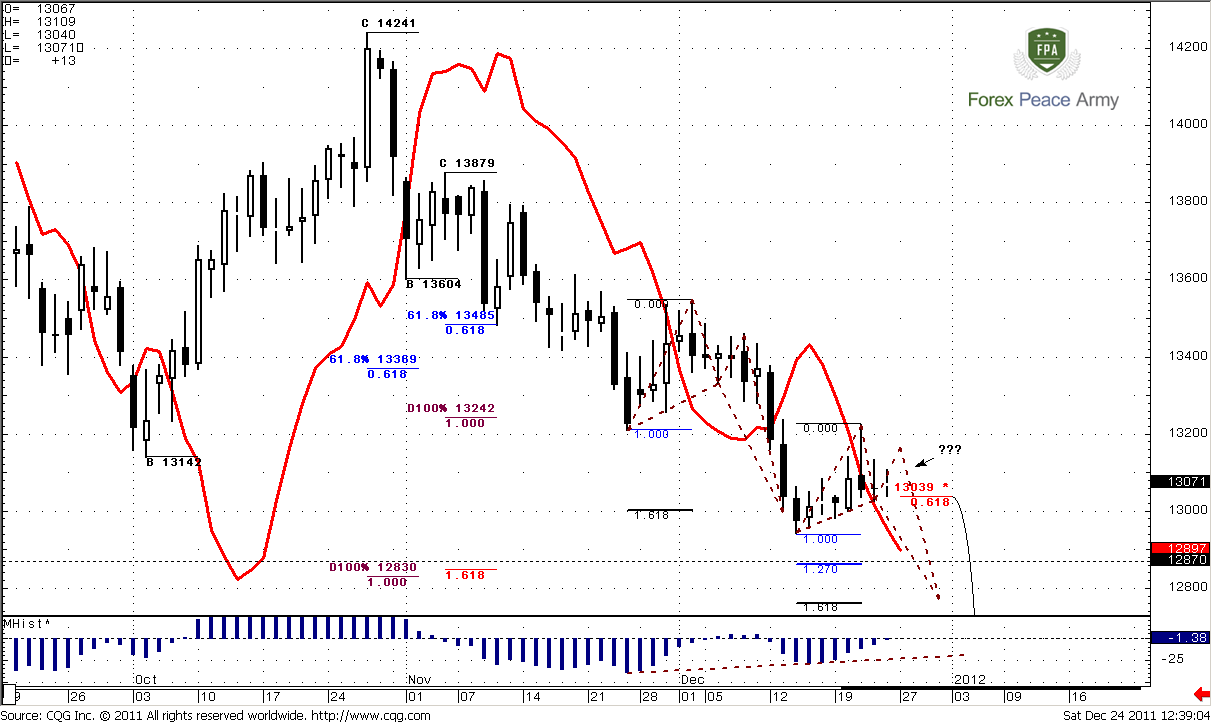
As previous two time frames are not so interesting as daily time frame contains a lot of intriguing stuff. On the first chart we see patterns that we’ve partially discussed on Friday. We know that market stands at monthly Agreement, second, 100 pips below market around 1.28 stand two weekly targets – 1.0 AB-CD and 1.618 of another Extension. Here is also 1.618 of daily AB-CD pattern. Since we know it, we have to expect possible pattern that could trigger retracement up. Although we all know that anything possible, our analysis should be based on probability and logic. To expect here reversal pattern is logical due the reasons that we’ve just discussed. So, let’s pass to their discussion.
Once, in our Forex Military School we’ve discussed 3-Drive pattern compounding and said that from time to time, rather often, it could consist of side-by-side butterflies (on chart #5):
https://www.forexpeacearmy.com/forex-forum/chapter-17/17337-chapter-17-part-iv-3-drive-pattern-harmony-classical-patterns.html
Current price action makes me think that this is very probable on daily time frame. Take a look, first butterfly was 1.618 one – that was a second drive. IF market will create another 1.618 butterfly, then its target will be around 1.28 – the same area as other targets. May be it even could be used as a triggering pattern to enter long. IF this will really happen – this will complete 1.618 3-Drive “Buy” pattern with minimum target 1.32-1.3250.
Another important moment is MACD Histogram. If you will take a look at simple MACD, you will not see any divergence. Histogram is showing divergence, but this one is another kind – it shows market’s momentum, and we see that momentum of most recent low (potential 2nd drive) become weaker. That is very common, when 3-Drive pattern is forming.
On second chart we see that although daily trend holds bullish, market does not quite support this. Previous couple of days was inside trading sessions that is not a surprise before Christmas. In fact market holds in a range of our stop grabber pattern that is still valid. Normal price action suggests downward continuation to targets that we’ve specified above.
Also pay attention that since market action was tight – pivot point stands very close to current price action. Our crucial level is still the same – 1.3224 stop grabber’s high. Market should not take it, otherwise stronger move up could happen.
4-hour
Since market stands tight, this is the same picture as on Friday. 1.3093 is a pivot point for next week. Although trend holds bearish, this is not very informative, since market stands flat. Still there is one thing that tells, that probably market could show upward move, because current price action reminds bullish dynamic pressure – when trend has held bearish, price action stands flat. Potential areas that market could reach are 1.31 and 1.3189 – 0.618 extension of large AB-CD pattern. Both of them are suitable for potential butterfly.
1-hour
Trend holds bearish. Most important for us here are lower trend line and C point at 1.3029. If market will break it to the downside, then probably it will mean that downward move has been reestablished. Probably that already has happened – as 4-hour as hourly trend has turned bearish. Also we have upper resistance line, so we do not want to see deep penetration of it. Still we can’t exclude possible reaching of any of levels – 1.31-1.3120, 1.3150 or 1.3190 – that will not break and idea of butterfly on 4-hour time frame.
Conclusion:
Long-term bias holds bearish. It makes sense to hold long-term bearish positions. Still do not be to hurry to add more. Odds suggest that some retracement could happen. Probably it will be better to add more when it will happen.
On daily time frame we expect completing of reversal pattern, so here we have to keep an eye on it’s development. If something will go wrong then we have to sit on our hands and wait for clear signs to understand what we might expect.
Since we have inside week and 2 inside days, market is building energy - as we already know this usually happens, before any breakout. Current price action tells that it should happen to the downside.
On intraday charts we have to keep an eye on two levels. First one is crucial for short-term perspective – high 1.3224 of stop grabber pattern. Second – lower trend line and C point at 1.3029. If market will break the line and take this low, probability of downward continuation will significantly increase.
The technical portion of Sive's analysis owes a great deal to Joe DiNapoli's methods, and uses a number of Joe's proprietary indicators. Please note that Sive's analysis is his own view of the market and is not endorsed by Joe DiNapoli or any related companies.
December month gradually comes to an end, and currently we see solid bearish price action by this month. Monthly trend holds bearish, market is not at oversold. So, long-term bearish bias still holds intact. Meantime, the most important information for us on monthly time frame is Agreement support level of 1.2905-1.3040. Since market has reached it – this is not the time currently think about increasing short position on lower time frames. Although we all know that anything could happen, market could just absolutely disrespect this level by some emergency event from EU, but we have to act according to current situation. Now, what we do see is that market at monthly Agreement. Probability suggests that commonly it leads to some retracement – either deep or small.
Another important moment is that weekly/daily AB=CD target that we are trading currently stands slightly lower that Agreement level. It could happen so, that retracement will start when market will pierce a bit monthly Agreement just to reach weekly AB=CD, because 100 pips move on monthly is a very small difference – it could be even seen on the chart. Currently puzzle is collecting – first, we see strong support at monthly, then we see AB=CD target at the same level on weekly, and, as we’ve discussed yesterday, there is a hint that probably on daily we will see 3-Drive “Buy”. All lower charts confirm monthly. So, this gives more confidence to this assumption.
Weekly
Trend holds bearish well. Market is not at oversold. Passed week was inside one for previous solid move down. From that point of view we do not see any development. Here you can just better see AB=CD pattern and its target. By the way, take a note that target stands slightly lower than previous significant 1.2870 low, so market could proceed slightly lower, fueled by stop triggering. In this case it can trigger 1.618 extension of different AB-CD at 1.2750 as well.
Here again I have to warn you that market in nearest days will have to struggle against monthly support. It might look as deeper retracements, pullbacks more choppiness on intraday charts and so on. So, if you’re long-term trader and want to increase position – it’s better to wait when this pullback will start or when there will be some clear signs that it will not happen at all. Otherwise, you may get to very desirable entry and even less desirable pullback after that. But still - the decision is yours.
Daily
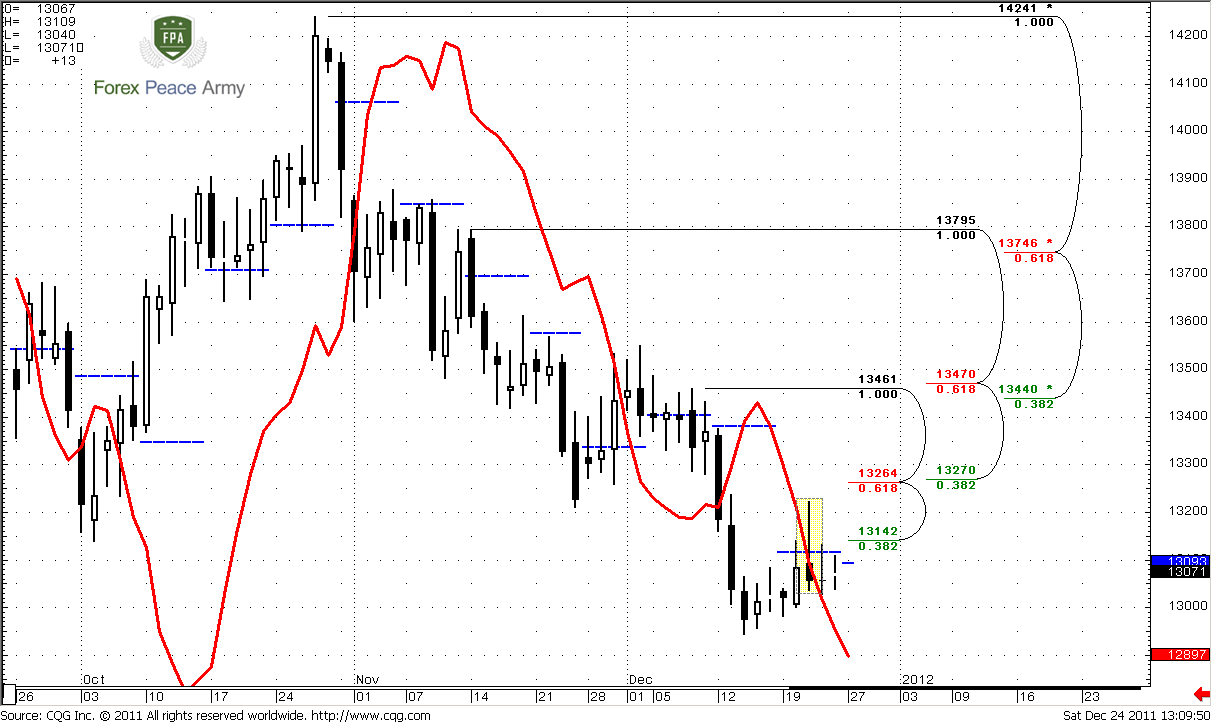
As previous two time frames are not so interesting as daily time frame contains a lot of intriguing stuff. On the first chart we see patterns that we’ve partially discussed on Friday. We know that market stands at monthly Agreement, second, 100 pips below market around 1.28 stand two weekly targets – 1.0 AB-CD and 1.618 of another Extension. Here is also 1.618 of daily AB-CD pattern. Since we know it, we have to expect possible pattern that could trigger retracement up. Although we all know that anything possible, our analysis should be based on probability and logic. To expect here reversal pattern is logical due the reasons that we’ve just discussed. So, let’s pass to their discussion.
Once, in our Forex Military School we’ve discussed 3-Drive pattern compounding and said that from time to time, rather often, it could consist of side-by-side butterflies (on chart #5):
https://www.forexpeacearmy.com/forex-forum/chapter-17/17337-chapter-17-part-iv-3-drive-pattern-harmony-classical-patterns.html
Current price action makes me think that this is very probable on daily time frame. Take a look, first butterfly was 1.618 one – that was a second drive. IF market will create another 1.618 butterfly, then its target will be around 1.28 – the same area as other targets. May be it even could be used as a triggering pattern to enter long. IF this will really happen – this will complete 1.618 3-Drive “Buy” pattern with minimum target 1.32-1.3250.
Another important moment is MACD Histogram. If you will take a look at simple MACD, you will not see any divergence. Histogram is showing divergence, but this one is another kind – it shows market’s momentum, and we see that momentum of most recent low (potential 2nd drive) become weaker. That is very common, when 3-Drive pattern is forming.
On second chart we see that although daily trend holds bullish, market does not quite support this. Previous couple of days was inside trading sessions that is not a surprise before Christmas. In fact market holds in a range of our stop grabber pattern that is still valid. Normal price action suggests downward continuation to targets that we’ve specified above.
Also pay attention that since market action was tight – pivot point stands very close to current price action. Our crucial level is still the same – 1.3224 stop grabber’s high. Market should not take it, otherwise stronger move up could happen.
4-hour
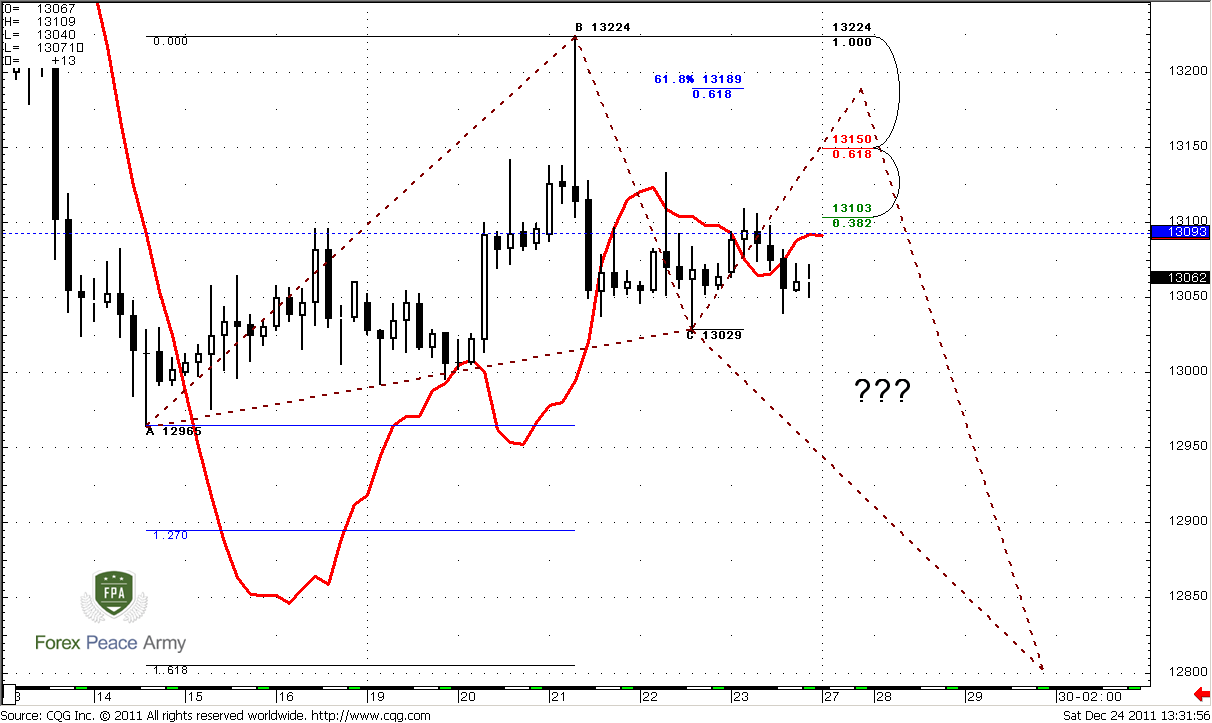
Since market stands tight, this is the same picture as on Friday. 1.3093 is a pivot point for next week. Although trend holds bearish, this is not very informative, since market stands flat. Still there is one thing that tells, that probably market could show upward move, because current price action reminds bullish dynamic pressure – when trend has held bearish, price action stands flat. Potential areas that market could reach are 1.31 and 1.3189 – 0.618 extension of large AB-CD pattern. Both of them are suitable for potential butterfly.
1-hour
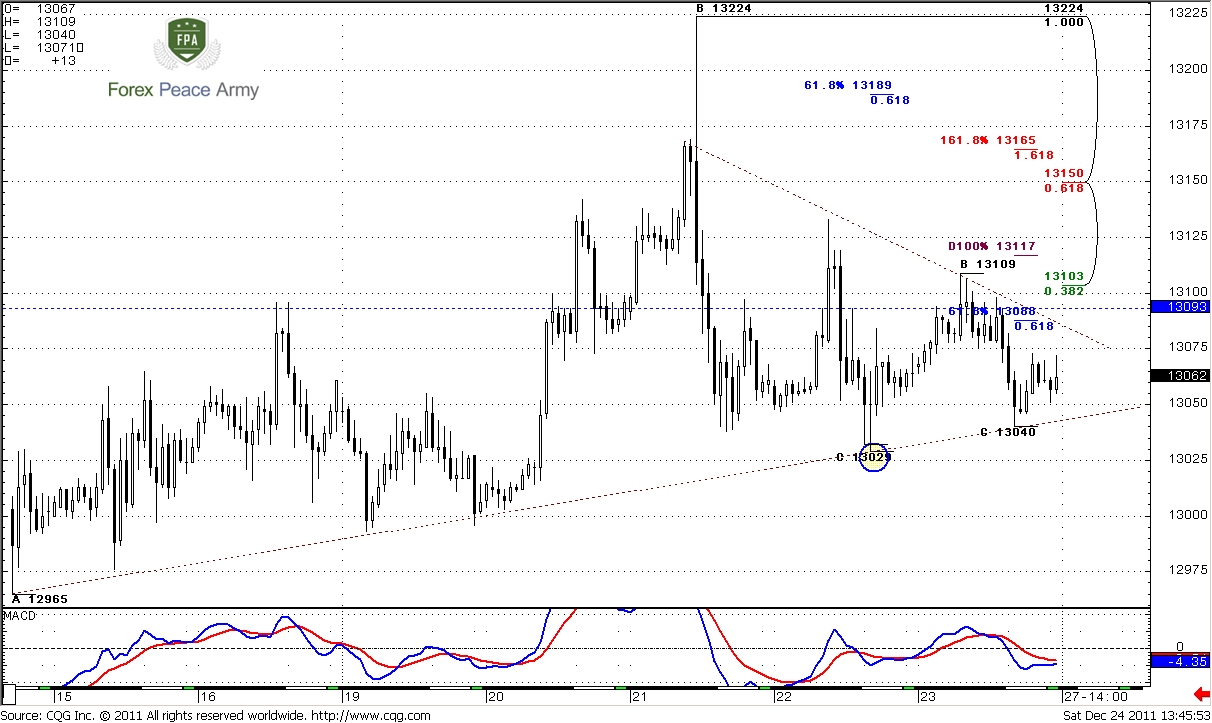
Trend holds bearish. Most important for us here are lower trend line and C point at 1.3029. If market will break it to the downside, then probably it will mean that downward move has been reestablished. Probably that already has happened – as 4-hour as hourly trend has turned bearish. Also we have upper resistance line, so we do not want to see deep penetration of it. Still we can’t exclude possible reaching of any of levels – 1.31-1.3120, 1.3150 or 1.3190 – that will not break and idea of butterfly on 4-hour time frame.
Conclusion:
Long-term bias holds bearish. It makes sense to hold long-term bearish positions. Still do not be to hurry to add more. Odds suggest that some retracement could happen. Probably it will be better to add more when it will happen.
On daily time frame we expect completing of reversal pattern, so here we have to keep an eye on it’s development. If something will go wrong then we have to sit on our hands and wait for clear signs to understand what we might expect.
Since we have inside week and 2 inside days, market is building energy - as we already know this usually happens, before any breakout. Current price action tells that it should happen to the downside.
On intraday charts we have to keep an eye on two levels. First one is crucial for short-term perspective – high 1.3224 of stop grabber pattern. Second – lower trend line and C point at 1.3029. If market will break the line and take this low, probability of downward continuation will significantly increase.
The technical portion of Sive's analysis owes a great deal to Joe DiNapoli's methods, and uses a number of Joe's proprietary indicators. Please note that Sive's analysis is his own view of the market and is not endorsed by Joe DiNapoli or any related companies.