FOREX PRO Weekly January 30-February 03, 2012

shabbaz, leave an email address where i can contact you in my private box, here on the FPA site, and i will email you the 2 mq4 files you need to get the MACDPredictor to work properly.

as to the DMA 3x3, all you need to do is overlay on your chart a regular 3-period SMA and shift it right by 3 periods. that easy. :)
 
ok, beekay... let's see if we can clarify this.


from how you define 'reaction numbers', it seems that they are what i called L' or H' in my previous post, i.e. the bottom or high of a retrace/pullback within the main trend, which is the larger move up or down (or what you call 'market swing').


so the main or larger market swing would be defined by 2 extreme points: L and H, the low and high (high is what you call the 'focus point'). and within that, we may have other lows (what i denote by L' and H') or highs (like waves in an elliott wave context).


so, on the MT4 platform, to draw a fib retracement structure for a bullish trend, for ex., you would position your mouse at the lowest point of that trend, meaning the point where the candle shadow/wick ends if there were a shadow/wick, and drag all the way up to the highest point of that trend/market swing.


MT4 will display the various fib levels/nodes as horizontal lines. and they will not necessarily coincide with what you call 'reaction points/numbers'.


you can repeat the whole procedure by starting from each reaction point (meaning each reaction point would be the low extreme and starting point of the draw of a new fib retrace structure), which i understand is a low on a pullback from the main move up (what i call L')--the example here assume a bull move.


does that make more sense?

Thanks for your help, but I do not think we still are talking about the same thing.

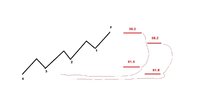
In my example, the Market Swing up with four Reaction Points has EIGHT FIBNODES. In order to draw Fibnodes from the Reaction points, I am assuming you must start the Fibonacci from the FOCUS POINT.

Attached is an image to help clarify my question, Sive. I just do not understand which ones would be 38.2 or 61.8!

Let's say I want to get Reaction 4 Fibnodes. I would go from F to 4, thus making the upper red line for Reaction 4 61.8 and the lower red line for Reaction 4 38.2?

Also, I just want to make sure that to get the Fibnodes and K areas for the Reaction Points, I would draw Fibonacci from F to Reaction 4, then F to Reaction 3, then F to Reaction 2, and so on, or would I go from F to Reaction 1, and then Reaction 1 to Reaction 2 as another Fibonacci, and Reaction 2 to Reaction 3 as another Fibonacci?

Thanks Sive!

fib.jpg
 
shabbaz, leave an email address where i can contact you in my private box, here on the FPA site, and i will email you the 2 mq4 files you need to get the MACDPredictor to work properly.

as to the DMA 3x3, all you need to do is overlay on your chart a regular 3-period SMA and shift it right by 3 periods. that easy. :)

Triantus- Though I don't post very often, I am an avid, daily follower of Sive's info and appreciate all you do to promote and make this forum better. With that, if you would be kind enough to do so, please add me to your email list to receive the 2 MQ4 files for the MT4 MACD Predictor of which you spoke.

I am at: drebg@yahoo.com and may also be reached on my blog at InformedTrades.com.

Thanks so much! :)
 
thanks Sive again for your help and analysis hope you had a great weekend
 
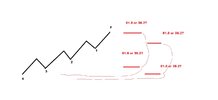
I hope this clarify. fib.jpg

Thanks for your help, but I do not think we still are talking about the same thing.

In my example, the Market Swing up with four Reaction Points has EIGHT FIBNODES. In order to draw Fibnodes from the Reaction points, I am assuming you must start the Fibonacci from the FOCUS POINT.

Attached is an image to help clarify my question, Sive. I just do not understand which ones would be 38.2 or 61.8!

Let's say I want to get Reaction 4 Fibnodes. I would go from F to 4, thus making the upper red line for Reaction 4 61.8 and the lower red line for Reaction 4 38.2?

Also, I just want to make sure that to get the Fibnodes and K areas for the Reaction Points, I would draw Fibonacci from F to Reaction 4, then F to Reaction 3, then F to Reaction 2, and so on, or would I go from F to Reaction 1, and then Reaction 1 to Reaction 2 as another Fibonacci, and Reaction 2 to Reaction 3 as another Fibonacci?

Thanks Sive!

View attachment 4720
 
1.PNG
Thanks a lot for you clarification. I appreciate your work.

I have another question. In order to get Confluence K, you must get the Fibonacci Extension or Retracement of the Reaction Numbers. Let's pretend tehre was a Market Swing UP and had four Reaction Points. Would I take the Fibonacci Extension or Retracement FROM the Focus Number to EACH Reaction Point or would I take Fibonacci from Focus Number to Reaction 1, and then a NEW Fibonacci from Reaction 1 to 2, and then 2 to 3 and so on? Also, which way am I supposed to draw the Fibonacci when I am trying to find Confluence K? IF I do draw Fibonacci from the Focus Number to EACH Reaction Point, would I start the Fibonacci from F or would I go from Reaction 1 to F, or Reaction 2 to F, and so on?

I hope I explained my questions well enough for you to understand. I was just reading the book and I am not quite understanding which points are 0.382 or 0.618 because it does not show on the graphs. 0.382 and 0.618 could be different depending which point you started drawing your Fibonacci from.

Thanks a lot Sive!
Hi Beekay, yes, understand what you're asking about. First, Confluence area or K-area, as we call it here, appears only by Fib retracement but not extensions. Combination of any Fib level (it could be K-are as well) with extension calls Agreement.
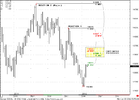
First way, as you described is correct. Focus point, i.e. most recent high in our example is called as "focus" because you have to use it as point for all reactions. Take a look at attached chart. First to levels - 0.382 at 1.3244 and 0.618 at 1.3624 we get from first reaction point - high 1.4241 and low at focus number 1.2627.
Another two levels come from Reaction Second (also it will be major one) - 0.382 at 1.3505 and 0.618 1.3624. This reaction has high at 1.4925 and low - at the same focus number 1.2627, but neither at 1.3142 low nor at 1.4241 high or any other point. Only Focus! That's why it calls like that...

Also Damian is correctly indicates levels on his picture.

BTW, may be if you take a look here, you will find some useful info:
https://www.forexpeacearmy.com/forex-forum/chapter-10/
Hope this helps. If you need more clarification - do not hesitate to ask.

sive I like your analysis very much you are a big shcool of forex teaching but it would be more helpful if we could be able to use same tools as yours
mean in mt4 we dont have Macd Predictor and moving average 3 by 3 is there any possiblity to creat or have them for mt4 and also dinapoli fibo
thc

shabbaz, leave an email address where i can contact you in my private box, here on the FPA site, and i will email you the 2 mq4 files you need to get the MACDPredictor to work properly.

as to the DMA 3x3, all you need to do is overlay on your chart a regular 3-period SMA and shift it right by 3 periods. that easy. :)

Triantus- Though I don't post very often, I am an avid, daily follower of Sive's info and appreciate all you do to promote and make this forum better. With that, if you would be kind enough to do so, please add me to your email list to receive the 2 MQ4 files for the MT4 MACD Predictor of which you spoke.

I am at: drebg@yahoo.com and may also be reached on my blog at InformedTrades.com.

Thanks so much! :)

Guys, I suppose you have to read this:
https://www.forexpeacearmy.com/forex-forum/sive-morten-analysis/13888-dinapoli-book-indicators-mt3-mt4-mt5.html

I just want to warn you, that those MACDP, that Triantus offers could be wrong, since there are some nuances exist with it's programming. Hence, you may not get signals when they exist or get there, where they do not...
The reason for this, as it was specified - DiNapoli has not programmed MACDP for MT 4 and didn't give any approvement of those that were programmed by someone...
So that risk is up to you - use it or not.
Speaking about 3x3 DMA- Triantus is right, MT 4 has this possibility to shift SMA.
 
Last edited:
View attachment 4722
Hi Beekay, yes, understand what you're asking about. First, Confluence area or K-area, as we call it here, appears only by Fib retracement but not extensions. Combination of any Fib level (it could be K-are as well) with extension calls Agreement.
First way, as you described is correct. Focus point, i.e. most recent high in our example is called as "focus" because you have to use it as point for all reactions. Take a look at attached chart. First to levels - 0.382 at 1.3244 and 0.618 at 1.3624 we get from first reaction point - high 1.4241 and low at focus number 1.2627.
Another two levels come from Reaction Second (also it will be major one) - 0.382 at 1.3505 and 0.618 1.3624. This reaction has high at 1.4925 and low - at the same focus number 1.2627, but neither at 1.3142 low nor at 1.4241 high or any other point. Only Focus! That's why it calls like that...

Also Damian is correctly indicates levels on his picture.

BTW, may be if you take a look here, you will find some useful info:
Chapter 10
Hope this helps. If you need more clarification - do not hesitate to ask.

Thanks a lot, Sive. You have made things a lot clearer to me. I cannot explain how grateful I am that you actually provide answers to all my questions. Many thanks!

In your weekly update, you stated that "since this is first pullback after solid move down – it can’t last forever, even more - it should turn to deep retracement – 0.618 at minimum, now this is 1.2860."

However, I see our NEAREST K-Area is on H4 @ 1.3000 - 1.3012. IF the scenario you stated were to happen, I just want to know from your experience how would market react at the K-Area since you anticipate market to fall to lower than K-Area? Would market pullback a bit and maybe consolidate for a day and then fall down? How does K-Area usually react when a bearish pattern or bullish pattern tells us that it could go FARTHER than K-Area?

In DiNapoli book, it stated that the 61.8 and 38.2 that makes up the K-Area should be relatively "close." I just want to know if you allow a bigger gap in higher timeframes? Let's say you allow a 20 pip gap between 61.8 and 38.2 on 1 hr TF. Would you also use the same 20 pip for a weekly or daily TF?

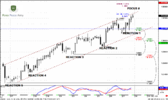
Lastly, in your 4HR chart, it seems like you only took Fibonacci from Reaction 3, 2, and 1. Why did you exclude Reaction Points 5 and 4? Were they cancelled because market broke through those levels? Attached is your 4HR chart but I labelled it for easier understanding.

fib.PNG

Thanks a lot, Sive! Take care!
 
Back
Top