- Forex, Gold, BTC Market Analysis | Trading Signals
- Sive Morten- Currencies, Gold, Bitcoin Daily Video
You are using an out of date browser. It may not display this or other websites correctly.
You should upgrade or use an alternative browser.
You should upgrade or use an alternative browser.
FOREX PRO Weekly February 06-10, 2012
- Thread starter Sive Morten
- Start date
Gert v Bruggen
Private, 1st Class
- Messages
- 47

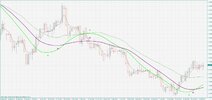
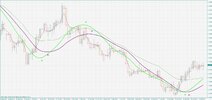
as u can see in the last picture both the limegreen and purple are moving up but stil it is not good because purple has to be outsite the limegreen and moving up before the red vertical line so we go 1 speed faster that would be the 0.764 look at the last picture

now everything looks oke purple at the outsite both moving up before the Red line
so now we wait till the market comes back down and touch the Purple line and at that point we go long
but this only works if the high of the current pullback holds if not i have correct the speed and reanalyze the crossings
but as u could see in the first picture Dubble moves this kind of setups happen at different timeframes/speed
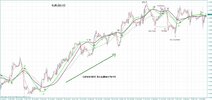
so i did also find a setup based on EU M30 startinf from the low if the Pullback at 1/13 till current high of the pullback
and that setup did give us already 1 sucsesfull short past the low of the first pullback look picture

now as u can see the risk reward is very good small stop nice profit
the second pullback did give us also a trigger for short again, and the market is still somewhere arround that trigger price
with good money managment u can almost cancel your risk
as a example if u calc the size of your order based on the stop and the trigger lets say it is 0.3 lots using 3% risk
then u place 3 identical orders of 0.1 lots at the trigger with all 3 a stop at the same stop of the picture above
then for 1 order u place a exit at the low of the first pullback
for the second order a exit a way lower maybe i fib level or some support resistance and for the last order u dont place a exit
then when the first target is hit u place from the 2 remaining orders
the order with the next exit the stop at break even and the last order the stop stays at the same place
now when the market goes against u the second order wil be hit at break even but u did already make profit from the first order and because whe have a good risk reward ratio the first order did give u a profit already more then 1%
so the second order is closed at break even and the last order is stil open if now the market would hit the Stop u would loose 1% of the last order but we did make more then 1 % profit of the first order so we stil have a little bit profit
but mostly when we find our trigger point the market wil reverse and almost always hit the second target
if the second target is hit then u move the stop of the last order to the low if the first pullback and just let it run til we find a new setup who gives us a Long trigger.
as u all can see we use moving average on a compleetly different way then others do so in that way this system is unique.
this is a very rougly explenation about how STAR works i cant go in to more detail because it is not my system, so for people who are interested in this system they have to buy it and learn it from the Master.
good hunting
dale johnson
Recruit
- Messages
- 7
Sive thank you for being a good and willing teacher! can you tell me what the formula is for a 3x3DMA is also what is a DRPO sell signal and k-Resistance
Synchronicity
Sergeant
- Messages
- 182
Sive thank you for being a good and willing teacher! can you tell me what the formula is for a 3x3DMA is also what is a DRPO sell signal and k-Resistance
Hi Dale
There is a glossary of terms here https://www.forexpeacearmy.com/forex-forum/sive-morten-analysis/10877-glossary.html
All the best...
Triantus Shango
Sergeant Major
- Messages
- 1,371
Sive thank you for being a good and willing teacher! can you tell me what the formula is for a 3x3DMA is also what is a DRPO sell signal and k-Resistance
dale, just overlay a SMA shifted by 3 periods to get the 3x3 DMA.
DRPO and k-resistance are all explained both in the school material on this site, and joe dinapoli's book: 'trading with dinapoli levels', which you can find for free as a pdf somewhere online. google is your friend.
Sive Morten
Special Consultant to the FPA
- Messages
- 18,648
Thank you Sive
I have a question: what price (open/close/other) do you use for 3x3 DMA?
P.S. based on COT data (EUR long, USD indx short) I am pretty sure we will see a 1.4 in few months
Hi Romas,
I use close price for all indicators - 3x3 DMA, MACDP, Oscillator and others.
MidnightRun
Sergeant
- Messages
- 186
Gert,
Thanks for your posts. I have a couple of remarks though. You see, this is not a signal service and your posts without specifying the parameters of the method (i.e. are those lines in your charts moving averages? What moving averages? What are trading setups and what triggers your trades? What makes you to conclude that the price action is likely to be north or south etc.) is somewhat out of place here I think.
Thanks again.
RahmanSL
Major
- Messages
- 2,934
"Weekly time frame is most important in current days, since it has context for directional pattern with excellent trading potential."
Hi Triantus, just a reminder to keep an eye or two on that W1 chart;yah!..shot bar means "up"...longer bar means "down"....but I don't know when that will take place though!
Hi Triantus, just a reminder to keep an eye or two on that W1 chart;yah!..shot bar means "up"...longer bar means "down"....but I don't know when that will take place though!
ochills
Master Sergeant
- Messages
- 278
hi Sive thanks for ur immeasurable analysis.
I say thanks Commander.
Pls I have the following questions
1.In this week analysis pls I cant find the 1.3296 resistance which u said is from the thrust down bars on monthly chart.
2.pls kindly explain the formation of BB anm confusing it with Double Repo.
3.What is K resistace I guess is the coincidence of fib retracment of 0.382&0.618 on the same up or down swing.If am wrog kindly correct me.
4. In Ur Fx military course u said "MACDP show precise price level when the trend will change & it does it in one period ahead of time" my question is how can one determine at what price level wil the trend change using MACDP.
Thanks as usual.
Similar threads
- Replies
- 5
- Views
- 211
- Replies
- 8
- Views
- 208
- Replies
- 11
- Views
- 271
- Replies
- 7
- Views
- 234
- Forex, Gold, BTC Market Analysis | Trading Signals
- Sive Morten- Currencies, Gold, Bitcoin Daily Video