Sive Morten
Special Consultant to the FPA
- Messages
- 18,664
Monthly
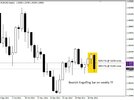
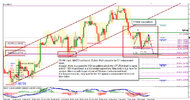
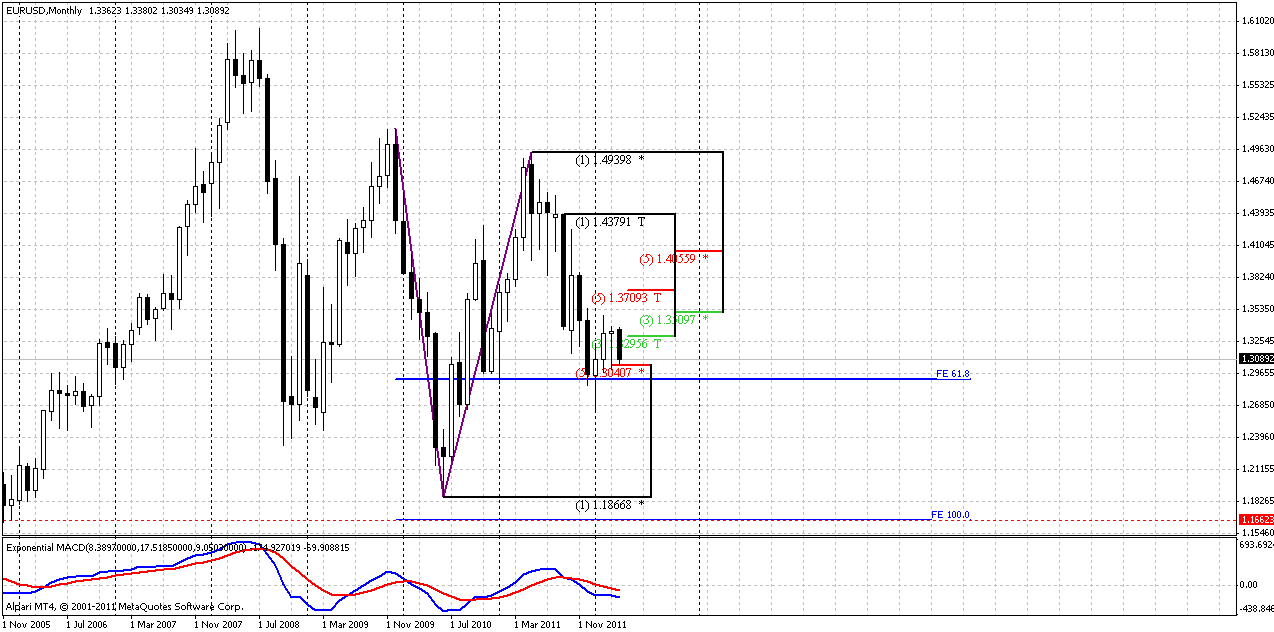
Situation is changing rapidly, even on monthly chart. Just on previous week we’ve seen third upward bar in a row, but now we see that white has turned to black, and April price action shows downward move. Obviously that monthly time frame does not sense much this move, because it rather long-term. That’s why we still have no reasons to change our medium-term view of possible reaching 1.35-1.37 K-resistance area. Since 1.35 was tested once already, it is possible that market will try to pass a bit further inside of Confluence area.
The rest of analysis is the same – our focus is K-level as holding barrier. We can accept reaching of 1.37 from long-term bearish view (1.16), but we anyhow can’t justify move through it.
The major interest here, as previously, stands with price behavior around Agreement support from one side and K-resistance area from the other. After hitting of 0.618 Fib extension target and Agreement market has shown retracement to 1.3509-1.3709 that is solid K-resistance at monthly chart and typically, price should not break it after just hitting of 0.618 target. Otherwise, it will be a strong sign that market sentiment has changed and bears’ power falls under question
Still, as we’ve mentioned previously there is a possibility of AB=CD retracement on lower time frames. In this case market could show a bit deeper move inside of K-resistance. Although this is not significant for monthly time frame, it could become very important for us, since we mostly trade at daily charts.
Weekly
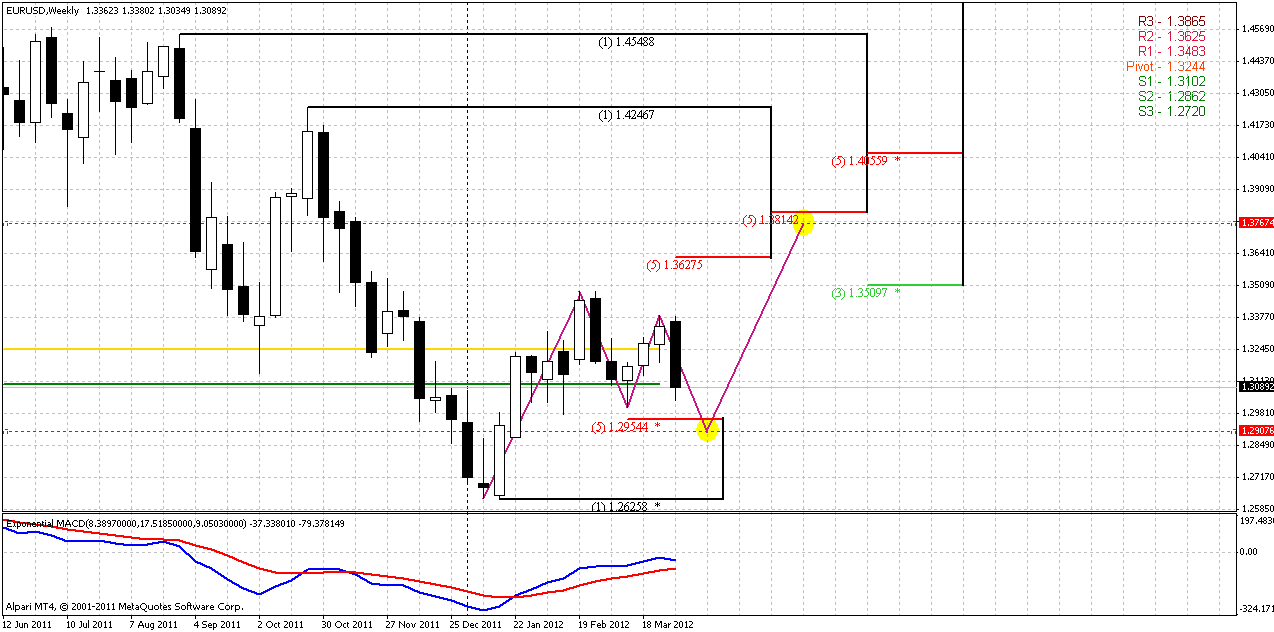
This part of research I would like to start with our risk note that we’ve made on previous week:
“Major risk is compounding of AB=CD pattern. Since price has not moved above B point (1.35) yet, BC leg could shift to smaller ab=cd downward pattern with deeper retracement.”
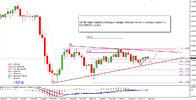
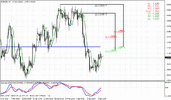
Now we see that this move has started. Still trend holds bullish on weekly time frame and cover this retracement. At least at current time we might say, that this started move was not able to vanish our greater AB=CD expectation yet. This will just shift to AB-ab=cd-CD price action that I’ve marked on the chart. The worry sign will appear, if market will move below 1.29 level and shift weekly trend to bearish, but today we will not talk about it. What to do on coming week is more important question for us now. Here we see, that to expect move to 1.29-1.2950 area makes sense and seems logical in current environment. On weekly time frame market stands at support – 0.618 smaller ab=cd target and pivot support 1 at 1.3102.
Daily
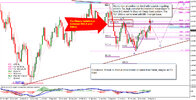
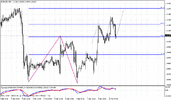
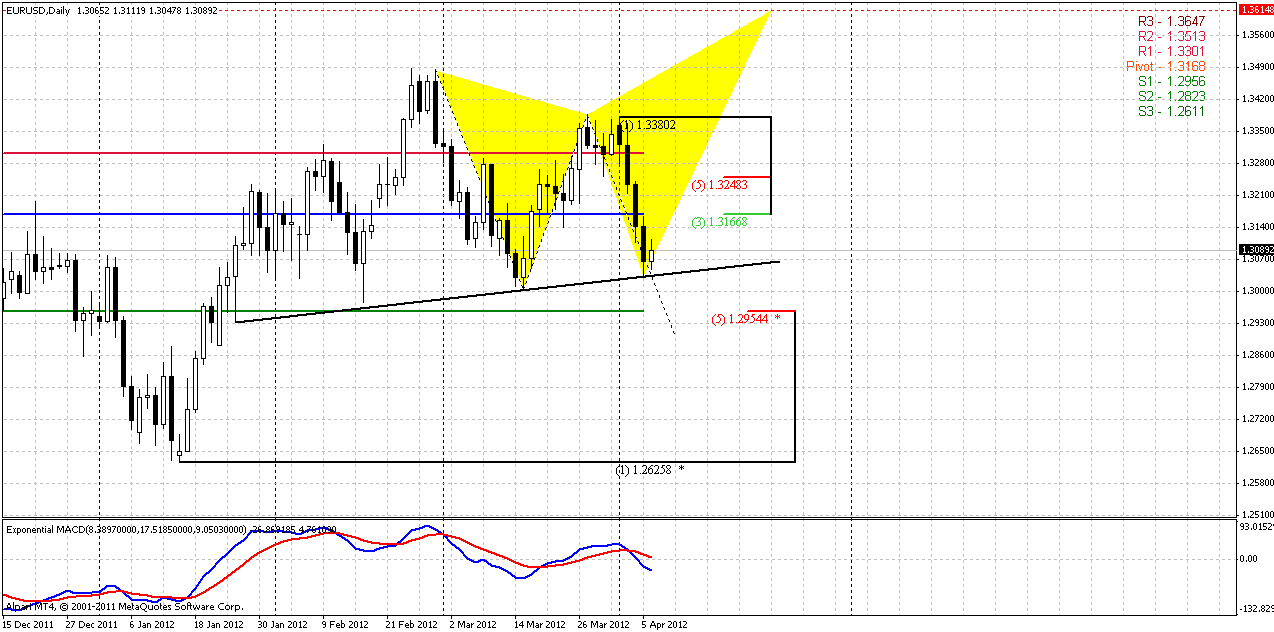
As we’ve said above – market stands at support of MPS1, 0.618 extension target of AB=CD pattern and also here we see trend line support and minor 0.88 Fib support. Trend holds bearish well, market is not at oversold. We do not have any directional patterns here, except of potential Butterfly “Sell”, but this is just a hint yet. So, we have not bad background for upward retracement. It’s starting probably will be common as for potential butterfly as in case of downward continuation. So, what’s the different though? The difference, probably will be in depth. If this will be Butterfly market should continue its upward move and erase all resistances on the way. If it will be continuation, then retracement has great chances to stop around 1.3165 – 3/8 nearest Fib resistance and WPP for coming week. Market moves down fast, has not achieved any strong supports and CD leg a bit faster than AB, so assume small retracement is reasonable.
Besides, if market will move above WPP it will change as daily trend as daily sentiment and we will loss our bearish context then.
So, our first conclusion here is that despite what pattern will prevail, market probably will show some retracement. The real task to do is to understand around 1.3165 – will market turn down or not. This is a bit advanced approach. Simple approach is to enter short and place stop above 1.3250 – next fib level and MACD trend breakeven level. Other words – close position, if price will shift daily sentiment - trend to bullish, move above Pivot and next Fib resistance. Finally, pay attention that our AB=CD destination at 1.29-1.2950 also contains a Weekly Pivot support 1 – 1.2956
4-hour
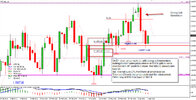
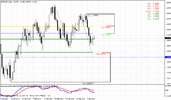
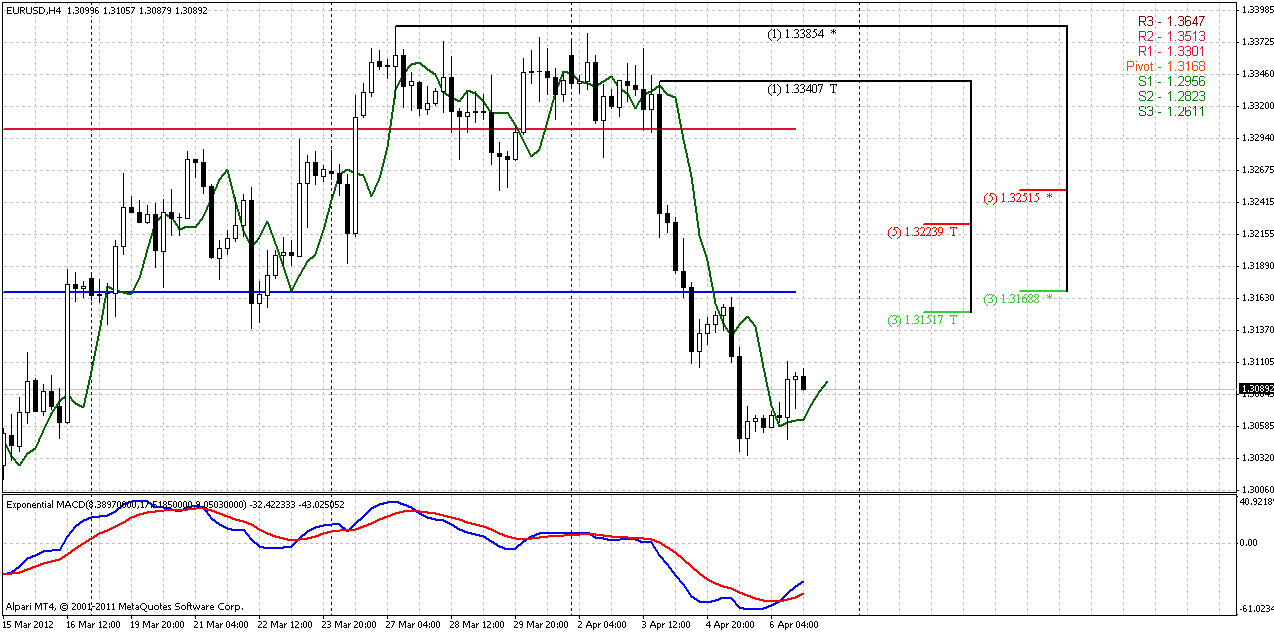
Here we see some hints on potential retracement. Trend has turned bullish. Among other questions we have one concerning about DRPO “Buy” pattern – do we have it here or not? If to not dive into details, this is probably potential of DRPO LAL (Look alike) at best. Market has not reached 0.382 resistance during penetration of 3x3 around 1.3165, but thrust is also not perfect and number of bars at minimum required. So, it might turn to DRPO Buy pattern, but better treat it as LAL. So this chart gives us a lot of objects to behold – DRPO “Buy”, possibly market could show butterfly “Buy” that very often appears with DRPO patterns on 5-15 min charts. Then we have to look of 1.3165 level, particular on lower time frame to understand – will market reverse down here or not. If we will get Sell patterns there – we may try to short the market aiming on continuation of daily AB=CD pattern. If market will pass it through, it will force as to adjust our view according with possibility of Butterfly “Sell” appearance on daily chart. So a lot of work to do…
Conclusion:
Long-term traders should sit on hands and wait when weekly AB=CD retracement will be over to enter short, or at least market will shift trend to bearish on weekly.
While weekly context is bullish, market has turned to compounding AB=CD patterns, that has led to bearish bias on daily time frame.
Market has reached support area and should turn to upward retracement. In general, on daily there are just two possibilities, or we can call it patterns – continuation of AB=CD and Butterfly “Sell”. Any move above WPP and 1.3165 will skew odds in favor of butterfly, because it will be unwelcome for downward continuation, it does not suggest deep retracement.
The technical portion of Sive's analysis owes a great deal to Joe DiNapoli's methods, and uses a number of Joe's proprietary indicators. Please note that Sive's analysis is his own view of the market and is not endorsed by Joe DiNapoli or any related companies.
Situation is changing rapidly, even on monthly chart. Just on previous week we’ve seen third upward bar in a row, but now we see that white has turned to black, and April price action shows downward move. Obviously that monthly time frame does not sense much this move, because it rather long-term. That’s why we still have no reasons to change our medium-term view of possible reaching 1.35-1.37 K-resistance area. Since 1.35 was tested once already, it is possible that market will try to pass a bit further inside of Confluence area.
The rest of analysis is the same – our focus is K-level as holding barrier. We can accept reaching of 1.37 from long-term bearish view (1.16), but we anyhow can’t justify move through it.
The major interest here, as previously, stands with price behavior around Agreement support from one side and K-resistance area from the other. After hitting of 0.618 Fib extension target and Agreement market has shown retracement to 1.3509-1.3709 that is solid K-resistance at monthly chart and typically, price should not break it after just hitting of 0.618 target. Otherwise, it will be a strong sign that market sentiment has changed and bears’ power falls under question
Still, as we’ve mentioned previously there is a possibility of AB=CD retracement on lower time frames. In this case market could show a bit deeper move inside of K-resistance. Although this is not significant for monthly time frame, it could become very important for us, since we mostly trade at daily charts.

Weekly
This part of research I would like to start with our risk note that we’ve made on previous week:
“Major risk is compounding of AB=CD pattern. Since price has not moved above B point (1.35) yet, BC leg could shift to smaller ab=cd downward pattern with deeper retracement.”
Now we see that this move has started. Still trend holds bullish on weekly time frame and cover this retracement. At least at current time we might say, that this started move was not able to vanish our greater AB=CD expectation yet. This will just shift to AB-ab=cd-CD price action that I’ve marked on the chart. The worry sign will appear, if market will move below 1.29 level and shift weekly trend to bearish, but today we will not talk about it. What to do on coming week is more important question for us now. Here we see, that to expect move to 1.29-1.2950 area makes sense and seems logical in current environment. On weekly time frame market stands at support – 0.618 smaller ab=cd target and pivot support 1 at 1.3102.

Daily
As we’ve said above – market stands at support of MPS1, 0.618 extension target of AB=CD pattern and also here we see trend line support and minor 0.88 Fib support. Trend holds bearish well, market is not at oversold. We do not have any directional patterns here, except of potential Butterfly “Sell”, but this is just a hint yet. So, we have not bad background for upward retracement. It’s starting probably will be common as for potential butterfly as in case of downward continuation. So, what’s the different though? The difference, probably will be in depth. If this will be Butterfly market should continue its upward move and erase all resistances on the way. If it will be continuation, then retracement has great chances to stop around 1.3165 – 3/8 nearest Fib resistance and WPP for coming week. Market moves down fast, has not achieved any strong supports and CD leg a bit faster than AB, so assume small retracement is reasonable.
Besides, if market will move above WPP it will change as daily trend as daily sentiment and we will loss our bearish context then.
So, our first conclusion here is that despite what pattern will prevail, market probably will show some retracement. The real task to do is to understand around 1.3165 – will market turn down or not. This is a bit advanced approach. Simple approach is to enter short and place stop above 1.3250 – next fib level and MACD trend breakeven level. Other words – close position, if price will shift daily sentiment - trend to bullish, move above Pivot and next Fib resistance. Finally, pay attention that our AB=CD destination at 1.29-1.2950 also contains a Weekly Pivot support 1 – 1.2956

4-hour
Here we see some hints on potential retracement. Trend has turned bullish. Among other questions we have one concerning about DRPO “Buy” pattern – do we have it here or not? If to not dive into details, this is probably potential of DRPO LAL (Look alike) at best. Market has not reached 0.382 resistance during penetration of 3x3 around 1.3165, but thrust is also not perfect and number of bars at minimum required. So, it might turn to DRPO Buy pattern, but better treat it as LAL. So this chart gives us a lot of objects to behold – DRPO “Buy”, possibly market could show butterfly “Buy” that very often appears with DRPO patterns on 5-15 min charts. Then we have to look of 1.3165 level, particular on lower time frame to understand – will market reverse down here or not. If we will get Sell patterns there – we may try to short the market aiming on continuation of daily AB=CD pattern. If market will pass it through, it will force as to adjust our view according with possibility of Butterfly “Sell” appearance on daily chart. So a lot of work to do…

Conclusion:
Long-term traders should sit on hands and wait when weekly AB=CD retracement will be over to enter short, or at least market will shift trend to bearish on weekly.
While weekly context is bullish, market has turned to compounding AB=CD patterns, that has led to bearish bias on daily time frame.
Market has reached support area and should turn to upward retracement. In general, on daily there are just two possibilities, or we can call it patterns – continuation of AB=CD and Butterfly “Sell”. Any move above WPP and 1.3165 will skew odds in favor of butterfly, because it will be unwelcome for downward continuation, it does not suggest deep retracement.
The technical portion of Sive's analysis owes a great deal to Joe DiNapoli's methods, and uses a number of Joe's proprietary indicators. Please note that Sive's analysis is his own view of the market and is not endorsed by Joe DiNapoli or any related companies.
