Sive Morten
Special Consultant to the FPA
- Messages
- 18,644
Monthly
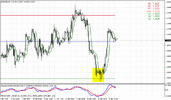
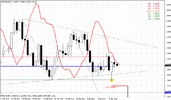
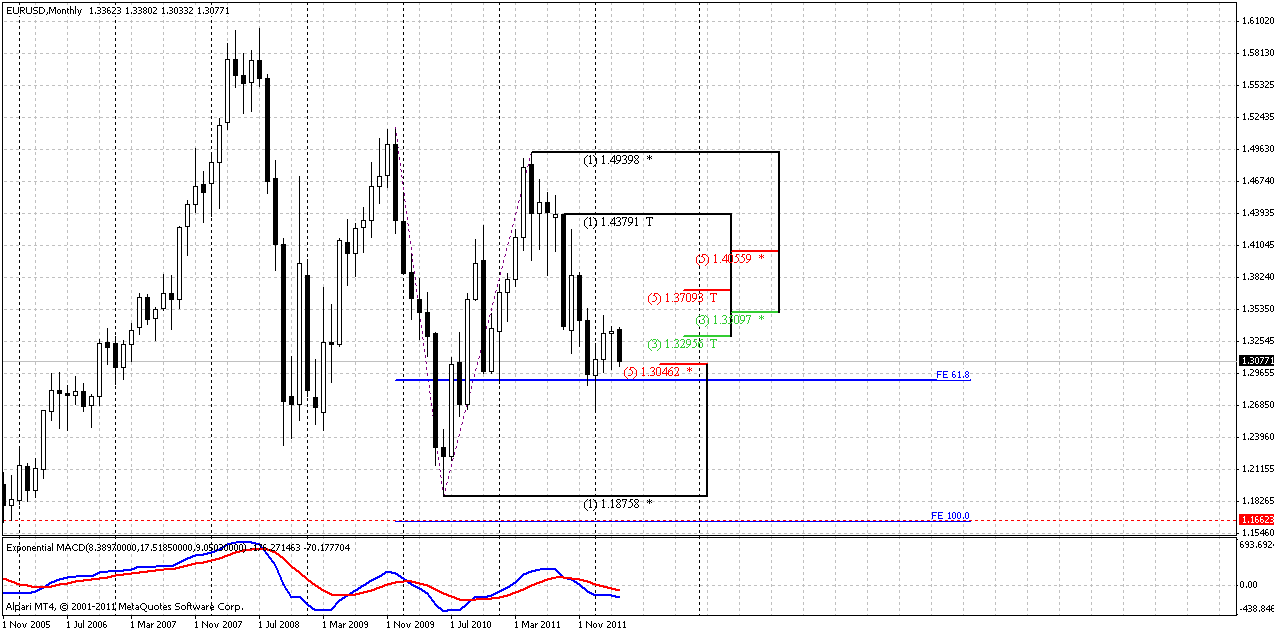
On monthly chart we see almost the same picture as on previous week – just 10 pips difference. So, we have nothing to add here.
April price action shows downward move. Still, for monthly time frame this is not significant move and, as we’ve said previously it is still possible for price to reach 1.35-1.37 K-resistance area.
The rest of analysis is the same – our focus is K-level as holding barrier. We can accept reaching of 1.37 from long-term bearish view (1.16), but we anyhow can’t justify move through it.
The major interest here, as previously, stands with price behavior around Agreement support from one side and K-resistance area from the other. After hitting of 0.618 Fib extension target and Agreement market has shown retracement to 1.3509-1.3709 that is solid K-resistance at monthly chart and typically, price should not break it after just hitting of 0.618 target. Otherwise, it will be a strong sign that market sentiment has changed and bears’ power falls under question
Still, as we’ve mentioned previously there is a possibility of AB=CD retracement on lower time frames. In this case market could show a bit deeper move inside of K-resistance. Although this is not significant for monthly time frame, it could become very important for us, since we mostly trade at daily charts.
Weekly
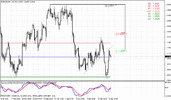
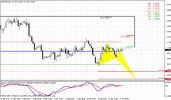
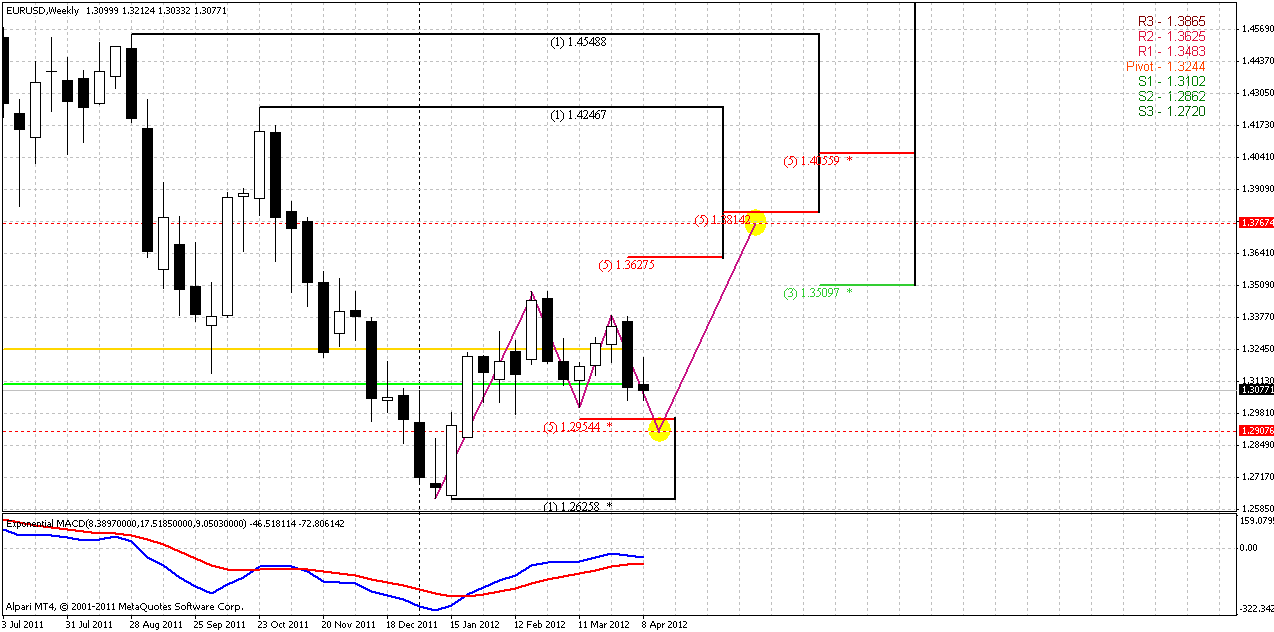
Market is continuing with downward smaller ab=cd pattern. Price has closed below monthly pivot support 1. Trend still holds bullish and will remain bullish, even if market will reach predefined this ab=cd pattern at 1.29-1.2950 area. That’s why we do not deny possibility of greater upward AB=CD to 1.37-1.38 area yet.
According to current picture we probably should be focused on downward continuation on coming week - continuation to 1.29-1.2950 area makes sense and seems logical in current environment.
Daily
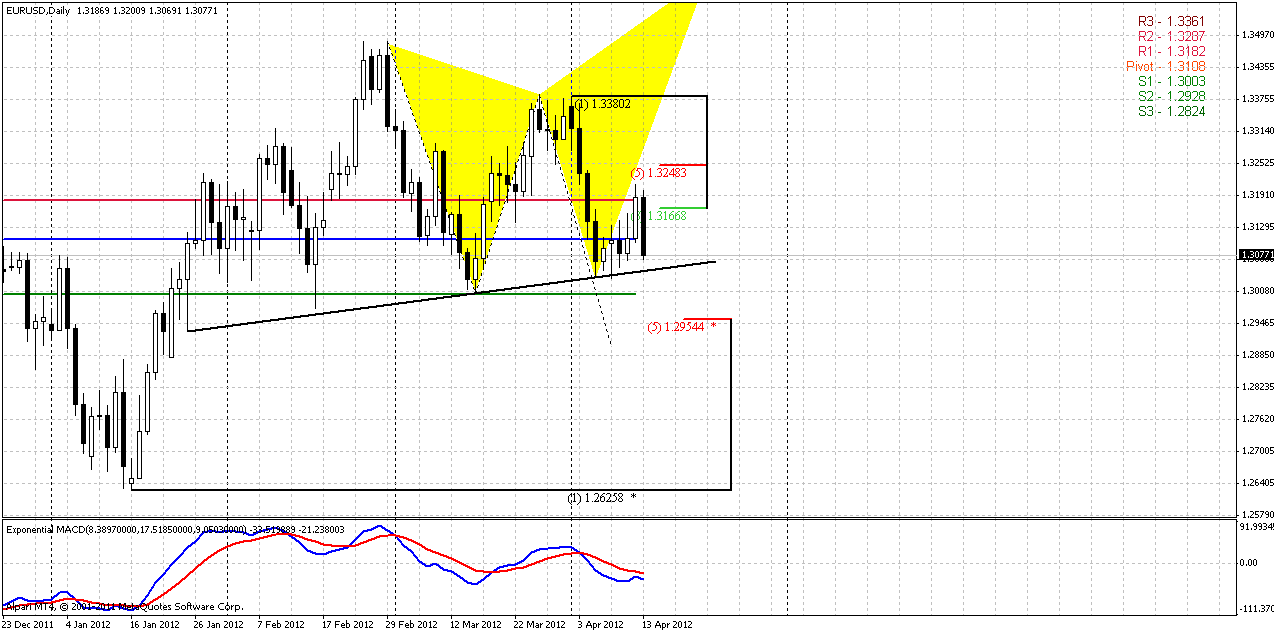
Although on Friday morning market has moved above pivot point and hourly K-resistance we have said that failure breakout is possible. To be honest I was surprised a bit by such price action. Although we have theoretical context for butterfly, my mind can’t agree with the possibility of upward move right till the last moment, when even breakout has happened. Mostly because current swing down has fundamental foundation – US economy looks more preferable than EU and after comments of denying third stage of QE gives market more confidence in dollar strength. That’s why butterfly possibility looks as phantom (menace for bears). Today we see that probably this is true.
Recall that our primary condition was move below 1.3150 level – inside of bearish flag and shifting intraday trends to bearish. That has happened. Although market has not broken through 1.30 butterfly’s low and has not erased it but probability of this evermore significant. Also we have to be prepared to possible downward continuation through 1.29 level, because classical way of target estimation based on flag’s mast and it stands around 1.27. All right, anyway on coming week we should be focused on downward move and search possibility to enter short.
4-hour
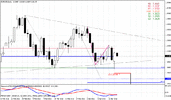
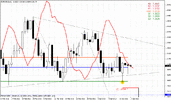
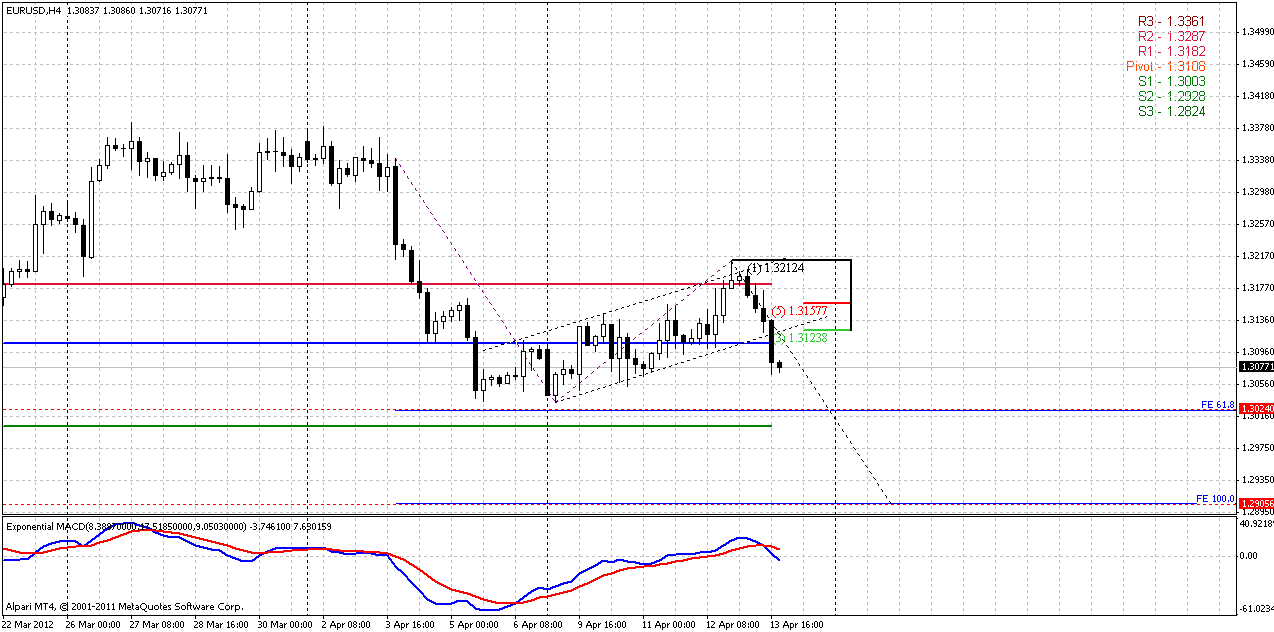
Sorry for a bit heavy chart and overload with trend lines. Most important thing here is the trend – it has turned bearish. That is what we’ve wanted to see. Also we see failure breakout flag and true downward breakout. Jack Schwager calls it as “Bullish trap”. Also we have here downward AB=CD pattern with the same target at 1.29. Pay attention that 1.3025 0.618 target stands below previous lows, so they will hardly hold and some acceleration after breakout is possible. Probably we can use this recent swing down to search level where to enter short.
30-min
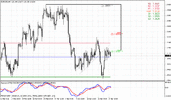
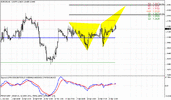
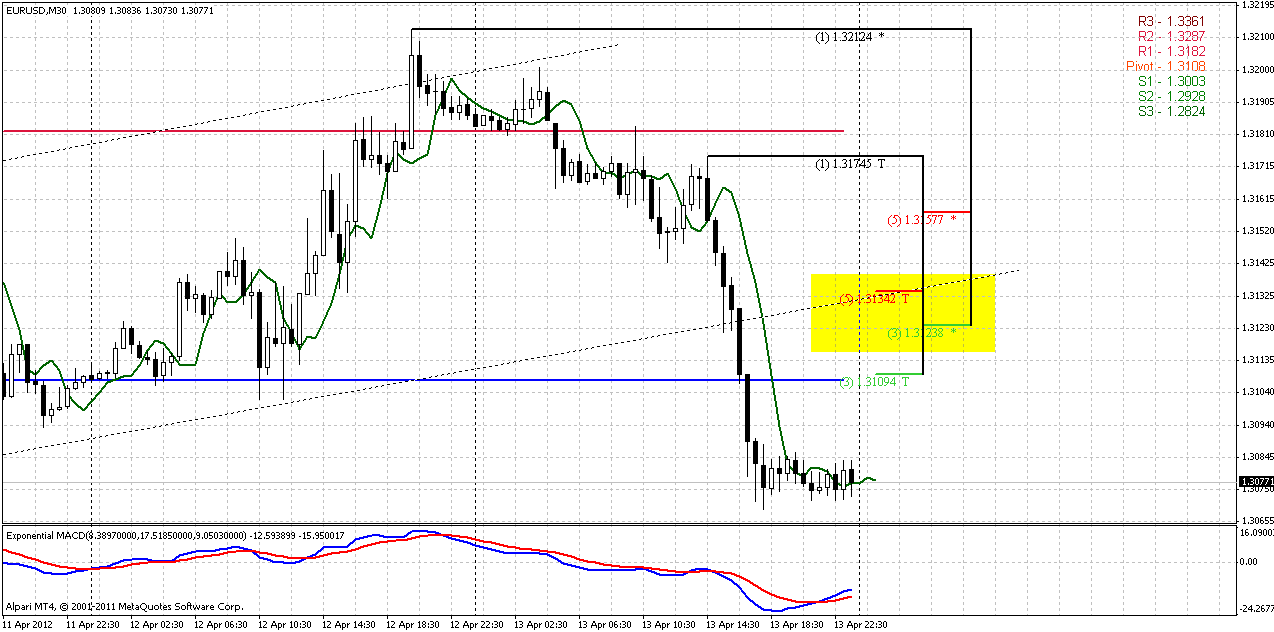
Today we will take look at 30-min chart instead of hourly. By the way on hourly time frame trend holds bearish. Here we see two levels to watch for – first one is 1.31 – nearest 3/8 resistance and WPP, second is 1.3124-1.3134 K-resistance and lower border of broken flag. Retracement really could happen on Monday by confirmed DRPO “Buy” pattern.
Since all trends hold bearish, market is not at support and overbought, probably will be better to apply gradual enter. For example - 1/3 at 1.31 and 2/3 at K-area. Stop could be placed, probably, above WPR1 at 1.3108.
Conclusion:
Long-term traders should sit on hands and wait when weekly AB=CD retracement will be over to enter short, or at least market will shift trend to bearish on weekly.
While weekly context is bullish, market has turned to compounding AB=CD patterns, that has led to bearish bias on daily time frame.
Finally on daily time frame more or less clarification has come. At least now we should focus on downward continuation that probably will start either from 1.31 or 1.3124-1.3134 level.
The technical portion of Sive's analysis owes a great deal to Joe DiNapoli's methods, and uses a number of Joe's proprietary indicators. Please note that Sive's analysis is his own view of the market and is not endorsed by Joe DiNapoli or any related companies.
On monthly chart we see almost the same picture as on previous week – just 10 pips difference. So, we have nothing to add here.
April price action shows downward move. Still, for monthly time frame this is not significant move and, as we’ve said previously it is still possible for price to reach 1.35-1.37 K-resistance area.
The rest of analysis is the same – our focus is K-level as holding barrier. We can accept reaching of 1.37 from long-term bearish view (1.16), but we anyhow can’t justify move through it.
The major interest here, as previously, stands with price behavior around Agreement support from one side and K-resistance area from the other. After hitting of 0.618 Fib extension target and Agreement market has shown retracement to 1.3509-1.3709 that is solid K-resistance at monthly chart and typically, price should not break it after just hitting of 0.618 target. Otherwise, it will be a strong sign that market sentiment has changed and bears’ power falls under question
Still, as we’ve mentioned previously there is a possibility of AB=CD retracement on lower time frames. In this case market could show a bit deeper move inside of K-resistance. Although this is not significant for monthly time frame, it could become very important for us, since we mostly trade at daily charts.

Weekly
Market is continuing with downward smaller ab=cd pattern. Price has closed below monthly pivot support 1. Trend still holds bullish and will remain bullish, even if market will reach predefined this ab=cd pattern at 1.29-1.2950 area. That’s why we do not deny possibility of greater upward AB=CD to 1.37-1.38 area yet.
According to current picture we probably should be focused on downward continuation on coming week - continuation to 1.29-1.2950 area makes sense and seems logical in current environment.

Daily
Although on Friday morning market has moved above pivot point and hourly K-resistance we have said that failure breakout is possible. To be honest I was surprised a bit by such price action. Although we have theoretical context for butterfly, my mind can’t agree with the possibility of upward move right till the last moment, when even breakout has happened. Mostly because current swing down has fundamental foundation – US economy looks more preferable than EU and after comments of denying third stage of QE gives market more confidence in dollar strength. That’s why butterfly possibility looks as phantom (menace for bears). Today we see that probably this is true.
Recall that our primary condition was move below 1.3150 level – inside of bearish flag and shifting intraday trends to bearish. That has happened. Although market has not broken through 1.30 butterfly’s low and has not erased it but probability of this evermore significant. Also we have to be prepared to possible downward continuation through 1.29 level, because classical way of target estimation based on flag’s mast and it stands around 1.27. All right, anyway on coming week we should be focused on downward move and search possibility to enter short.

4-hour
Sorry for a bit heavy chart and overload with trend lines. Most important thing here is the trend – it has turned bearish. That is what we’ve wanted to see. Also we see failure breakout flag and true downward breakout. Jack Schwager calls it as “Bullish trap”. Also we have here downward AB=CD pattern with the same target at 1.29. Pay attention that 1.3025 0.618 target stands below previous lows, so they will hardly hold and some acceleration after breakout is possible. Probably we can use this recent swing down to search level where to enter short.

30-min
Today we will take look at 30-min chart instead of hourly. By the way on hourly time frame trend holds bearish. Here we see two levels to watch for – first one is 1.31 – nearest 3/8 resistance and WPP, second is 1.3124-1.3134 K-resistance and lower border of broken flag. Retracement really could happen on Monday by confirmed DRPO “Buy” pattern.
Since all trends hold bearish, market is not at support and overbought, probably will be better to apply gradual enter. For example - 1/3 at 1.31 and 2/3 at K-area. Stop could be placed, probably, above WPR1 at 1.3108.

Conclusion:
Long-term traders should sit on hands and wait when weekly AB=CD retracement will be over to enter short, or at least market will shift trend to bearish on weekly.
While weekly context is bullish, market has turned to compounding AB=CD patterns, that has led to bearish bias on daily time frame.
Finally on daily time frame more or less clarification has come. At least now we should focus on downward continuation that probably will start either from 1.31 or 1.3124-1.3134 level.
The technical portion of Sive's analysis owes a great deal to Joe DiNapoli's methods, and uses a number of Joe's proprietary indicators. Please note that Sive's analysis is his own view of the market and is not endorsed by Joe DiNapoli or any related companies.
