Sive Morten
Special Consultant to the FPA
- Messages
- 18,639
Monthly
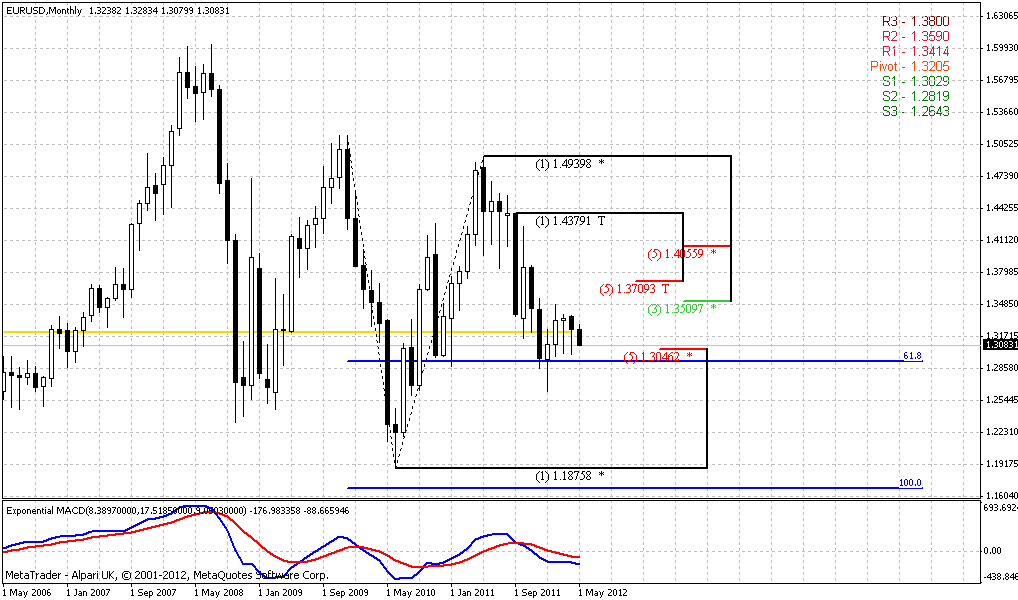
On monthly chart there is only single new detail – Monthly Pivot at 1.3205. Since market has shown downward week, our primary attention gradually shifts to weekly time frame, particularly to its trend – will market be able to hold bullish trend on weekly or not. If trend will break it probably will lead to downward continuation on monthly chart and retracement will be over. All other thoughts are still the same:
Trend holds bearish. Almost 4th month in a row market stands in consolidation after hitting of Agreement around 1.2950-1.30 area. Since Agreement is stronger area than just simple Fib level we have suggested that market could show some deeper retracement up and retest 1.37-1.38 level. Current price action on weekly chart shows that this indeed could happen. In general, we can say, that market is locked between Agreement support and Confluence resistance area.
Recall that our long term expectation is dollar appreciation to 1.16 level and move to 1.37 will be treated just as retracement in a bearish monthly trend. Overall price action looks so, that does not care any hidden hazard for bearish sentiment. Price stands in a tight range after significant thrust down. This is very common and nice situation for bears.
From bearish perspective 1.37 K-level has extreme importance as holding barrier. We can accept reaching of 1.37 from long-term bearish view, but we anyhow can’t justify move through it. If it will really happen, I mean breakout through 1.37, then it will put under question overall bearish view on long-term charts.
Weekly
By looking at weekly and daily time frames I come to conclusion that coming month will be very interesting on EUR/USD market. For discussion on weekly time frame you need weekly chart from previous analysis as well, I do not have it in current research, but it will be better if you will have it in front of you for better understanding…
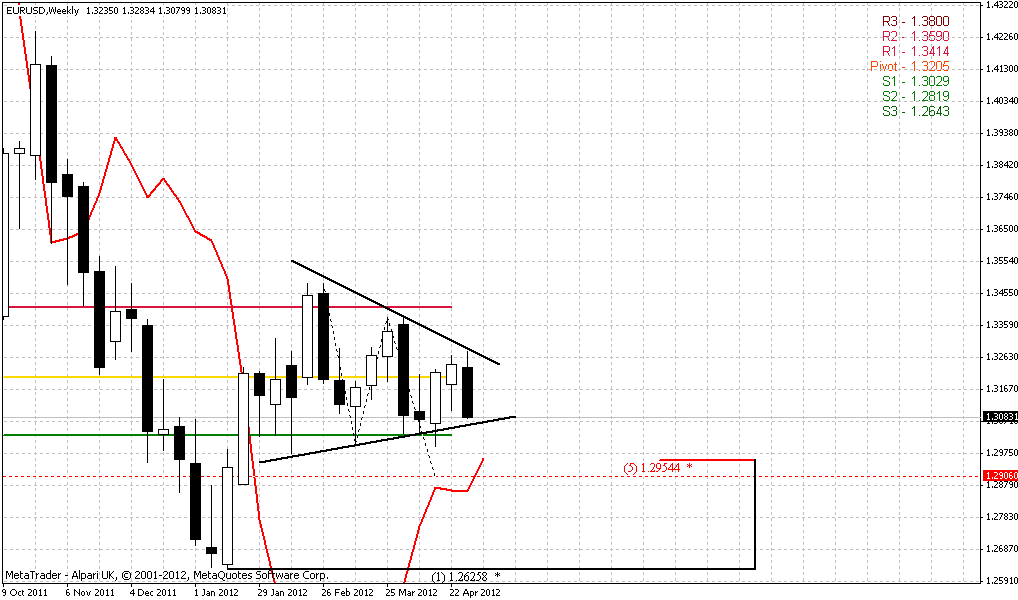
So, first – take a look at current triangle consolidation that is developing on weekly time frame. I see an interesting detail – down moves 2-3 times faster than the up moves. Recall that recent upward move on daily time frame has progressed hard and slow, while plunge was extremely fast. The same was on week before. By this moment we probably could make a conclusion that market is heavy and downward breakout becomes very probable.
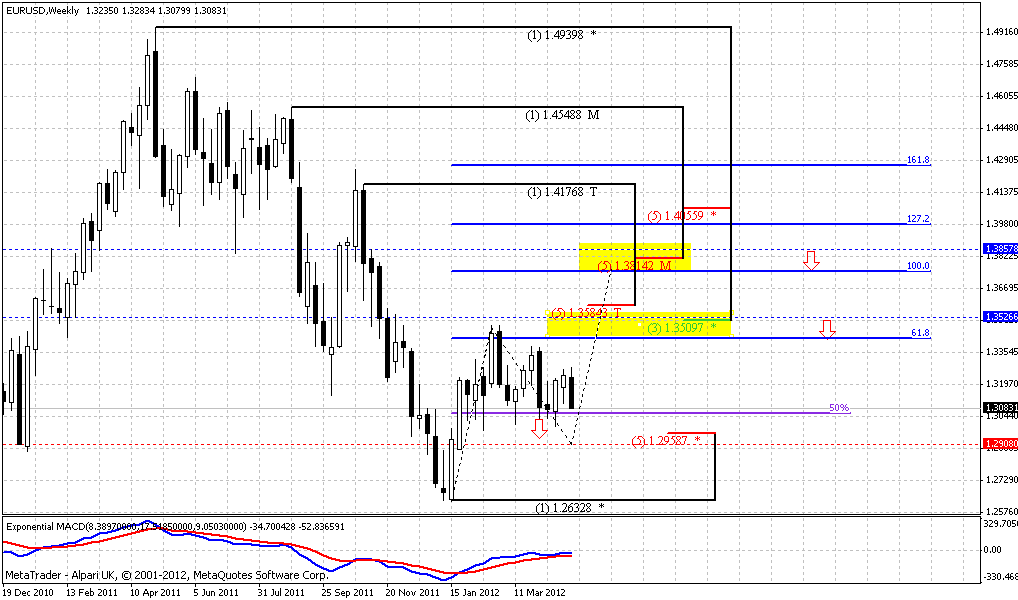
If this will indeed happen, where is the target? I see it in completion point of initial AB=CD pattern at 1.2906. This will also create an Agreement with 0.618 Fib support at 1.2954. Looks like we have to return to our initial thoughts about AB=CD weekly downward retracement regardless of whether we want it or not. This thought leads us to the objects that we will have to watch – first is support level, second is the trend. Take a look at second chart – trend will remain bullish only till 1.29 area. As we’ve said in “Monthly” part there is a lot will depend on weekly trend – will it hold or not. If it will hold, upward deeper retracement could happen – right to 1.37 level as we’ve thought initially. If trend will break on bearish side – this will probably lead to further downward move on monthly time frame.
Now take a look at first chart again and compare it with chart of previous research. It shows scenario if weekly bull trend will hold. In this case upward move will start from a bit lower level – 1.29 and targets also will drift a bit lower – I’ve marked it by red arrows. So primary target of this retracement now will stand at 1.37 level and not above 1.38 that is more suitable in terms of monthly Fib levels. But how it could happen? Let’s pass to daily analysis.
Daily
I will share with you scenario that is logical for current existing levels and overall picture. This is just an assumption and perfect model of price action that I would like to see for confirmation potential bullish move on weekly chart.
Although market will definitely behave different, nevertheless this scenario will allow us to specify crucial levels that anyway will be quite important for us and watch for them. So, let’s start with it:
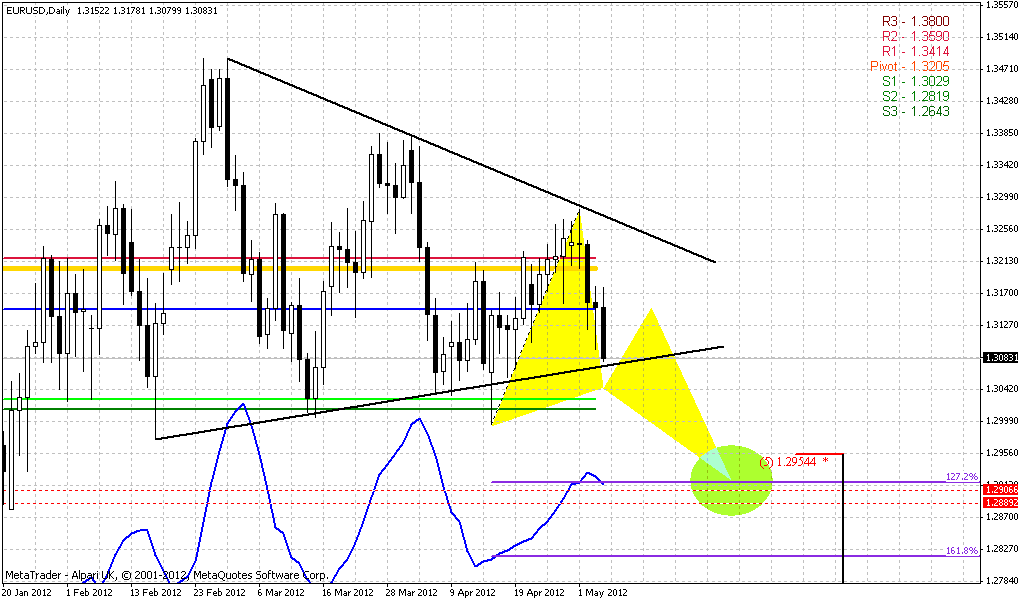
First of all, recall that I’ve talked about fast down moves and hard & heavy upward moves. Second, pay attention to colored lines. They are as usual – blue, green and red are WPP, WPS1 and WPR1 respectively, while gold and lime are MPP and MPS1. Market has already tested gold one (MPP) and moves below it, so monthly sentiment holds bearish. Right below of triangle we see solid support area by double WP Supports – 1.3020-1.3030. This level could be treated as short-term downward target and level from which some retracement could start. Most important for us in medium term is 1.29 area. This area includes: two AB=CD targets from initial and most recent patterns inside of triangle (marked by red dash lines), 5/8 major Fib support, daily oversold level (blue curve line) and 1.27 extension of previous swing high. So that are levels that we have…
Now, if you remember, our significant question on weekly time frame is bullish trend survival. That’s why I’ve drawn butterfly “Buy” picture here. This is possible. If it will be really so, or any other reversal pattern will be formed here – it could lead to bullish scenario on weekly time frame. I even will no talk about potential stop grabber on weekly, since trend will remain bullish only till 1.29 area.
If market will not create any reversal patterns and will fall like stone here, shift weekly trend to bearish, then we must be ready for long-term downward continuation on monthly chart.
4-hour
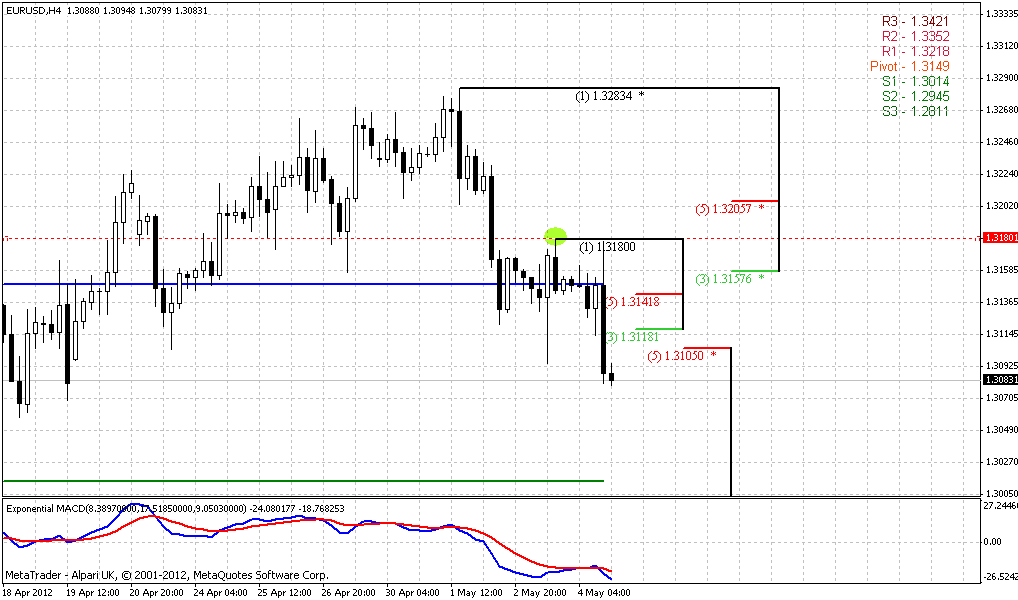
Finally time has come to speak about short-term perspectives. As on daily as on 4-hour chart trend holds bearish. Our Friday’s trading plan has worked – market has not taken out previous swing high (green circle) and K-resistance that we’ve discussed. Also it has erased hammer pattern and broken all support levels. On this chart we have significant K- resistance level 1.3142-1.3157 that also contains WPP 1.3149. Although perfection of this area is obvious, recall experience of previous week – when market has solid bearish momentum that is confirmed by both trends it could show retracement just to nearest resistance level. That’s why, probably applying of gradual enter is more acceptable here. Still, since right below market stands daily triangle lower border support, may be market will show a deeper retracement and reach WPP, how knows. Currently it is very hard to say definitely.
Hourly
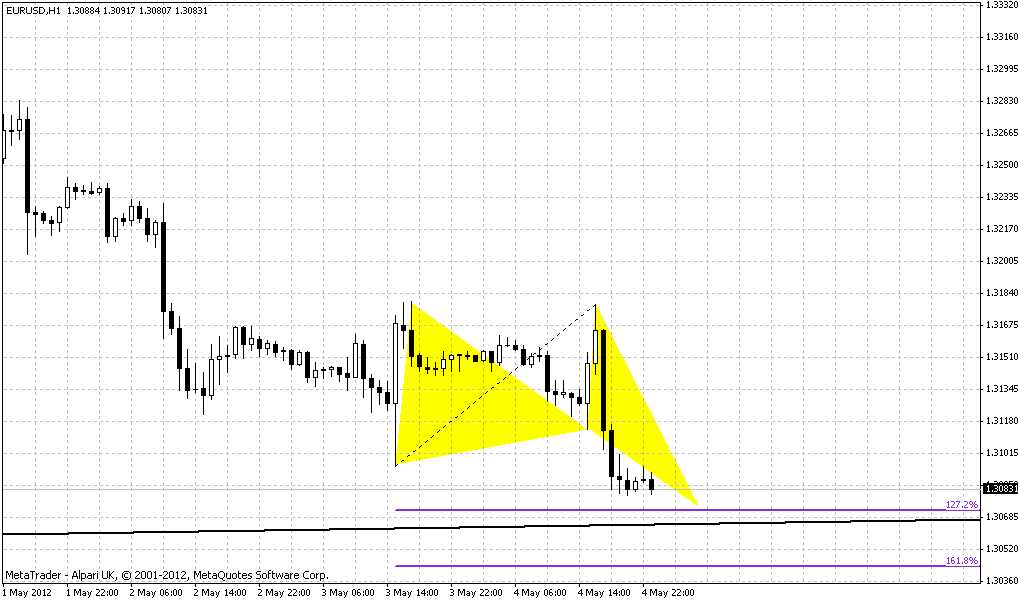
Here trend is bearish. Ugly butterfly “Buy” pattern has a reversal point right at lower border of daily triangle, so retracement is possible. This is what to watch for on Monday.
Conclusion:
Long-term traders come in final period of their expectation. If weekly trend will not hold, then they can use first rally on weekly to enter short in continuation of monthly move. If opposite will happen, then they will have to wait a bit more and probably get better entry level around 1.37.
On short-term perspective we have bearish context. On Monday market could show retracement from lower border of daily triangle that could be used for short entry. I suspect that triangle could be broken down with nearest target around 1.30 – combination of two Pivot supports – monthly and weekly.
Additional attention should be paid to price action on daily time frame in 2-3 weeks perspectives, since it will give us solid context and trading direction for a considerable time.
The technical portion of Sive's analysis owes a great deal to Joe DiNapoli's methods, and uses a number of Joe's proprietary indicators. Please note that Sive's analysis is his own view of the market and is not endorsed by Joe DiNapoli or any related companies.
On monthly chart there is only single new detail – Monthly Pivot at 1.3205. Since market has shown downward week, our primary attention gradually shifts to weekly time frame, particularly to its trend – will market be able to hold bullish trend on weekly or not. If trend will break it probably will lead to downward continuation on monthly chart and retracement will be over. All other thoughts are still the same:
Trend holds bearish. Almost 4th month in a row market stands in consolidation after hitting of Agreement around 1.2950-1.30 area. Since Agreement is stronger area than just simple Fib level we have suggested that market could show some deeper retracement up and retest 1.37-1.38 level. Current price action on weekly chart shows that this indeed could happen. In general, we can say, that market is locked between Agreement support and Confluence resistance area.
Recall that our long term expectation is dollar appreciation to 1.16 level and move to 1.37 will be treated just as retracement in a bearish monthly trend. Overall price action looks so, that does not care any hidden hazard for bearish sentiment. Price stands in a tight range after significant thrust down. This is very common and nice situation for bears.
From bearish perspective 1.37 K-level has extreme importance as holding barrier. We can accept reaching of 1.37 from long-term bearish view, but we anyhow can’t justify move through it. If it will really happen, I mean breakout through 1.37, then it will put under question overall bearish view on long-term charts.

Weekly
By looking at weekly and daily time frames I come to conclusion that coming month will be very interesting on EUR/USD market. For discussion on weekly time frame you need weekly chart from previous analysis as well, I do not have it in current research, but it will be better if you will have it in front of you for better understanding…
So, first – take a look at current triangle consolidation that is developing on weekly time frame. I see an interesting detail – down moves 2-3 times faster than the up moves. Recall that recent upward move on daily time frame has progressed hard and slow, while plunge was extremely fast. The same was on week before. By this moment we probably could make a conclusion that market is heavy and downward breakout becomes very probable.

If this will indeed happen, where is the target? I see it in completion point of initial AB=CD pattern at 1.2906. This will also create an Agreement with 0.618 Fib support at 1.2954. Looks like we have to return to our initial thoughts about AB=CD weekly downward retracement regardless of whether we want it or not. This thought leads us to the objects that we will have to watch – first is support level, second is the trend. Take a look at second chart – trend will remain bullish only till 1.29 area. As we’ve said in “Monthly” part there is a lot will depend on weekly trend – will it hold or not. If it will hold, upward deeper retracement could happen – right to 1.37 level as we’ve thought initially. If trend will break on bearish side – this will probably lead to further downward move on monthly time frame.
Now take a look at first chart again and compare it with chart of previous research. It shows scenario if weekly bull trend will hold. In this case upward move will start from a bit lower level – 1.29 and targets also will drift a bit lower – I’ve marked it by red arrows. So primary target of this retracement now will stand at 1.37 level and not above 1.38 that is more suitable in terms of monthly Fib levels. But how it could happen? Let’s pass to daily analysis.

Daily
I will share with you scenario that is logical for current existing levels and overall picture. This is just an assumption and perfect model of price action that I would like to see for confirmation potential bullish move on weekly chart.
Although market will definitely behave different, nevertheless this scenario will allow us to specify crucial levels that anyway will be quite important for us and watch for them. So, let’s start with it:
First of all, recall that I’ve talked about fast down moves and hard & heavy upward moves. Second, pay attention to colored lines. They are as usual – blue, green and red are WPP, WPS1 and WPR1 respectively, while gold and lime are MPP and MPS1. Market has already tested gold one (MPP) and moves below it, so monthly sentiment holds bearish. Right below of triangle we see solid support area by double WP Supports – 1.3020-1.3030. This level could be treated as short-term downward target and level from which some retracement could start. Most important for us in medium term is 1.29 area. This area includes: two AB=CD targets from initial and most recent patterns inside of triangle (marked by red dash lines), 5/8 major Fib support, daily oversold level (blue curve line) and 1.27 extension of previous swing high. So that are levels that we have…
Now, if you remember, our significant question on weekly time frame is bullish trend survival. That’s why I’ve drawn butterfly “Buy” picture here. This is possible. If it will be really so, or any other reversal pattern will be formed here – it could lead to bullish scenario on weekly time frame. I even will no talk about potential stop grabber on weekly, since trend will remain bullish only till 1.29 area.
If market will not create any reversal patterns and will fall like stone here, shift weekly trend to bearish, then we must be ready for long-term downward continuation on monthly chart.

4-hour
Finally time has come to speak about short-term perspectives. As on daily as on 4-hour chart trend holds bearish. Our Friday’s trading plan has worked – market has not taken out previous swing high (green circle) and K-resistance that we’ve discussed. Also it has erased hammer pattern and broken all support levels. On this chart we have significant K- resistance level 1.3142-1.3157 that also contains WPP 1.3149. Although perfection of this area is obvious, recall experience of previous week – when market has solid bearish momentum that is confirmed by both trends it could show retracement just to nearest resistance level. That’s why, probably applying of gradual enter is more acceptable here. Still, since right below market stands daily triangle lower border support, may be market will show a deeper retracement and reach WPP, how knows. Currently it is very hard to say definitely.

Hourly
Here trend is bearish. Ugly butterfly “Buy” pattern has a reversal point right at lower border of daily triangle, so retracement is possible. This is what to watch for on Monday.

Conclusion:
Long-term traders come in final period of their expectation. If weekly trend will not hold, then they can use first rally on weekly to enter short in continuation of monthly move. If opposite will happen, then they will have to wait a bit more and probably get better entry level around 1.37.
On short-term perspective we have bearish context. On Monday market could show retracement from lower border of daily triangle that could be used for short entry. I suspect that triangle could be broken down with nearest target around 1.30 – combination of two Pivot supports – monthly and weekly.
Additional attention should be paid to price action on daily time frame in 2-3 weeks perspectives, since it will give us solid context and trading direction for a considerable time.
The technical portion of Sive's analysis owes a great deal to Joe DiNapoli's methods, and uses a number of Joe's proprietary indicators. Please note that Sive's analysis is his own view of the market and is not endorsed by Joe DiNapoli or any related companies.
