Sive Morten
Special Consultant to the FPA
- Messages
- 18,618
Monthly
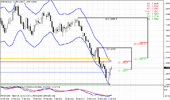
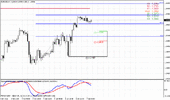
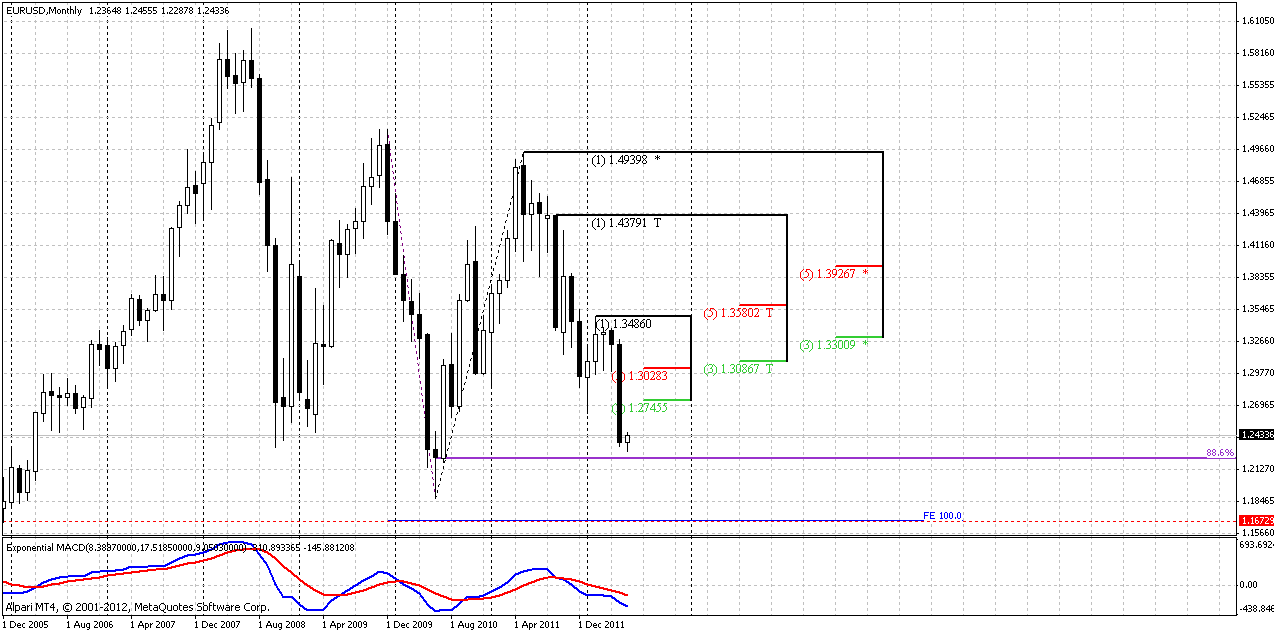
Looking at monthly chart something just forces me to say “No comments”. Trend is strongly bearish, market shows significant downward momentum – May’s candle shows extreme plunge – open at the high and close at the low. It is very hard to expect that market just will stop after such price action and start move in opposite direction. Still market has reached minor 0.886 Fib support. Since this is not some extension target and previous move was really strong, it’s hardly to expect deep retracement here, especially if we will take in consideration the moment that retracement after hitting of 0.618 Fib target just finished. So, if any pullback will happen there are two levels to watch – 1.2745 and K-resistance at 1.3030-1.3086. That is also previous swing low. Next target on monthly chart is 1.16-1.17 area.
Weekly
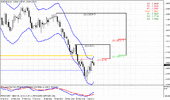
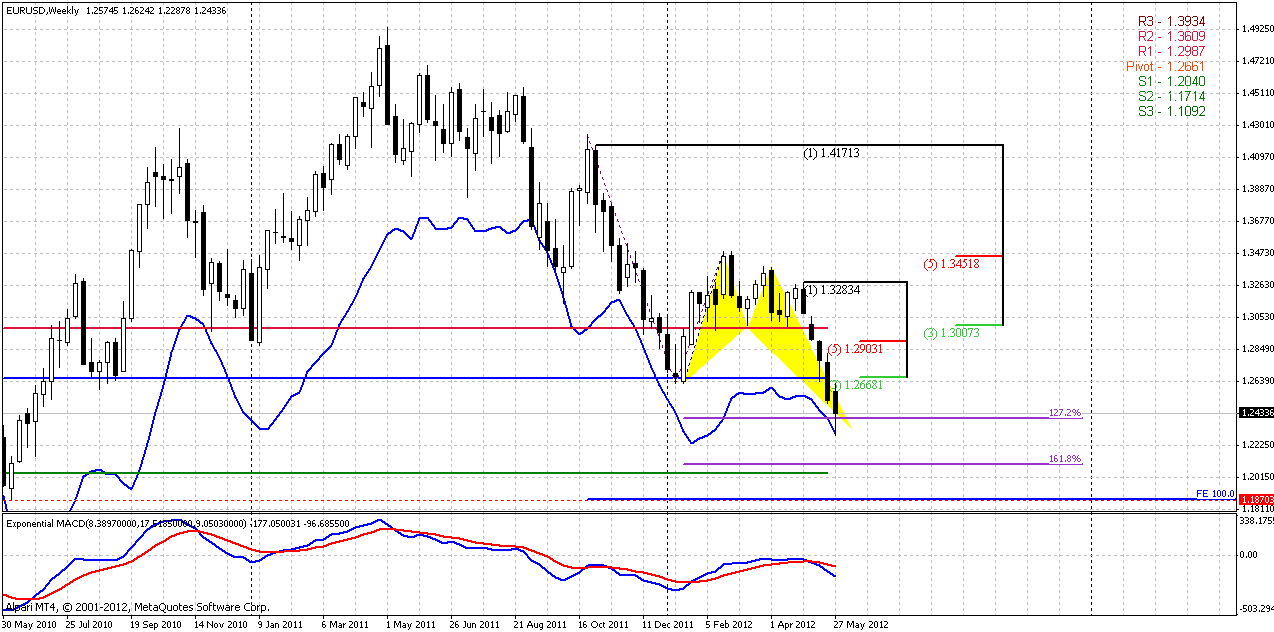
Trend is strongly bearish here as well. I’ve drawn the butterfly that we’ve once discussed on forum – market has reached 1.27 extension of it. But what is more significant is that market stands at weekly oversold. This could lead to some pullback or, at least to sideway choppy price action for some time. 1.618 extension stands around 1.21 area.
Also we have new pivot points for June – MPP=1.2661 and it coincides with nearest Fib resistance, MPR1=1.2987 that stands inside of K-resistance area 1.2903-1.3007. Although context holds bearish this is not the best moment to enter short for positional traders.
Daily
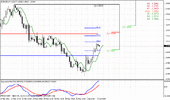
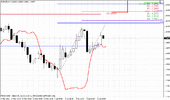
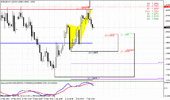
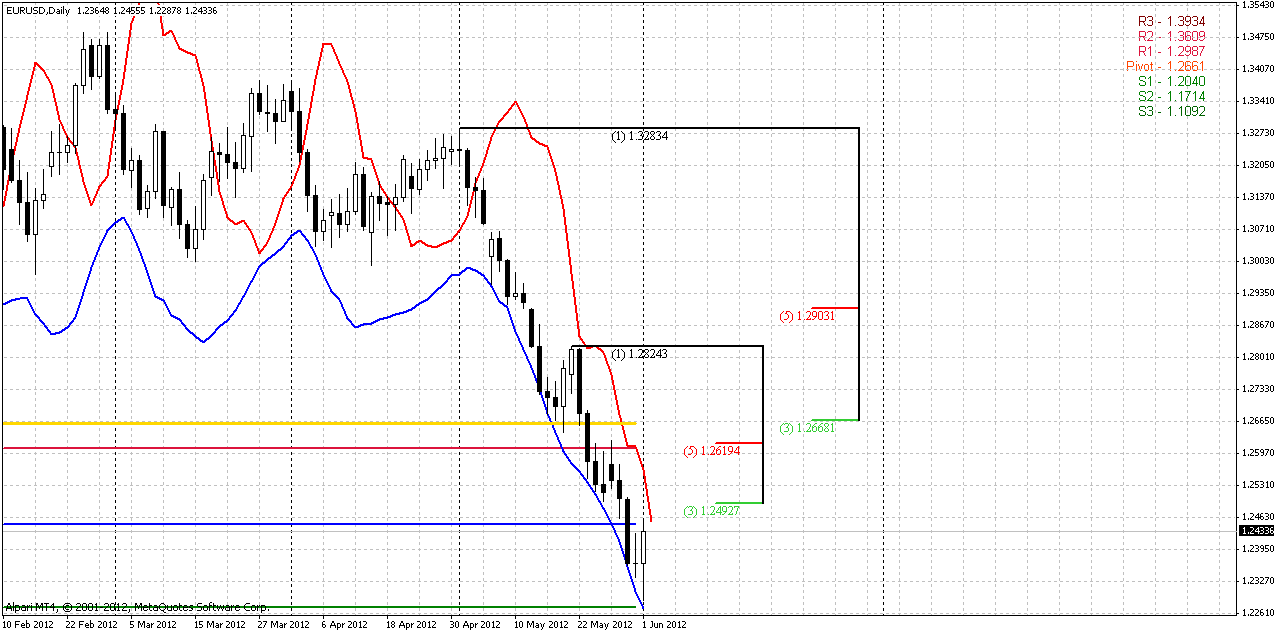
As on previous week, it is difficult to see any patterns right after solid downward move, and, in fact, I do not see any. But we know that market at support and also at daily oversold. Right above the market there are two levels – First is 1.2450-1.2492 of WPP and nearest Fib resistance and second one, that should be in particular focus – 1.2620-1.2668 K-resistance, that also includes WPR1 and MPP.
Another important moment that I would like to discuss is close standing of trend breakeven point (red line). If daily trend will turn bullish this could lead to deeper upward retracement and that is very probable due weekly time frame analysis.
4-hour
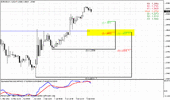
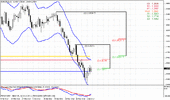
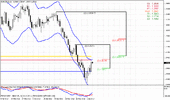
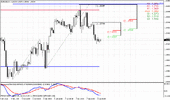
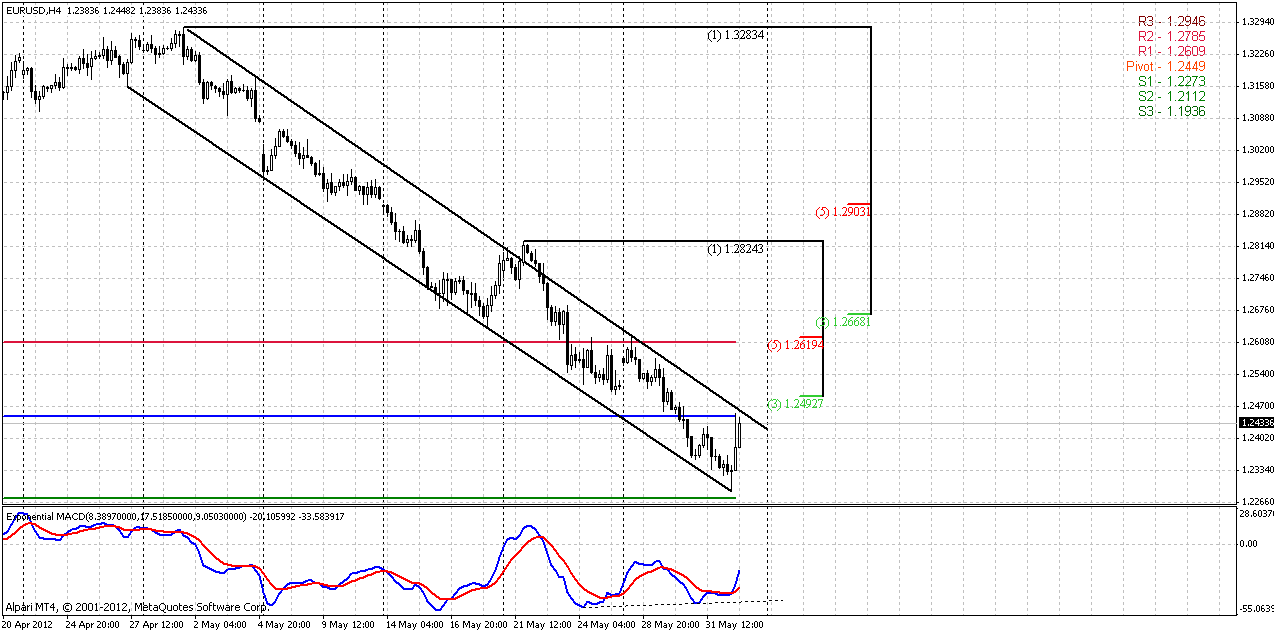
Trend turns bullish here, market is developing by long-term downward channel. Here is also bullish divergence and absence of any other patterns. Probably channel could give us some hint on potential retracement if market will break it up.
Hourly
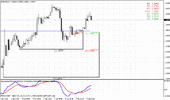
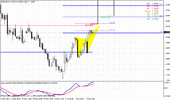
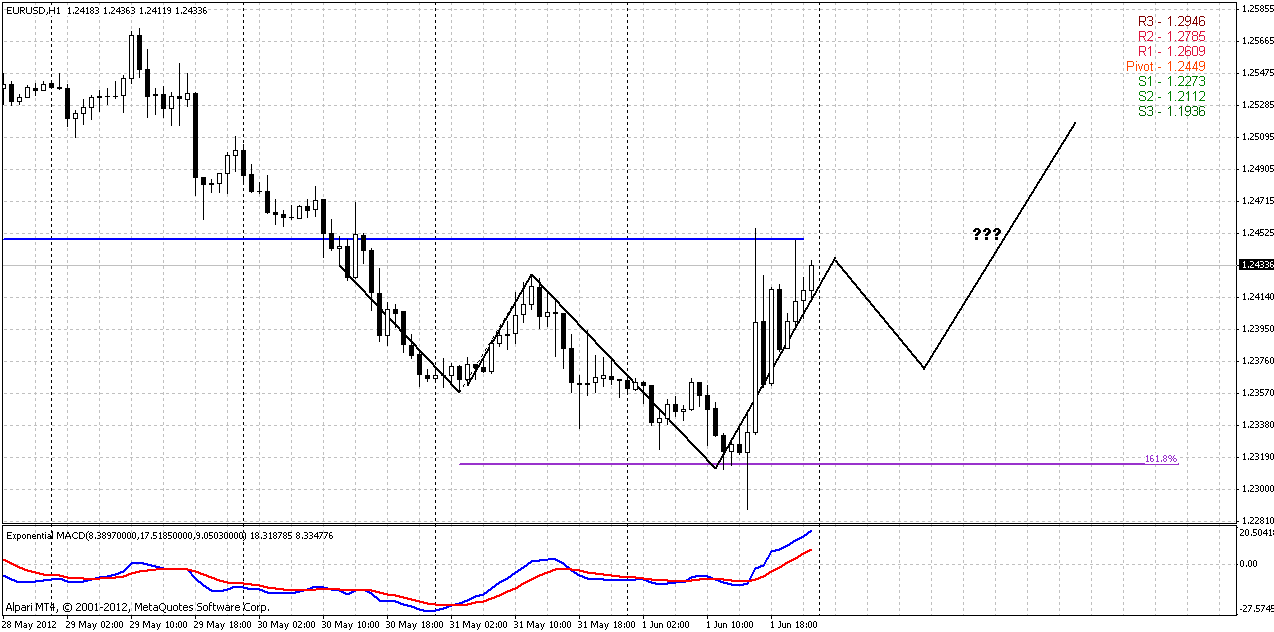
Here is trend bullish, as well. Since market stands at 1.618 extension of previous swing up and this ratio is very typical for H&S patterns, I’ve drawn possible scenario here. If retracement will start it could be triggered by this reversed H&S. This is just an assumption, but currently market shows nothing more.
Conclusion:
Current situation on market shows that price has reached some targets, monthly support daily and weekly oversold. For positional traders this is not ideal situation to add more short positions or initiate new ones, since probability of retracement has increased.
For short term traders – we must keep an eye on couple of moments in the beginning of the week, since they can tell us – will retracement happen or not. First is daily trend, second is 4H downward channel. Breaking both of them will tell that we will have to prepare for some upward pullback.
Hourly chart should be controlled for any reversal patterns (one of them is H&S), since they could be an early indicator of 4H channel breakout.
The technical portion of Sive's analysis owes a great deal to Joe DiNapoli's methods, and uses a number of Joe's proprietary indicators. Please note that Sive's analysis is his own view of the market and is not endorsed by Joe DiNapoli or any related companies.
Looking at monthly chart something just forces me to say “No comments”. Trend is strongly bearish, market shows significant downward momentum – May’s candle shows extreme plunge – open at the high and close at the low. It is very hard to expect that market just will stop after such price action and start move in opposite direction. Still market has reached minor 0.886 Fib support. Since this is not some extension target and previous move was really strong, it’s hardly to expect deep retracement here, especially if we will take in consideration the moment that retracement after hitting of 0.618 Fib target just finished. So, if any pullback will happen there are two levels to watch – 1.2745 and K-resistance at 1.3030-1.3086. That is also previous swing low. Next target on monthly chart is 1.16-1.17 area.

Weekly
Trend is strongly bearish here as well. I’ve drawn the butterfly that we’ve once discussed on forum – market has reached 1.27 extension of it. But what is more significant is that market stands at weekly oversold. This could lead to some pullback or, at least to sideway choppy price action for some time. 1.618 extension stands around 1.21 area.
Also we have new pivot points for June – MPP=1.2661 and it coincides with nearest Fib resistance, MPR1=1.2987 that stands inside of K-resistance area 1.2903-1.3007. Although context holds bearish this is not the best moment to enter short for positional traders.

Daily
As on previous week, it is difficult to see any patterns right after solid downward move, and, in fact, I do not see any. But we know that market at support and also at daily oversold. Right above the market there are two levels – First is 1.2450-1.2492 of WPP and nearest Fib resistance and second one, that should be in particular focus – 1.2620-1.2668 K-resistance, that also includes WPR1 and MPP.
Another important moment that I would like to discuss is close standing of trend breakeven point (red line). If daily trend will turn bullish this could lead to deeper upward retracement and that is very probable due weekly time frame analysis.

4-hour
Trend turns bullish here, market is developing by long-term downward channel. Here is also bullish divergence and absence of any other patterns. Probably channel could give us some hint on potential retracement if market will break it up.

Hourly
Here is trend bullish, as well. Since market stands at 1.618 extension of previous swing up and this ratio is very typical for H&S patterns, I’ve drawn possible scenario here. If retracement will start it could be triggered by this reversed H&S. This is just an assumption, but currently market shows nothing more.

Conclusion:
Current situation on market shows that price has reached some targets, monthly support daily and weekly oversold. For positional traders this is not ideal situation to add more short positions or initiate new ones, since probability of retracement has increased.
For short term traders – we must keep an eye on couple of moments in the beginning of the week, since they can tell us – will retracement happen or not. First is daily trend, second is 4H downward channel. Breaking both of them will tell that we will have to prepare for some upward pullback.
Hourly chart should be controlled for any reversal patterns (one of them is H&S), since they could be an early indicator of 4H channel breakout.
The technical portion of Sive's analysis owes a great deal to Joe DiNapoli's methods, and uses a number of Joe's proprietary indicators. Please note that Sive's analysis is his own view of the market and is not endorsed by Joe DiNapoli or any related companies.
