Sive Morten
Special Consultant to the FPA
- Messages
- 18,621
Monthly
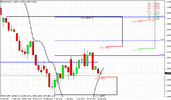
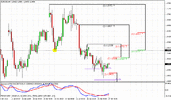
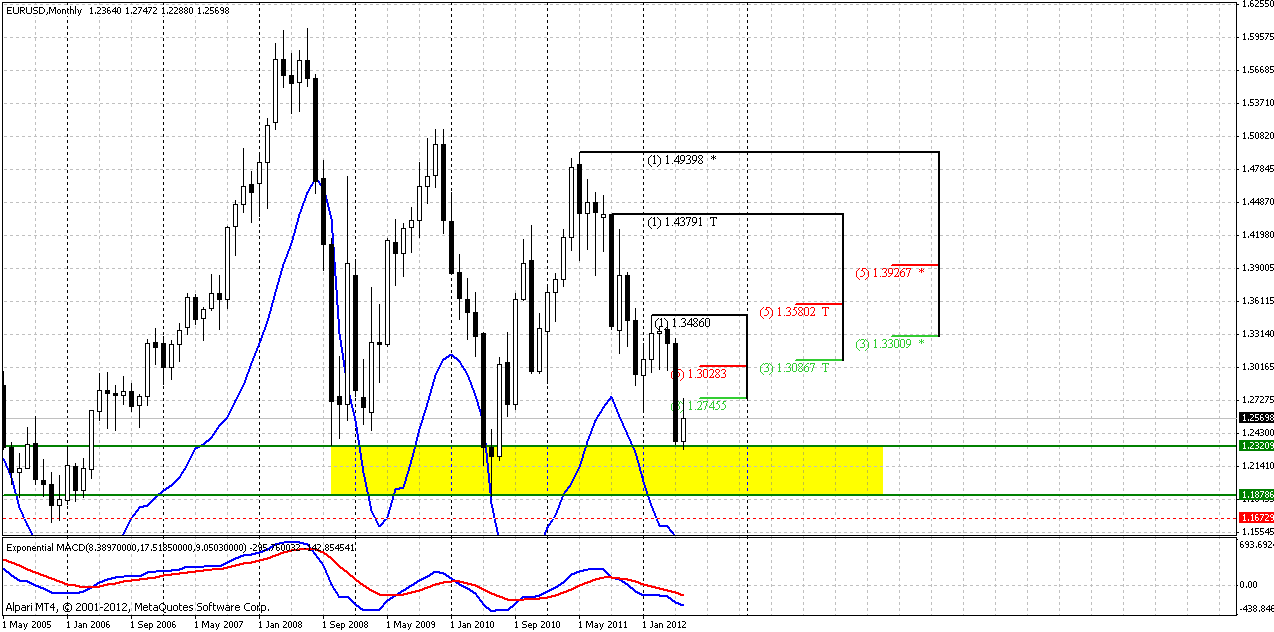
Since market still stands in retracement on daily time frame, monthly chart looks almost the same as on previous week.
Monthly trend holds strongly bearish. Very often after solid candles market takes some pause. This does not happen every time, but often. Now we see something of that kind. Although solid monthly resistance stands at 1.3028-1.3086 K-area, probably we should mostly focus on nearest resistance still – 1.2745 - price has reached it during previous week. Usually market shows deeper bounce, when hitting some target and/or support level. That is what we particularly see during previous retracement, when market has hit 0.618 Fib extension target and 0.618 Fib support level. But currently market just stands at minor 0.886 support level. Most important for us is that market stands just at upper border of 4-year support zone – 1.1870-1.2320. This level is extremely important for EUR currency. It has been tested twice already and both times that was at monthly oversold – that, probably, has prevented it’s breakout from technical point of view. Currently market is not at oversold and coming for 3rd testing of it. Since 1.2320 level was passed by move down in 2008, there are no significant barriers for market to proceed lower right to the lower border of it. Breakout of this area could trigger serious downward consequences for this pair.
If you let me, I still want to make single remark on possible upward retracement. Although we’ve said that retracement should not be deep from perspectives of Fibonacci framework, it could become so from classical price action. Very often and many of you probably saw it, when market is testing some level for 2 times, usually it shows deep and almost equal bounce between these tests, while before breakout, last retracement approximately 2-3 times smaller, that indicates exhausting of support and buyers’ power around it. For us it means that we should be sensitive for upward price action, and possible move to 1.33-1.35 should not surprise us. I do not want to say that this has to happen, I still think that retracement, probably will be shallow (market already stands at 3rd testing of this area). I just want you to be sensitive, mind-open and flexible for any development of that kind and will not be frustrated by stronger upward action. This speech does not relate to short-term perspective and probably not even to current research, but for farer future – if we will see upward move to 1.30, then 1.32, we should not surprise and tell it can’t be. This will not become a major reversal – initially this will be just bounce up from strong 1.18-1.20 support area if market will not be able to pass it through.
Weekly
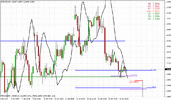
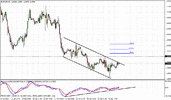
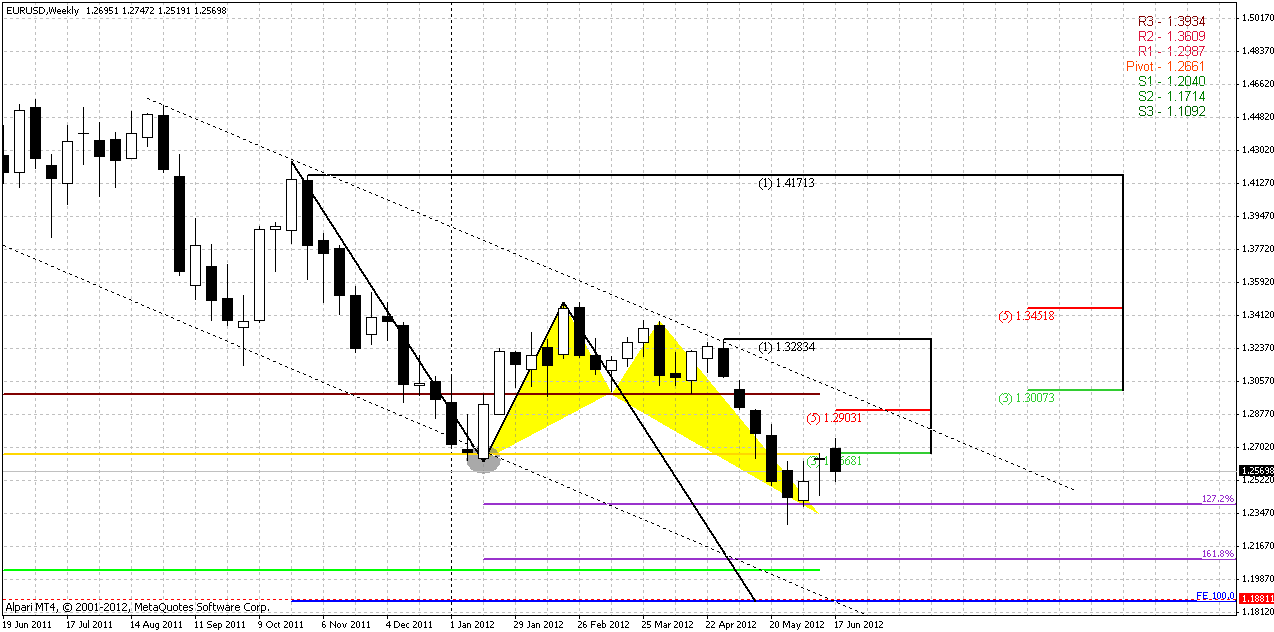
From perspective on weekly time frame some upward continuation will not become a tragedy for bears, since trend will hold bearish if even market will hit 1.29-1.30 K-resistance that is also MPR1 and upper border of long-term parallel channel. The major question though – do bulls have enough power to continue push market higher. I’m not sure that we could resolve it by now, since price action is sloppy and no definite patterns just yet, that could point of retracement finish.
From technical perspective, market could continue move down – all previous bullish patterns have worked out. Particularly, market has corrected oversold and butterfly “buy” has reached minimum demanded target – 0.382 retracement at 1.2670 – previous K-resistance, MPP and previous lows (grey circle on the chart). Currently price action here looks like flag consolidation after significant move down and this lets us thing that sooner or later downside action should continue. But, unfortunately weekly time frame can’t give us any precise information.
Our major point here is AB=CD pattern destination point around 1.18-1.19. Looks like that as on previous week we will have to stick with daily and intraday charts dealing only with some short-term intraday scenarios, until we see some clearer and significant patterns, or, at least market will reach significant resistance.
Daily
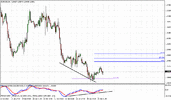
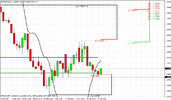
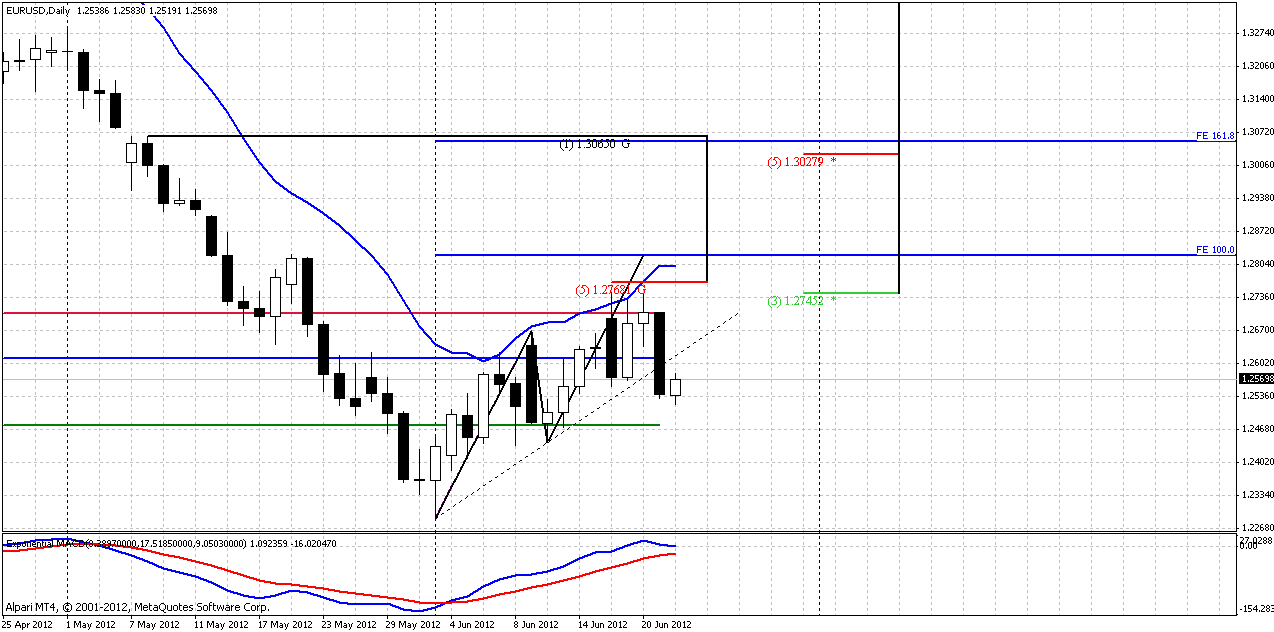
Trend holds bullish here. Yesterday price action was relatively tight, so only few moments could be added here. On Friday we’ve discussed that on first view market obviously looks bearish – plunge on Thursday has engulfed 5 previous trading sessions by close price, market moved below as WPP as MPP and broken upward channel support line. Well may be this is really so. My task here is not to argue, but to give you another view on current price action that will be based on some patterns.
On Monday the great importance will become a WPP at 1.2612. First – because this is pivot point and we know its importance for sentiment identification, second, because this is simultaneously broken channel’s support line. If market will return above this level, it will tell us that bulls are still in charge. If not – then it will be retesting of trend line and WPP for goodbye and downward continuation. So anyway, 1.26-1.2610 area is very important level for beginning of the week.
4-hour
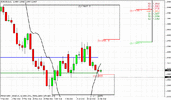
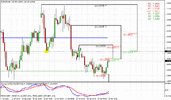
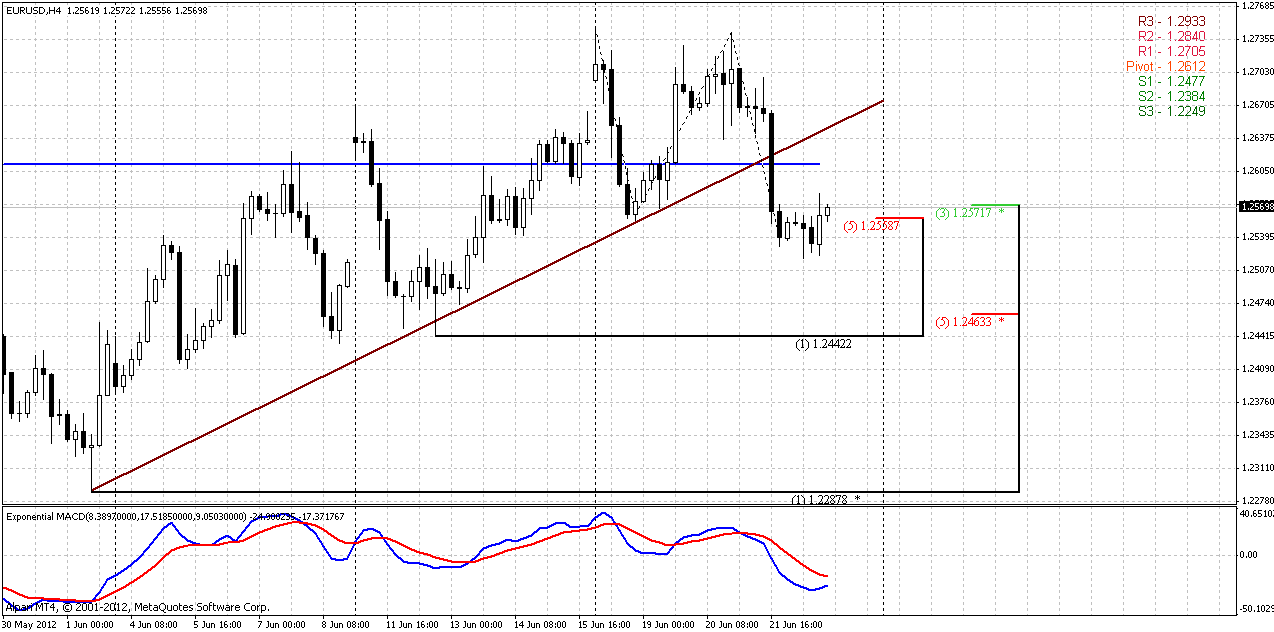
Trend holds bearish here, but it clearly could be seen that market has found some support. That is what we’ve talked about yesterday. Here you also can see excellent educative moment, about which Joe DiNapoli tells in his book. “If market has some AB=CD extension target slightly lower than some support level and price has pierced it – it does not mean that this level is broken. It still could be valid, since market just gravitates to achieve AB=CD target”. This is not the quote – just a meaning of it. Here we also can see, that it seems like market has broken K-support, but in reality it has just achieved AB-CD target, so this level probably valid. Price action was really choppy around it on Friday. Also we have here Gartley “222” Buy, based on recent swing up. Other words, situation is not absolutely bearish here, bulls were disguised, but they still have chances on counter attack. And should be ready to get signs of it.
30-min
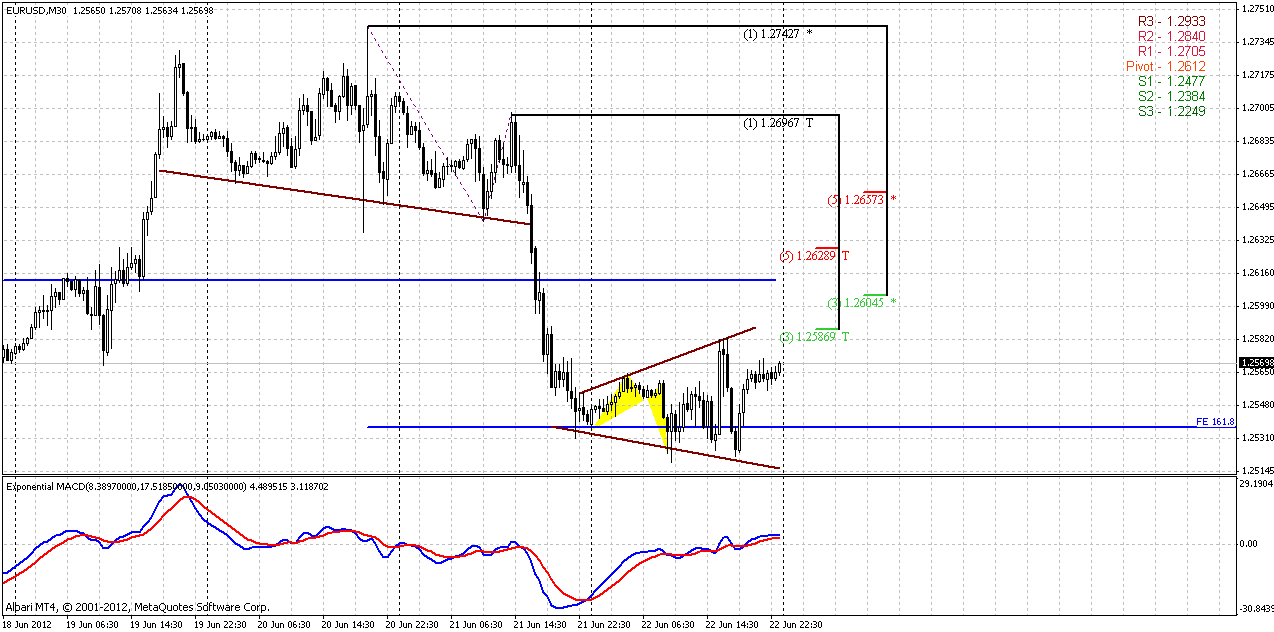
Here I’ve decided to change common way and apply 30-min chart instead of hourly one, because it will help us clearer to see what has happened previously. Trend is bullish as on hourly as on 30-min chart now.
First of all, let’s take a look what has happened on Friday. At the moment of daily update we had thrust down and I’ve said – keep an eye on possible reversal patterns, that could be either DRPO or may be Butterfly. So, here is nice 1.27 butterfly that looks even better on 15-min chart. Also, take a look that price action has started by ugly H&S pattern, when market was not able to conifm dynamic pressure inside of rectangle that we’ve also discussed on Thursday and broken it down. So, current K-support on 4-hour chart is also an Agreement with 1.618 target of H&S pattern and this target has achieved.
Second, look at price action of Friday – three times, it was seemed that bears totally destroyed buyers and pulled prices down to K-support, but by the end of the day bulls again and again returned their positions. As a result here has appeared broadening bottom pattern, or, triangle – as you wish, that very often could lead to some kind of reversal.
This price action makes me think that if even market will not turn to upward continuation, some deeper retracement is possible on Monday, as we said, most probable to WPP=1.2612. Here we also can see that this is K-resistance area.
Conclusion:
Long-term traders should wait some clearer signs of retracement finish, or at least reaching of significant resistance level to enter short. Although some small lot, mostly indicative probably could be opened even here – for the case if market will continue move down.
Short-term perspectives mostly related to 1.26-1.2620 area and WPP. Friday’s price action and broadening bottom gave some hint that current support may be stronger that it seems, so on Monday some upward continuation after opening could happen, probably right to WPP.
And here we will get decision. If market will just retest trend line in a sort of “Kiss goodbye” this will be chance to enter short, while moving above pivot and trend line will suggest further upward continuation.
There is no need to say, that if market will continue move down, then bulls’ hopes will become mostly phantasmal.
The technical portion of Sive's analysis owes a great deal to Joe DiNapoli's methods, and uses a number of Joe's proprietary indicators. Please note that Sive's analysis is his own view of the market and is not endorsed by Joe DiNapoli or any related companies.
Since market still stands in retracement on daily time frame, monthly chart looks almost the same as on previous week.
Monthly trend holds strongly bearish. Very often after solid candles market takes some pause. This does not happen every time, but often. Now we see something of that kind. Although solid monthly resistance stands at 1.3028-1.3086 K-area, probably we should mostly focus on nearest resistance still – 1.2745 - price has reached it during previous week. Usually market shows deeper bounce, when hitting some target and/or support level. That is what we particularly see during previous retracement, when market has hit 0.618 Fib extension target and 0.618 Fib support level. But currently market just stands at minor 0.886 support level. Most important for us is that market stands just at upper border of 4-year support zone – 1.1870-1.2320. This level is extremely important for EUR currency. It has been tested twice already and both times that was at monthly oversold – that, probably, has prevented it’s breakout from technical point of view. Currently market is not at oversold and coming for 3rd testing of it. Since 1.2320 level was passed by move down in 2008, there are no significant barriers for market to proceed lower right to the lower border of it. Breakout of this area could trigger serious downward consequences for this pair.
If you let me, I still want to make single remark on possible upward retracement. Although we’ve said that retracement should not be deep from perspectives of Fibonacci framework, it could become so from classical price action. Very often and many of you probably saw it, when market is testing some level for 2 times, usually it shows deep and almost equal bounce between these tests, while before breakout, last retracement approximately 2-3 times smaller, that indicates exhausting of support and buyers’ power around it. For us it means that we should be sensitive for upward price action, and possible move to 1.33-1.35 should not surprise us. I do not want to say that this has to happen, I still think that retracement, probably will be shallow (market already stands at 3rd testing of this area). I just want you to be sensitive, mind-open and flexible for any development of that kind and will not be frustrated by stronger upward action. This speech does not relate to short-term perspective and probably not even to current research, but for farer future – if we will see upward move to 1.30, then 1.32, we should not surprise and tell it can’t be. This will not become a major reversal – initially this will be just bounce up from strong 1.18-1.20 support area if market will not be able to pass it through.

Weekly
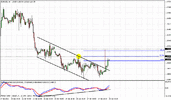
From perspective on weekly time frame some upward continuation will not become a tragedy for bears, since trend will hold bearish if even market will hit 1.29-1.30 K-resistance that is also MPR1 and upper border of long-term parallel channel. The major question though – do bulls have enough power to continue push market higher. I’m not sure that we could resolve it by now, since price action is sloppy and no definite patterns just yet, that could point of retracement finish.
From technical perspective, market could continue move down – all previous bullish patterns have worked out. Particularly, market has corrected oversold and butterfly “buy” has reached minimum demanded target – 0.382 retracement at 1.2670 – previous K-resistance, MPP and previous lows (grey circle on the chart). Currently price action here looks like flag consolidation after significant move down and this lets us thing that sooner or later downside action should continue. But, unfortunately weekly time frame can’t give us any precise information.
Our major point here is AB=CD pattern destination point around 1.18-1.19. Looks like that as on previous week we will have to stick with daily and intraday charts dealing only with some short-term intraday scenarios, until we see some clearer and significant patterns, or, at least market will reach significant resistance.

Daily
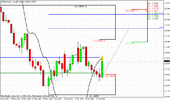
Trend holds bullish here. Yesterday price action was relatively tight, so only few moments could be added here. On Friday we’ve discussed that on first view market obviously looks bearish – plunge on Thursday has engulfed 5 previous trading sessions by close price, market moved below as WPP as MPP and broken upward channel support line. Well may be this is really so. My task here is not to argue, but to give you another view on current price action that will be based on some patterns.
On Monday the great importance will become a WPP at 1.2612. First – because this is pivot point and we know its importance for sentiment identification, second, because this is simultaneously broken channel’s support line. If market will return above this level, it will tell us that bulls are still in charge. If not – then it will be retesting of trend line and WPP for goodbye and downward continuation. So anyway, 1.26-1.2610 area is very important level for beginning of the week.

4-hour
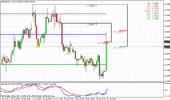
Trend holds bearish here, but it clearly could be seen that market has found some support. That is what we’ve talked about yesterday. Here you also can see excellent educative moment, about which Joe DiNapoli tells in his book. “If market has some AB=CD extension target slightly lower than some support level and price has pierced it – it does not mean that this level is broken. It still could be valid, since market just gravitates to achieve AB=CD target”. This is not the quote – just a meaning of it. Here we also can see, that it seems like market has broken K-support, but in reality it has just achieved AB-CD target, so this level probably valid. Price action was really choppy around it on Friday. Also we have here Gartley “222” Buy, based on recent swing up. Other words, situation is not absolutely bearish here, bulls were disguised, but they still have chances on counter attack. And should be ready to get signs of it.

30-min
Here I’ve decided to change common way and apply 30-min chart instead of hourly one, because it will help us clearer to see what has happened previously. Trend is bullish as on hourly as on 30-min chart now.
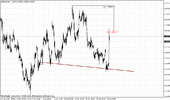
First of all, let’s take a look what has happened on Friday. At the moment of daily update we had thrust down and I’ve said – keep an eye on possible reversal patterns, that could be either DRPO or may be Butterfly. So, here is nice 1.27 butterfly that looks even better on 15-min chart. Also, take a look that price action has started by ugly H&S pattern, when market was not able to conifm dynamic pressure inside of rectangle that we’ve also discussed on Thursday and broken it down. So, current K-support on 4-hour chart is also an Agreement with 1.618 target of H&S pattern and this target has achieved.
Second, look at price action of Friday – three times, it was seemed that bears totally destroyed buyers and pulled prices down to K-support, but by the end of the day bulls again and again returned their positions. As a result here has appeared broadening bottom pattern, or, triangle – as you wish, that very often could lead to some kind of reversal.
This price action makes me think that if even market will not turn to upward continuation, some deeper retracement is possible on Monday, as we said, most probable to WPP=1.2612. Here we also can see that this is K-resistance area.

Conclusion:
Long-term traders should wait some clearer signs of retracement finish, or at least reaching of significant resistance level to enter short. Although some small lot, mostly indicative probably could be opened even here – for the case if market will continue move down.
Short-term perspectives mostly related to 1.26-1.2620 area and WPP. Friday’s price action and broadening bottom gave some hint that current support may be stronger that it seems, so on Monday some upward continuation after opening could happen, probably right to WPP.
And here we will get decision. If market will just retest trend line in a sort of “Kiss goodbye” this will be chance to enter short, while moving above pivot and trend line will suggest further upward continuation.
There is no need to say, that if market will continue move down, then bulls’ hopes will become mostly phantasmal.
The technical portion of Sive's analysis owes a great deal to Joe DiNapoli's methods, and uses a number of Joe's proprietary indicators. Please note that Sive's analysis is his own view of the market and is not endorsed by Joe DiNapoli or any related companies.
