Sive Morten
Special Consultant to the FPA
- Messages
- 18,669
Monthly
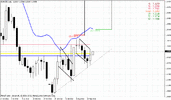
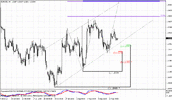
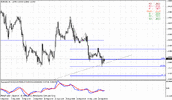
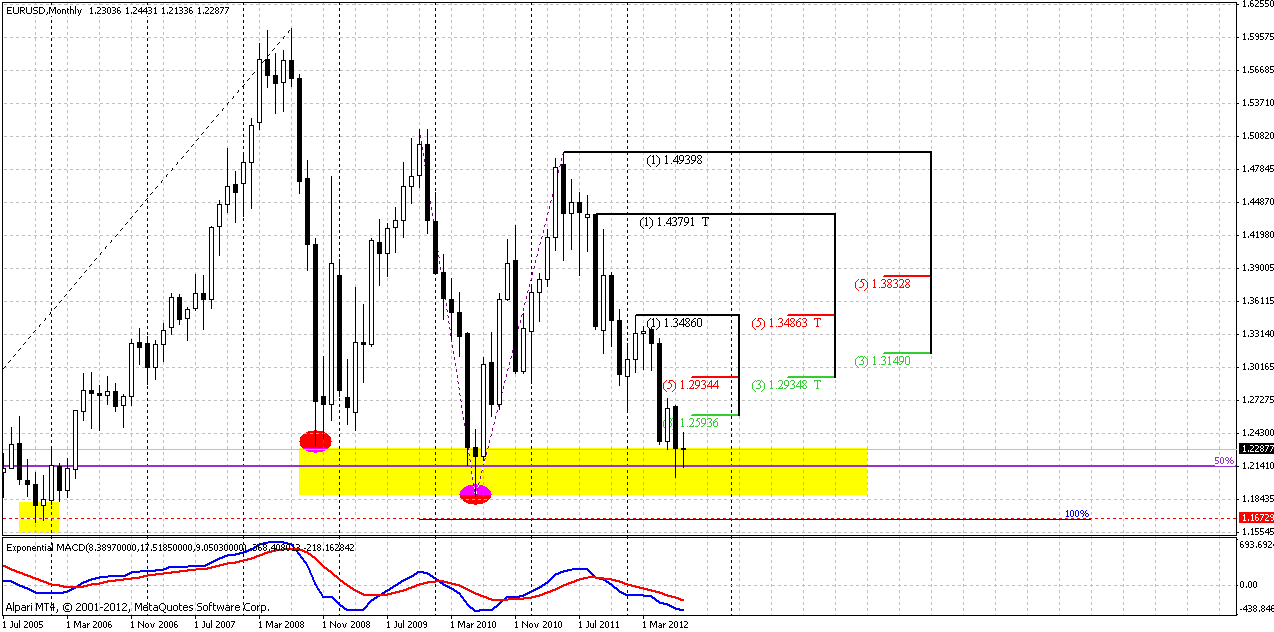
Monthly trend holds bearish. Price continues to force significant support area 1.19-1.23 that held EUR twice from collapse – first time in 2008 when sub-prime crisis has started and second – in 2010 at beginning of Greece turmoil.
Actually, it is difficult to add something to previous analysis, since price action stands in a tight range. At least currently August stands as inside month to July. Minimum target still is 1.16-1.17 area, based on analysis of quarterly chart of Dollar Index that we’ve made in Nov 2011. Index has 95% correlation with EUR/USD. Also this is AB=CD target of most recent pattern on current chart. Also take a look – this is significant support of 2005 as well – marked by yellow rectangle.
Nearest Fib resistance is 1.2593, stronger area is monthly K-resistance 1.2934. In short-term perspective some bounce to 1.25-1.26 area looks possible. Last two candles have longer shadows, so it shows that support still presents here, despite solid piercing of this area in 2010.
In longer-term market is entering into very, say, “dangerous” area, and it comes to it not at oversold as it was two times previously. If it will break it – this will be the road to 1.07-1.10 area or ultimately even to parity.
Weekly
Here I left some important thoughts from previous research, so we can track how situation is changing:
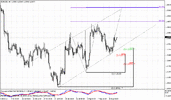
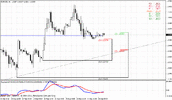
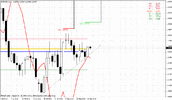
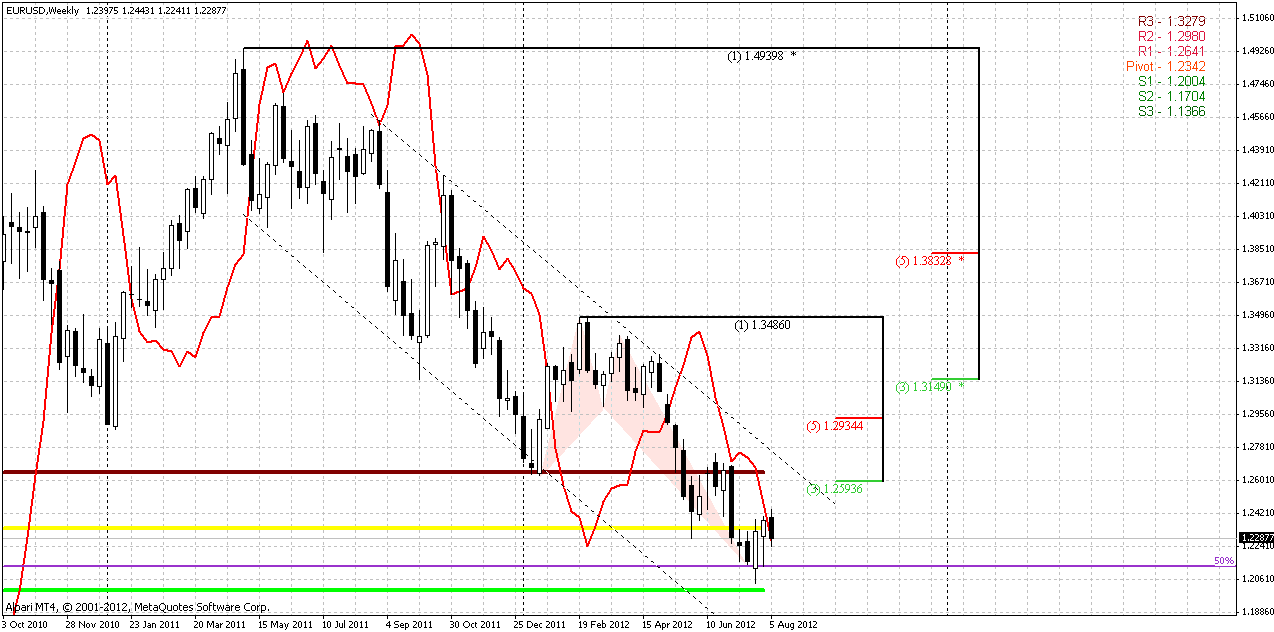
“…Here I would like to discuss couple of moments that we haven’t touched in previous researches. First of all – take a look at overall price move inside downward parallel channel. During previous bottoms, when price touched low border of the channel there were no divergences. Also we do not see any reversal patterns, when these bottoms were reached. Second moment is – market did not start move to upper border prior of reaching lower one first.
Now take a look at current price action – we have all these signs that weren’t here previously. We have divergence, although it is not quite completed yet, we have butterfly “buy” pattern at long-term 50% monthly support and we see that market is showing attempt to do upward retracement before reaching of lower border of the channel. What conclusion could be made from all this stuff?
Well, one part of puzzle is still absent, I think. I’m speaking about depth of current retracement. If you will take a close look at weekly chart, you’ll see that appearing some kind of bullish wedge or 3-Drive pattern is still possible. By completing of this pattern, market precisely will reach lower border and will continue movement inside of channel. But for that purpose current retracement should stop around 1.2550 area. If this will not happen, then all factors that we just have specified will come in play, and retracement could be deeper.”
So, I have to say, that weekly chart is most interesting now. Look – we have some contradiction between potential 3-Drive, that theoretically should push market to lower border of channel, and bullish engulfing pattern. Recall, that minimum target of engulfing pattern is a length of the bars. So, if you will count it to upside – that will be around 1.2550-1.26 area and MPR1. If this really will happen, then, take a look at the chart – this could lead to reverse H&S pattern and deeper retracement to 1.30 K-resistance on weekly/monthly time frames.
Another significant thing has changed here – trend has turned bullish, that’s not a stop grabber on weekly chart. So, it seems that our major attention will be on major 5/8 support on daily time frame, because bears will need to break it to return control over market and shift trend to bearish again. But bulls have solid counter argument here – butterfly “Buy”, Bullish engulfing pattern, bull trend as weekly as daily and finally, Fib support on daily chart.
Daily
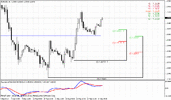
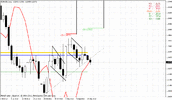
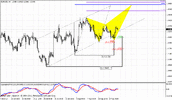
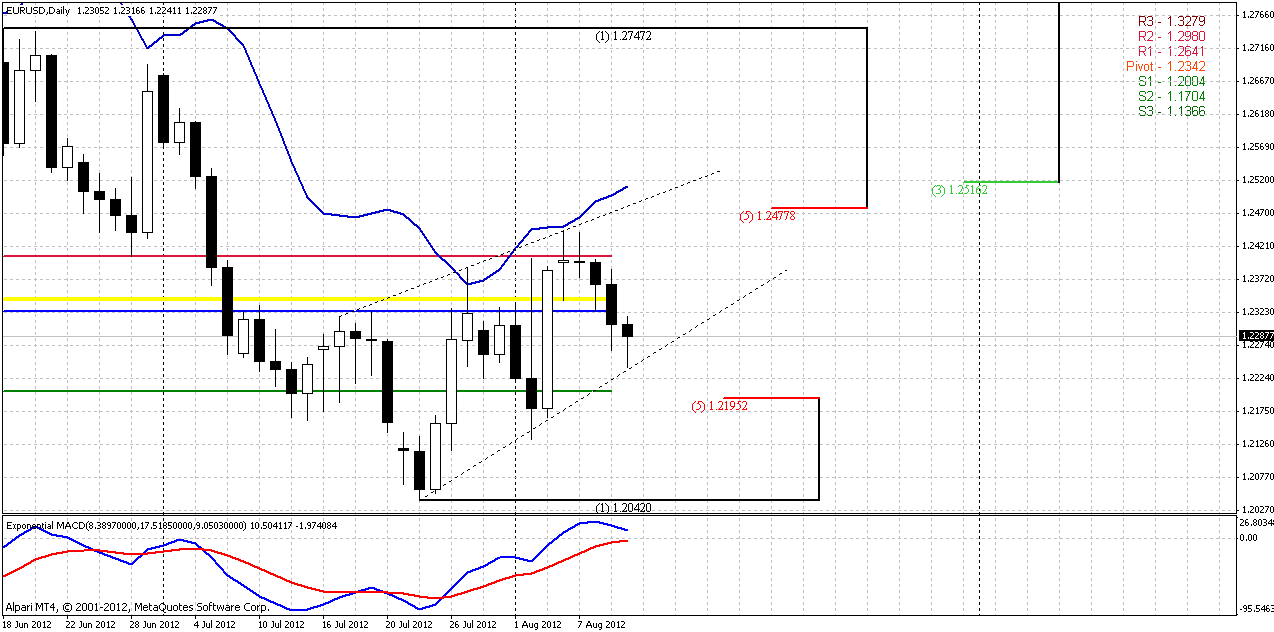
So, here we finally come to daily time frame. As we’ve said above, our major interest here is upward retracement and major 0.618 support at 1.2195 area. What bulls’ advantages can we see here? First of all, this is upward strong moves. Take a look both move up was fast, by strong white candles and both times it was stop by daily overbought, although this could happened occasionally. Second, take a look at MACD indicator – inside of say, “wedge” pattern we do not see any divergence as by simple MACD as by Histogram (because distance between MACD lines is greater at second top inside the wedge). That is not typical for reversal pattern.
What about bears? Market stands below monthly pivot point. Current WPP stands almost in the same range. Also take a look WPS1 will add support to major Fib level. Well, may be you will not agree, but looks like bulls position look preferable, at least buyers still should have some power for another one push up. Speaking about potential targets, it could be as AB=CD from initial swings as most recent AB=CD, if we suggest that current move down is BC leg. In this case market could reach as 1.25 area as 1.2565. Although latter one is more close to weekly number – it is beyond overbought currently, so let’s orient first at former. Even move to 1.25 will not be bad, right?
4-hour
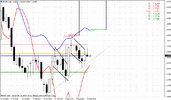
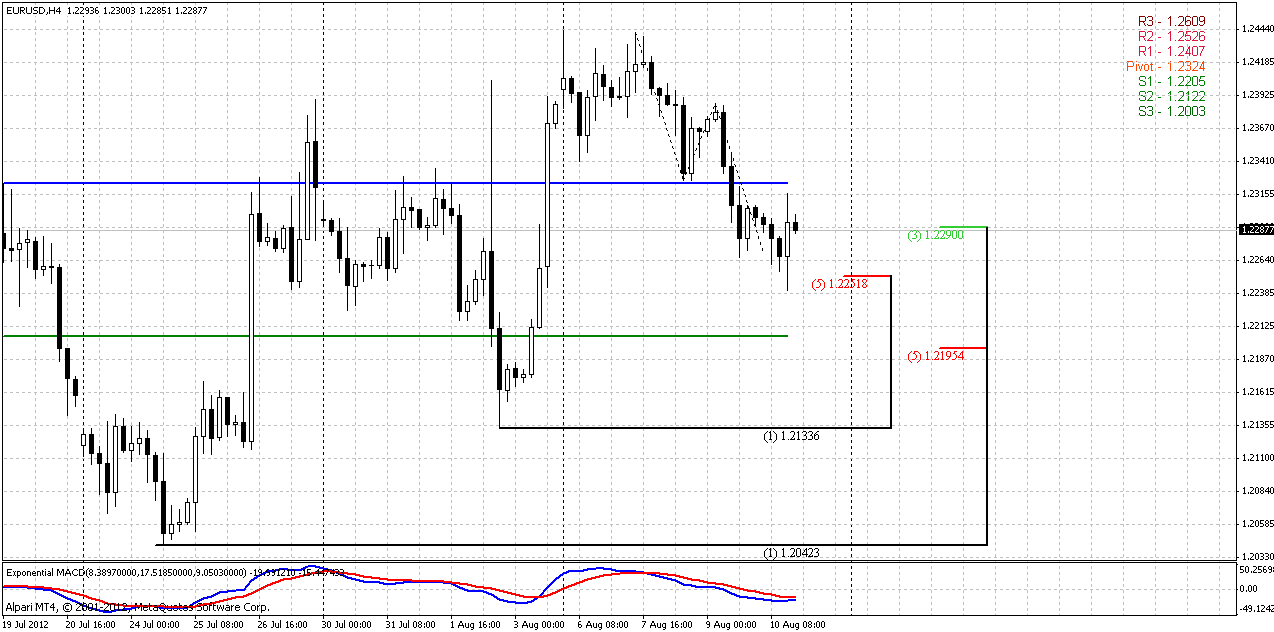
Trend here is bearish. On previous week we chewing this area and said that this is nice level to enter long, since its breakout will put under question bullish perspectives. This moment is easy to explain. Usually market could show deep pullbacks either from significant resistance areas or after reaching significant target. Here we do see neither former nor latter. Current pullback could be justified only by overbought condition. That’s why move lower could be looked as suspicious. Right at current level we also have to different expansion targets - AB=CD that I’ve drawn and 1.618 from AB-CD on top. So, that is also an Agreement. This level should hold, if bulls are still in charge.
On Friday we agreed to look for reversal patterns here and if we will see any – try to enter long.
15-min
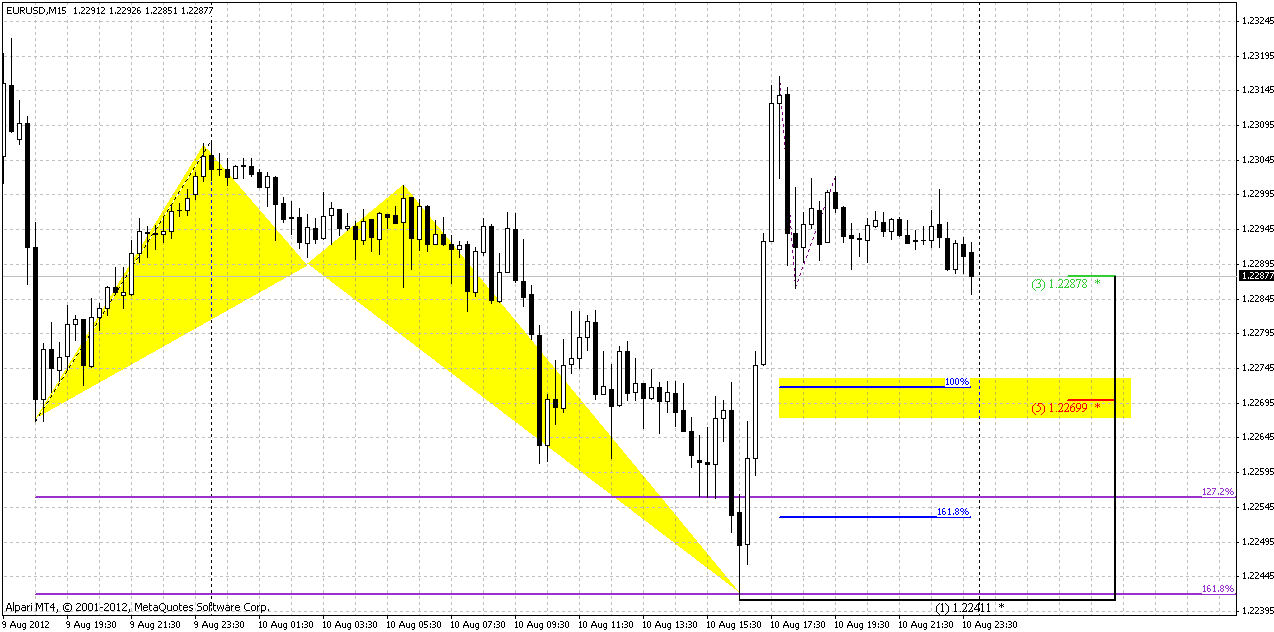
Today we will take a look at 15-min chart, since it better shows neccesary information. So, we have everything – bullish trends on higher time frames, strong support at 4-hour chart and reversal pattern right at this level on 15 min chart. Hence, it will be easier to judge about bulls’ failure. So, market has formed Butterfly “buy” – that was our possible scenario for yesterday. If you again have skept this entry, here is another chance. Market has shown solid swing up, that is greater than previous swing down. That is short-term reversal price action. Usually when market shows such reversals after long bear trend, it shows deep retracement. Rule of thumb is to buy first AB-CD retracement after reversal swing. This will give us an Agreement with 0.618 support at 1.2270-1.2275 area. Stop should placed below butterfly’s low. If all this stuff will fail and market will break it down – be ready for revolutionary regime change – bears could return control over the market.
P.S. Take a look at excellent evening star pattern...
Conclusion:
Long-term bearish sentiment is still in play. At the same time situation on weekly chart looks dubiously. If bulls will push market to 1.26 area – this could lead for further continuation to 1.30. If not, and price will break 1.2190 support area, then downward move will be more probable in a row with potential weekly 3-Drive “Buy” pattern. So, we can say that current week is important for medium term perspective.
In shorter-term frame market has done everything for upward continuation: weekly and daily trends are bullish, market stands at intraday K-support, no divergence and has formed reversal pattern at 15-min chart. That gives us nice foundation and easy possibility to catch bullish failure. If this construction will fail, then, I suppose, that it will put start for downward scenario. If you still would like to take part in upward action (if it will happen at all) – look for 1.2270 as potential entry level.
The technical portion of Sive's analysis owes a great deal to Joe DiNapoli's methods, and uses a number of Joe's proprietary indicators. Please note that Sive's analysis is his own view of the market and is not endorsed by Joe DiNapoli or any related companies.
Monthly trend holds bearish. Price continues to force significant support area 1.19-1.23 that held EUR twice from collapse – first time in 2008 when sub-prime crisis has started and second – in 2010 at beginning of Greece turmoil.
Actually, it is difficult to add something to previous analysis, since price action stands in a tight range. At least currently August stands as inside month to July. Minimum target still is 1.16-1.17 area, based on analysis of quarterly chart of Dollar Index that we’ve made in Nov 2011. Index has 95% correlation with EUR/USD. Also this is AB=CD target of most recent pattern on current chart. Also take a look – this is significant support of 2005 as well – marked by yellow rectangle.
Nearest Fib resistance is 1.2593, stronger area is monthly K-resistance 1.2934. In short-term perspective some bounce to 1.25-1.26 area looks possible. Last two candles have longer shadows, so it shows that support still presents here, despite solid piercing of this area in 2010.
In longer-term market is entering into very, say, “dangerous” area, and it comes to it not at oversold as it was two times previously. If it will break it – this will be the road to 1.07-1.10 area or ultimately even to parity.

Weekly
Here I left some important thoughts from previous research, so we can track how situation is changing:
“…Here I would like to discuss couple of moments that we haven’t touched in previous researches. First of all – take a look at overall price move inside downward parallel channel. During previous bottoms, when price touched low border of the channel there were no divergences. Also we do not see any reversal patterns, when these bottoms were reached. Second moment is – market did not start move to upper border prior of reaching lower one first.
Now take a look at current price action – we have all these signs that weren’t here previously. We have divergence, although it is not quite completed yet, we have butterfly “buy” pattern at long-term 50% monthly support and we see that market is showing attempt to do upward retracement before reaching of lower border of the channel. What conclusion could be made from all this stuff?
Well, one part of puzzle is still absent, I think. I’m speaking about depth of current retracement. If you will take a close look at weekly chart, you’ll see that appearing some kind of bullish wedge or 3-Drive pattern is still possible. By completing of this pattern, market precisely will reach lower border and will continue movement inside of channel. But for that purpose current retracement should stop around 1.2550 area. If this will not happen, then all factors that we just have specified will come in play, and retracement could be deeper.”
So, I have to say, that weekly chart is most interesting now. Look – we have some contradiction between potential 3-Drive, that theoretically should push market to lower border of channel, and bullish engulfing pattern. Recall, that minimum target of engulfing pattern is a length of the bars. So, if you will count it to upside – that will be around 1.2550-1.26 area and MPR1. If this really will happen, then, take a look at the chart – this could lead to reverse H&S pattern and deeper retracement to 1.30 K-resistance on weekly/monthly time frames.
Another significant thing has changed here – trend has turned bullish, that’s not a stop grabber on weekly chart. So, it seems that our major attention will be on major 5/8 support on daily time frame, because bears will need to break it to return control over market and shift trend to bearish again. But bulls have solid counter argument here – butterfly “Buy”, Bullish engulfing pattern, bull trend as weekly as daily and finally, Fib support on daily chart.

Daily
So, here we finally come to daily time frame. As we’ve said above, our major interest here is upward retracement and major 0.618 support at 1.2195 area. What bulls’ advantages can we see here? First of all, this is upward strong moves. Take a look both move up was fast, by strong white candles and both times it was stop by daily overbought, although this could happened occasionally. Second, take a look at MACD indicator – inside of say, “wedge” pattern we do not see any divergence as by simple MACD as by Histogram (because distance between MACD lines is greater at second top inside the wedge). That is not typical for reversal pattern.
What about bears? Market stands below monthly pivot point. Current WPP stands almost in the same range. Also take a look WPS1 will add support to major Fib level. Well, may be you will not agree, but looks like bulls position look preferable, at least buyers still should have some power for another one push up. Speaking about potential targets, it could be as AB=CD from initial swings as most recent AB=CD, if we suggest that current move down is BC leg. In this case market could reach as 1.25 area as 1.2565. Although latter one is more close to weekly number – it is beyond overbought currently, so let’s orient first at former. Even move to 1.25 will not be bad, right?

4-hour
Trend here is bearish. On previous week we chewing this area and said that this is nice level to enter long, since its breakout will put under question bullish perspectives. This moment is easy to explain. Usually market could show deep pullbacks either from significant resistance areas or after reaching significant target. Here we do see neither former nor latter. Current pullback could be justified only by overbought condition. That’s why move lower could be looked as suspicious. Right at current level we also have to different expansion targets - AB=CD that I’ve drawn and 1.618 from AB-CD on top. So, that is also an Agreement. This level should hold, if bulls are still in charge.
On Friday we agreed to look for reversal patterns here and if we will see any – try to enter long.

15-min
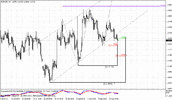
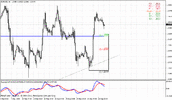
Today we will take a look at 15-min chart, since it better shows neccesary information. So, we have everything – bullish trends on higher time frames, strong support at 4-hour chart and reversal pattern right at this level on 15 min chart. Hence, it will be easier to judge about bulls’ failure. So, market has formed Butterfly “buy” – that was our possible scenario for yesterday. If you again have skept this entry, here is another chance. Market has shown solid swing up, that is greater than previous swing down. That is short-term reversal price action. Usually when market shows such reversals after long bear trend, it shows deep retracement. Rule of thumb is to buy first AB-CD retracement after reversal swing. This will give us an Agreement with 0.618 support at 1.2270-1.2275 area. Stop should placed below butterfly’s low. If all this stuff will fail and market will break it down – be ready for revolutionary regime change – bears could return control over the market.
P.S. Take a look at excellent evening star pattern...

Conclusion:
Long-term bearish sentiment is still in play. At the same time situation on weekly chart looks dubiously. If bulls will push market to 1.26 area – this could lead for further continuation to 1.30. If not, and price will break 1.2190 support area, then downward move will be more probable in a row with potential weekly 3-Drive “Buy” pattern. So, we can say that current week is important for medium term perspective.
In shorter-term frame market has done everything for upward continuation: weekly and daily trends are bullish, market stands at intraday K-support, no divergence and has formed reversal pattern at 15-min chart. That gives us nice foundation and easy possibility to catch bullish failure. If this construction will fail, then, I suppose, that it will put start for downward scenario. If you still would like to take part in upward action (if it will happen at all) – look for 1.2270 as potential entry level.
The technical portion of Sive's analysis owes a great deal to Joe DiNapoli's methods, and uses a number of Joe's proprietary indicators. Please note that Sive's analysis is his own view of the market and is not endorsed by Joe DiNapoli or any related companies.
