NPBFX - making money with us since 1996!

AUD/USD: general analysis 13.07.2018

Good afternoon, dear forum visitors!

NPBFX offers the latest release of analytics on the AUD/USD for a better understanding of the current market situation and more efficient trading.

Current trend

Yesterday, the AUD/USD pair strengthened due to the news that China and the US could negotiate to resolve controversial trade issues.

The intention of Washington and Beijing to find a compromise is a good sign for Australian exporters since China is Australia's main trading partner. However, the fall in commodity prices has a negative impact on AUD. In addition, the recent US CPI correspond to the "hawkish" mood of the Fed and restrain the growth of the pair.

Today at 17:00 (GMT+2) Fed Monetary Policy Report will be published. Given the positive inflationary dynamics and positive data on a number of key macroeconomic indicators, investors expect the pair to fall on the last trading day of the current week.

Support and resistance

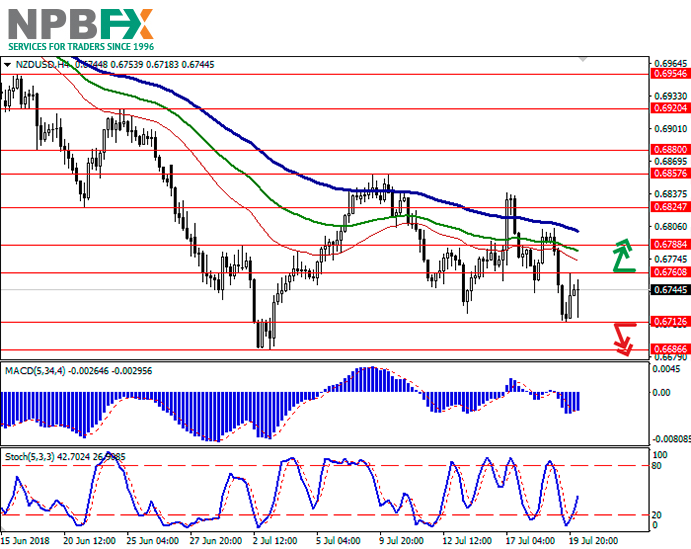
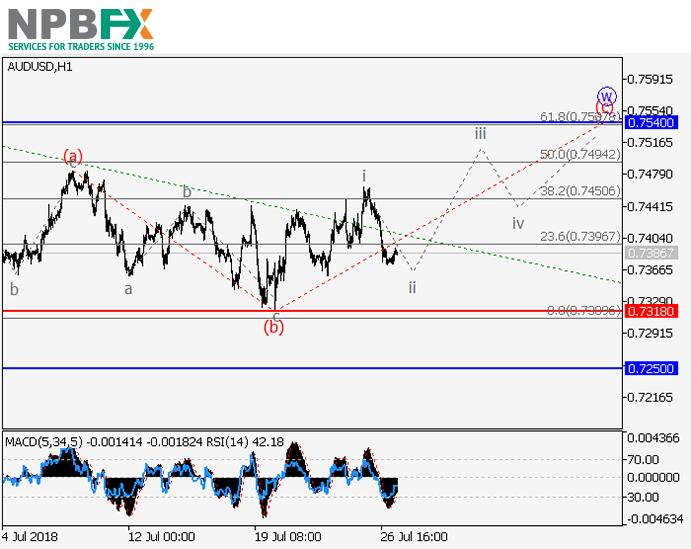
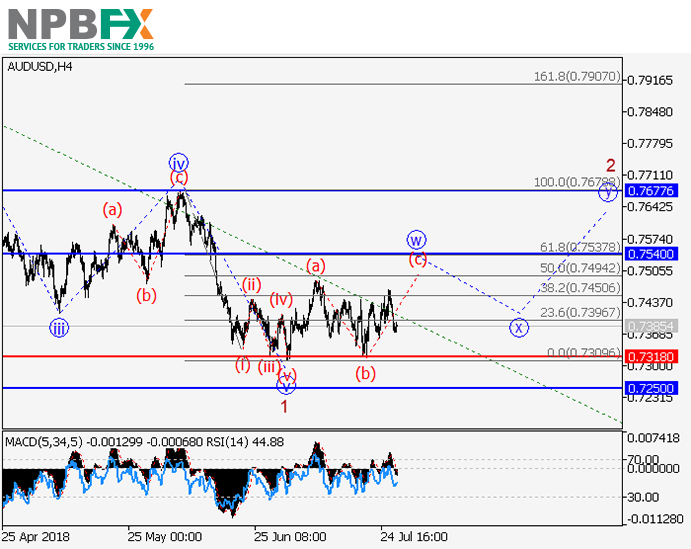
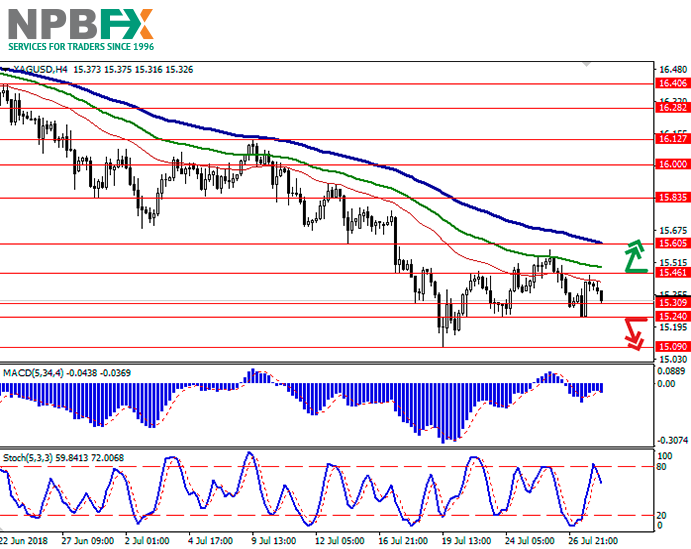
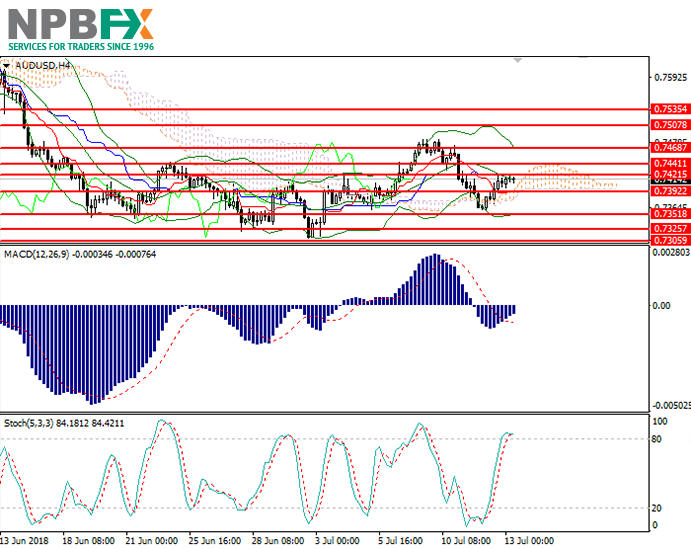
On the 4-hour chart, the pair tries to consolidate above the middle line of Bollinger bands. The indicator is turned sideways, the price range is unchanged, which reflects the development of the upward trend correction. MACD histogram is in the negative area, holding a weak sell signal. Stochastic has entered the overbought area, a strong sell signal can be formed in the next few hours.

Resistance levels: 0.7421, 0.7441, 0.7468, 0.7507, 0.7535.

Support levels: 0.7305, 0.7325, 0.7351, 0.7392.

aud13072018.png


Trading tips

Long positions can be opened above the level of 0.7425 with the targets at 0.7485, 0.7510 and stop loss 0.7390.
Short positions can be opened below the level of 0.7385 with the target at 0.7345 and stop loss 0.7405.

Implementation period: 1–2 days.

Use more opportunities of the NPBFX analytical portal: trading signals

Make right trade decisions on sell or buy AUD/USD and other popular instruments using trading signals on the NPBFX portal. All registered users have free access to signals from the top 10 trading indicators (MA10, BBands, Ichimoku, Stochastic, ZigZag, etc.) with also general recommendations on the portal.

If you have any questions about trading instruments, you can always ask an analyst in the online chat on the portal and get a free consultation of an experienced specialist.

Use the current recommendations of analysts on AUD/USD and trade efficiently with NPBFX.
 
USD/CHF: wave analysis 16.07.2018

Good afternoon, dear forum visitors!

NPBFX offers the latest release of analytics on the USD/CHF for a better understanding of the current market situation and more efficient trading.

Current trend

The pair can grow.

On the 4-hour chart, the upward momentum is developing as a first wave of the higher level 1 of (3). Now the fifth wave v of 1 is developing, within which the wave (iii) of v of the lower level is developing as a momentum. If the assumption is correct, the pair will grow to the levels of 1.0100–1.0190. The level of 0.9945 is critical and stop-loss for this scenario.

chf16072018.png


chf16072018-1.png


Main scenario

Long positions will become relevant during the correction, above the level of 0.9945 with the targets at 1.0100–1.0190. Implementation period: 5–7 days.

Alternative scenario

The breakdown and the consolidation of the price below the level of 0.9945 will let the pair go down to the levels of 0.9819–0.9745.


Use more opportunities of the NPBFX analytical portal: trading signals

Make right trade decisions on sell or buy USD/CHF and other popular instruments using trading signals on the NPBFX portal. All registered users have free access to signals from the top 10 trading indicators (MA10, BBands, Ichimoku, Stochastic, ZigZag, etc.) with also general recommendations on the portal.

If you have any questions about trading instruments, you can always ask an analyst in the online chat on the portal and get a free consultation of an experienced specialist.

Use the current recommendations of analysts on USD/CHF and trade efficiently with NPBFX.
 
Last edited:
EUR/USD: euro falls again 18.07.2018

Good afternoon, dear forum visitors!

NPBFX offers the latest release of analytics on the EUR/USD for a better understanding of the current market situation and more efficient trading.

Current trend

Yesterday, EUR fell against USD, stepping off the renewed highs since July 11.

Yesterday, the International Monetary Fund has published a forecast on the growth of the economy of the leading countries. In the current year, the EU's GDP may grow by 2.2% instead of previously expected 2.4% due to growing world trade tension and Brexit uncertainty. However, the EU leadership is trying to develop mutually beneficial free trade: on Monday, a major corresponding agreement between the EU and Japan was signed. According to the document, which should enter into force in March 2019, Japan should abolish duties on 94% of goods produced in the EU, and the European Union – similar duties for 99% of Japanese goods.

On Wednesday, June EU inflation data will be published. MoM indicators are expected to decrease significantly: the Consumer Price Index – from 0.5% to 0.1%, and the Base Consumer Price Index – from 0.3% to 0.1%. YoY values will remain unchanged. CPI will be 2.0%, and the Base CPI – 1.0%.

Support and resistance

On the daily chart Bollinger bands move flat. The price range tries to consolidate. MACD decreases, keeping a sell signal (the histogram is below the signal line). Stochastic unfolds down after a brief growth, reacting to the "bearish" Tuesday’s trade.

It is better to open short positions in the short and/or ultra-short term.

Resistance levels: 1.1689, 1.1718, 1.1743, 1.1800.
Support levels: 1.1647, 1.1600, 1.1541, 1.1500.

eur18072018.png


eur18072018-1.png


Trading tips

Long positions can be opened after a rebound from 1.1647 and breakout of 1.1670–1.1689 with the targets at 1.1743–1.1750 or 1.1775–1.1800. Implementation period: 2–3 days.

Short positions can be opened after the breakdown of the level of 1.1647 with the target of 1.1600 or 1.1575 and stop loss 1.1689. Implementation period: 1–2 days.

Use more opportunities of the NPBFX analytical portal: analytics

You can find more actual analytical reviews on other popular currency pairs, metals and CFDs on the NPBFX online portal. Daily analytics with charts, current market prognoses and trading scenarios in the Feed section are available. Get free and unlimited access to the online portal after registering on the official website of NPBFX Company.

If you have any questions about trading instruments, you can always ask an analyst in the online chat on the portal and get a free consultation of an experienced specialist.

Use the current recommendations of analysts on EUR/USD and trade efficiently with NPBFX.
 
NZD/USD: the pair shows ambiguous dynamics 20.07.2018

Good afternoon, dear forum visitors!

NPBFX offers the latest release of analytics on the NZD/USD for a better understanding of the current market situation and more efficient trading.

Current trend

NZD declined against USD on Thursday, returning to local lows of the beginning of the week.

USD was supported by Fed Chairman Jerome Powell, who spoke on Wednesday at the Financial Services Committee of the House of Representatives of the US Congress, and by the Beige Book data. Powell noted that now the balance of the Fed reaches 4.5 trillion dollars, however, the program of bonds redemption proved its effectiveness, and there is no reason to drastically reduce the purchase yet. The process of normalizing the balance can take up to four years. As for the key US economic problems, he named the growth rates of public debt, exceeding the growth of GDP. In general, investors remain confident that the US regulator will raise interest rates this year two more times.

Published on Wednesday evening, Fed's Beige Book reflected a moderate economic growth in 10 of the 12 US regions, which gave investors the hope of continued sustainable economic growth in the US, even in the face of growing trade disputes.

Support and resistance

Bollinger Bands in D1 chart grow insignificantly. The price range narrows, reflecting ambiguous trading dynamics. MACD reverses downwards forming a new sell signal (located below the signal line). Stochastic reversed downwards after an increase earlier this week.

Current technical indicators remain uninformative. One should wait for clarification of the situation.

Resistance levels: 0.6760, 0.6788, 0.6824, 0.6857.
Support levels: 0.6712, 0.6686, 0.6650.

nzd20072018.png


nzd20072018-1.png


Trading tips

To open long positions, one can rely on the breakout of 0.6760. Take profit — 0.6824 or 0.6857, 0.6880. Stop loss — 0.6720.

The return of "bearish" trend with the breakdown of 0.6712 or 0.6700 may become a signal for new sales with the target at 0.6650. Stop loss — 0.6730 or 0.6740.

Implementation period: 2-3 days.

Use more opportunities of the NPBFX analytical portal: weekly FOREX forecast

You can learn more about the current situation and get acquainted with the weekly analytical forecast for NZD/USD in the "Video reviews" section on the NPBFX portal. Also weekly video reviews contain trends, key levels, trading recommendations for such popular instruments as EUR/USD, GBP/USD, USD/JPY, AUD/USD, Gold. In order to get free and unlimited access to video forecast and other useful instruments on the portal, you need to register on the NPBFX website.

In order to get unlimited access to the Weekly FOREX forecast and other useful instruments on the portal, you need to register on the NPBFX website.

If you have any questions about trading instruments, you can always ask an analyst in the online chat on the portal and get a free consultation of an experienced specialist.

Use the current recommendations of analysts on NZD/USD and trade efficiently with NPBFX.
 
USD/CAD: wave analysis 23.07.2018

Good afternoon, dear forum visitors!

NPBFX offers the latest release of analytics on the USD/CAD for a better understanding of the current market situation and more efficient trading.

Current trend

The pair is in a correction, the fall is possible.

On the 4-hour chart, the fifth wave of the higher level v of 1 is developing. Now the local correction is forming as a fourth wave (iv) of v, within which the wave c of (iv) is developing. If the assumption is correct, the pair will fall to the level of 1.2987. The level of 1.3291 is critical and stop loss for this scenario.

usdcad23072018.png


usdcad23072018-1.png


Main scenario

Short positions will become relevant during the correction, below the level of 1.3291 with the target at 1.2987. Implementation period: 5–7 days.

Alternative scenario

The breakout and the consolidation of the price above the level of 1.3291 will let the pair grow to the levels of 1.3500–1.3600.

Use more opportunities of the NPBFX analytical portal: E-book

If you just recently started to be interested in trading on FOREX and would like to deepen your knowledge, an electronic Beginner's Guide to FOREX Trading will be an excellent helper for you here. The book consists of 5 chapters and reflects fundamental concepts of the foreign exchange market to start successful trading. From the main chapters of the E-book you can learn about the concepts and history of FOREX, currencies and trend lines, technical indicators, types of orders, trading on news, psychology of trading, risk management and much more.

You can read a Beginner's guide to FOREX Trading online or download it free of charge from the NPBFX analytical portal in the "Education" section. In order to get unlimited access to the E-book and other useful instruments on the portal, you need to register on the NPBFX website.

If you have any questions about trading instruments, you can always ask an analyst in the online chat on the portal and get a free consultation of an experienced specialist.

Use the current recommendations of analysts on USD/CAD and trade efficiently with NPBFX.
 
XAU/USD: mixed dynamics 25.07.2018

Good afternoon, dear forum visitors!

NPBFX offers the latest release of analytics on the XAU/USD for a better understanding of the current market situation and more efficient trading.

Current trend

Yesterday, gold price did not change much due to the mixed dynamics of the US currency, caused by a contradictory fundamental background. The precious metal was moderately supported by the news about China's economic stimulus, as this country remains one of its main importers.

Today, the pair moves horizontally, and investors are waiting for the new drivers on the market. On Wednesday, US June New Homes Sales data will be published. After an increase by 6.7% MoM in the previous month, the indicator can decrease by 2.8% MoM. The main event of the week is Friday's US GDP Annualized release. According to preliminary forecasts, US Q2 economy accelerated from 2% to 4%.

Support and resistance

On the daily chart, Bollinger bands are steadily declining. The price range narrows from below, reflecting mixed trade moods. MACD indicator is growing, keeping a weak buy signal (the histogram is above the signal line). Stochastic reversed horizontally, reacting to Tuesday’s flat.

At the moment, technical indicators do not contradict the development of corrective growth of the instrument in the short term.

Resistance levels: 1230.00, 1237.60, 1245.61, 1250.96.
Support levels: 1220.73, 1215.33, 1211.14, 1200.00.

xauusd25072018.png


xauusd25072018-1.png


Trading tips

Long positions can be opened after the breakout of the level of 1230.00 with the target of 1245.61 and stop loss 1220.73.

Short positions can be opened after the breakdown of the level of 1220.73 or 1215.33 with the target at 1200.00. Stop loss is 1225.00 or 1230.00.

Implementation period: 2–3 days.

Use more opportunities of the NPBFX analytical portal: economic calendar

Be ready for any market changes through global events using the economic calendar on the NPBFX portal. The calendar contains all the most important events of the world economy and prognoses for them. In order to get free and unlimited access to the economic calendar and other useful instruments on the portal, you need to pass a one-time registration on the NPBFX website.

If you have any questions about trading instruments, you can always ask an analyst in the online chat on the portal and get a free consultation of an experienced specialist.

Use the current recommendations of analysts on XAU/USD and trade efficiently with NPBFX.
 
AUD/USD: wave analysis 27.07.2018

Good afternoon, dear forum visitors!

NPBFX offers the latest release of analytics on the AUD/USD for a better understanding of the current market situation and more efficient trading.

Current trend

The pair can grow.

On the 4-hour chart, the downward trend has formed as a first wave 1 of (5) of the higher level, and the development of the upward correction 2 of (5) has begun. Now the wave w of 2 is developing as a flat (a)(b)(c), within which the wave (c) of w is forming. If the assumption is correct, the pair will grow to the level of 0.7540. The level of 0.7318 is critical and stop loss for this scenario.

audusd27072018.png


audusd27072018-1.png


Main scenario

Long positions will become relevant during the correction, above the level of 0.7318 with the target at 0.7540. Implementation period: 7 days and more.

Alternative scenario

The breakdown and the consolidation of the price below the level of 0.7318 will let the pair go down to the level of 0.7250.

Use more opportunities of the NPBFX analytical portal: E-book

If you just recently started to be interested in trading on FOREX and would like to deepen your knowledge, an electronic Beginner's Guide to FOREX Trading will be an excellent helper for you here. The book consists of 5 chapters and reflects fundamental concepts of the foreign exchange market to start successful trading. From the main chapters of the E-book you can learn about the concepts and history of FOREX, currencies and trend lines, technical indicators, types of orders, trading on news, psychology of trading, risk management and much more.

You can read a Beginner's guide to FOREX Trading online or download it free of charge from the NPBFX analytical portal in the "Education" section. In order to get unlimited access to the E-book and other useful instruments on the portal, you need to register on the NPBFX website.

If you have any questions about trading instruments, you can always ask an analyst in the online chat on the portal and get a free consultation of an experienced specialist.

Use the current recommendations of analysts on AUD/USD and trade efficiently with NPBFX.
 
XAG/USD: ambiguous dynamics 30.07.2018

Good afternoon, dear forum visitors!

NPBFX offers the latest release of analytics on the XAG/USD for a better understanding of the current market situation and more efficient trading.

Current trend

On Friday, silver prices rose, as the US dollar did not receive the expected support from published Q2 GDP data. However, further growth of the instrument was prevented by positive news around the process of negotiations between the US and Europe.

The speech of US Treasury Secretary Stephen Mnuchin, published on Sunday, supported USD additionally. He said that the US economy would continue to grow for several years more. In addition, the minister did not focus on the problem of the high exchange rate of the national currency, as President Donald Trump recently did.

Support and resistance

On the daily chart, Bollinger bands are steadily declining. The price range is narrowing, reflecting a rather sharp change in the trade direction in the medium term. MACD grows, keeping a weak buy signal (the histogram is above the signal line). Stochastic did not react to the emergence of "bullish" dynamics at the end of the last trading week and is still directed downward, rapidly approaching its lows.

It is better to wait until the situation is clear and keep some of the short positions in the short and medium term for some time.

Resistance levels: 15.46, 15.60, 15.83, 16.00.

Support levels: 15.30, 15.24, 15.09.

30071.png


30072.png


Trading tips

Long positions can be opened after the breakdown of the level of 15.46 with the targets at 15.75–15.83 and stop loss 15.30. Implementation period: 2–3 days.

Short positions can be opened after a breakdown of the level of 15.24 with targets of 15.09–15.00 and stop loss 15.30. Implementation period: 1–2 days.

Use more opportunities of the NPBFX analytical portal: analytics

You can find more actual analytical reviews on other popular currency pairs, metals and CFDs on the NPBFX online portal. Daily analytics with charts, current market prognoses and trading scenarios in the Feed section are available. Get free and unlimited access to the online portal after registering on the official website of NPBFX Company.
If you have any questions about trading instruments, you can always ask an analyst in the online chat on the portal and get a free consultation of an experienced specialist.

Use the current recommendations of analysts on XAG/USD and trade efficiently with NPBFX.
 
USD/CHF: wave analysis 01.08.2018

Good afternoon, dear forum visitors!

NPBFX offers the latest release of analytics on the USD/CHF for a better understanding of the current market situation and more efficient trading.

Current trend

The pair can grow.

On the 4-hour chart, the fifth wave v of 1 is developing as a diagonal triangle. Now the local correction (iv) of v has formed. If the assumption is correct, the development of the wave (v) of v begins, within which the pair will grow to the levels of 1.0070–1.0115. The level of 0.9865 is critical and stop-loss for this scenario.

0108e.png


0108ef.png


Main scenario

Long positions will become relevant during the correction, above the level of 0.9865 with the targets at 1.0070–1.0115. Implementation period: 5–7 days.

Alternative scenario

The breakdown and the consolidation of the price below the level of 0.9865 will let the pair go down to the levels of 0.9745–0.9670.

Use more opportunities of the NPBFX analytical portal: economic indicators

Regular monitoring of global economic indicators plays an important role in trading, because of their strong influence on FOREX market and possibility to provoke significant price fluctuations. For the convenience of traders the "Education" section on the NPBFX portal contains the most popular and significant world economic indices with a detailed description, their possible impact on the economy and exchange rates (GDP, consumer price index, unemployment rate, Nonfarm Payrolls (NFP), etc.).

If you have any questions about trading instruments, you can always ask an analyst in the online chat on the portal and get a free consultation of an experienced specialist.

Use the current recommendations of analysts on USD/CHF and trade efficiently with NPBFX.
 
USD/CAD: wave analysis 03.08.2018

Good afternoon, dear forum visitors!

NPBFX offers the latest release of analytics on the USD/CAD for a better understanding of the current market situation and more efficient trading.

Current trend

The pair can grow.

On the 4-hour chart, the fifth wave of the higher level v of 1 develops. Now the local correction has formed as a fourth wave (iv) of v. If the assumption is correct, the pair may grow to the level of 1.3500 within the wave (v) of v. The level of 1.2970 is critical and stop-loss for this scenario.

03081.png


0308ef.png


Main scenario

Long positions will become relevant above the level of 1.2970 with the target at 1.3500. Implementation period: 5–7 days.

Alternative scenario

The breakdown and the consolidation of the price below the level of 1.2970 will let the pair go down to the level of 1.2740.

Use more opportunities of the NPBFX analytical portal: analytics

You can find more actual analytical reviews on other popular currency pairs, metals and CFDs on the NPBFX online portal. Daily analytics with charts, current market prognoses and trading scenarios in the Feed section are available. Get free and unlimited access to the online portal after registering on the official website of NPBFX Company.

If you have any questions about trading instruments, you can always ask an analyst in the online chat on the portal and get a free consultation of an experienced specialist.

Use the current recommendations of analysts on USD/CAD and trade efficiently with NPBFX.
 
Back
Top