Sive Morten
Special Consultant to the FPA
- Messages
- 18,644
Fundamentals
Last week, slowly but stubbornly EUR has broken bearish sentiment and turned north, at least on short-term picture. I have suspicion that this story will not finish simply. Depending on what we will see next week, EUR could appoint more extended upside targets.
Meantime, as Reuters reports - The dollar fell broadly on Friday in the wake of cautious comments from two U.S. Federal Reserve officials about global economic growth, while sterling rose following losses tied to fears about a Brexit deal.
The greenback fell to one-week lows versus the euro and a two-week trough against the yen following comments from Fed Vice Chair Richard Clarida, who told CNBC television he saw some evidence that global growth was cooling.
Clarida also noted key U.S. short-term borrowing rates are close to neutral and said being at neutral “makes sense.”
Traders perceived his comments to mean the No. 2 Fed official may be open for the Fed to pause its rate-hike campaign sooner than previously thought.
“You have seen a dovish tilt from some Fed officials. That put pressure on the dollar,” said Chuck Tomes, senior investment analyst at Manulife Asset Management in Boston.
Separately, Dallas Federal Reserve President Robert Kaplan said on Fox Business that global growth will be a bit of a headwind, which may spread to the United States.
Chicago Fed President Charles Evans acknowledged some economic risks ahead but he also raised the probability the Fed could raise rates above what would be neutral if U.S. data come in stronger than forecast.
The pound briefly recovered against the euro following its worst day versus the single currency in about 25 months, as U.K. Prime Minister Theresa May clinched backing from some key Brexit supporters with her draft plan for Britain to leave the European Union in March.
A string of cabinet ministers quit on Thursday in protest over the terms in May’s Brexit proposal. The resignations sent the pound reeling.
The euro was also bolstered by hopes that Italian Prime Minister Giuseppe Conte was looking to work with the EU over his government’s 2019 budget, which has been rejected by Brussels.
Meanwhile, currency traders are monitoring signs that Washington and Beijing are seeking to de-escalate their trade dispute.
U.S. President Trump said he might not impose more tariffs on Chinese imports if China comes up with terms that he and Beijing could agree on.
It seems that Fed officials speech has made sense. Indeed, investors chilled their expectations on rate increase in December once again. Now they stand slightly above 60% while last week it was near 80%:

Source: cmegroup.com
COT report brings nothing drastic, open interest mostly has not changed while net short speculation position slightly has dropped. At the same time hedgers increased longs a bit. Sentiment mostly stands neutral this week and it means that market will be driven by technical factors, events and statistics releases. The fact that we do not see any big shifts in positions means that no major trend shift has happened yet. Thus, investors keep what they have now.


Source: cftc.gov
Charting by Investing.com
We do not have very important statistics next week. On Thursday - ECB minutes will be published.
Here is interesting view on relation of UK weather and GDP growth by Fathom consulting:
Data published last week showed that the UK economy expanded by 0.6% in the third quarter. The quarterly series, which stretches back to 1955, suggests a marked pickup in growth through 2018. However, the monthly series, which has been published since the summer of this year, is able to shed more light on the picture. It shows that, although growth was strong in July, output was broadly unchanged through August and September. Analysis carried out by Fathom suggests that unusual weather patterns have a significant impact on UK economic activity. Specifically, when the weather is unseasonably warm, growth tends to be strong, and when the weather is unseasonably cold the converse holds true. In our judgement, the apparent pickup in growth through 2018 is almost entirely a consequence of weather patterns. After a slightly colder-than-usual start, the UK experienced unseasonably warm weather for six months in a row. Were the UK to have experienced weather in line with the seasonal norms in each month of this year, we estimate that growth would have been 0.2% in each of the first, second and third quarters. This figure of 0.2% is perhaps closer to an estimate of the underlying pace of UK economic growth so far this year.

So, as fundamental data this week doesn't bring a lot of clarity on situation, it seems that technical factors come on first stage.
Technical analysis
Monthly
As we talked in our previous reports, monthly picture is the one about 1.13 lows. They have very important technical meaning for monthly chart. Now we see that despite recent break of these lows, EUR doesn't move lower but turned up again. Logical question that we have to ask here - could it be W&R. In this case situation could change at 180 degree. Although monthly chart is rather long-term, it needs more time to get confirmation of this idea - EUR needs to move above 1.15 top, but if now we indeed see upside reversal, it will have extreme importance for long-term perspective.
Because, in general, EUR doesn't look strong in recent months. As we've mentioned, EUR - hangs upon 1.14-1.15 support area. After strong drop and spike down - no meaningful upside action has followed. This is not good sign for bulls. It's already 5 months of laying upon this area. As longer EUR will stand here as greater chances on downside breakout will be.
This is indirect sign of weakness, when market can't jump out from strong support area. It means that strong level could support price from collapse but its effort is not sufficient to start bullish action. Day by day buyers will be washed out around this level and EUR could break it, if nothing will change. So, let's keep this issue in mind. It is not vital by far, but still first warning signs already exist. And now this hypothesis will be checked.
In general 1.14-1.15 is important not just because of YPP. Take a look - this is upper border of former 1.05-1.14 consolidation. If price will drop back inside it - it will open road to the bottom of 1.05 area. Also this is monthly 50% support area. Price has problems with breaking borders of any consolidation, but it has no barriers inside and could freely move from up to bottom.
Now - take a look what progress we have around it. 1.14 lows is the first test of rectangle and monthly support. After small bounce price returns back to it. So, this is the crucial border and now it seems that EUR has very good chances to break it. Once it will happen - free space to YPS1 around 1.08 will be opened. It will mean return back in rectangle. Next our target here will be 1.03 AB-CD COP extension right around major lows, if nothing will change now.
It seems that we will not bore till the end of the year. Don't forget also that trend is bearish on monthly chart...

Weekly
Our target on last week has been hit very fast - on Monday. Market has dropped and completed weekly grabber target. The rest of the week action mostly was to upside. The scale of upside action now is too small still, to make impact on weekly chart. Reversal candle also has not been formed.
The only thing that could suggest more or less definitely here - upside harmonic retracement. Minimum harmonic swing points on 1.1509 area. And the last one - bullish divergence with MACD.

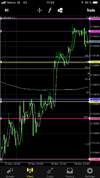
Daily
Daily trend has turned bullish. Upward action shows good pace, but market is coming to very important area - K-resistance and daily Overbought. Daily upside harmonic swing mostly is completed. This area will become very good indicator to understand what to expect. Breaking of this area and action above 1.15 could bring a lot of different bullish scenarios. First of all - this will be upside reversal swing and breaking lower lows-lower highs tendency.
Second - reaching of 1.15 area could become a starting point of reverse H&S pattern as well. This will be key moment that should clarify medium-term perspective on EUR. Right now, while bearish tendency is still valid, this action still has features of retracement.

Intraday
Taking in consideration that market has broken all important resistance levels, including K-resistance and shows nice acceleration right now - it is difficult to keep bearish view. Here we have AB-CD pattern in place. XOP stands slightly above daily K-resistance but still relatively close to it. Market has not bad chances to complete it.
Trading plan for beginning of the week is relatively simple. If you would like to sell - wait for reaching of daily resistance and Overbought area, XOP completion here and keep an eye on bearish reversal patterns on hourly chart.
If you have long positions, probably you could hold them, just tight stops to breakeven at least.
For long entry we will watch for pullback down from daily K-resistance area and see what patterns will be formed. H&S could become nice setup for this purpose, but this will happen later in the week.

Conclusion:
EUR shows the action that could be the sign of sentiment changing on the market. As strong resistance ahead - we're mostly interested in pullback out from it and the way how this pullback will happen and whether any bullish patterns will be formed around.
The technical portion of Sive's analysis owes a great deal to Joe DiNapoli's methods, and uses a number of Joe's proprietary indicators. Please note that Sive's analysis is his own view of the market and is not endorsed by Joe DiNapoli or any related companies.
Last week, slowly but stubbornly EUR has broken bearish sentiment and turned north, at least on short-term picture. I have suspicion that this story will not finish simply. Depending on what we will see next week, EUR could appoint more extended upside targets.
Meantime, as Reuters reports - The dollar fell broadly on Friday in the wake of cautious comments from two U.S. Federal Reserve officials about global economic growth, while sterling rose following losses tied to fears about a Brexit deal.
The greenback fell to one-week lows versus the euro and a two-week trough against the yen following comments from Fed Vice Chair Richard Clarida, who told CNBC television he saw some evidence that global growth was cooling.
Clarida also noted key U.S. short-term borrowing rates are close to neutral and said being at neutral “makes sense.”
Traders perceived his comments to mean the No. 2 Fed official may be open for the Fed to pause its rate-hike campaign sooner than previously thought.
“You have seen a dovish tilt from some Fed officials. That put pressure on the dollar,” said Chuck Tomes, senior investment analyst at Manulife Asset Management in Boston.
Separately, Dallas Federal Reserve President Robert Kaplan said on Fox Business that global growth will be a bit of a headwind, which may spread to the United States.
Chicago Fed President Charles Evans acknowledged some economic risks ahead but he also raised the probability the Fed could raise rates above what would be neutral if U.S. data come in stronger than forecast.
The pound briefly recovered against the euro following its worst day versus the single currency in about 25 months, as U.K. Prime Minister Theresa May clinched backing from some key Brexit supporters with her draft plan for Britain to leave the European Union in March.
A string of cabinet ministers quit on Thursday in protest over the terms in May’s Brexit proposal. The resignations sent the pound reeling.
The euro was also bolstered by hopes that Italian Prime Minister Giuseppe Conte was looking to work with the EU over his government’s 2019 budget, which has been rejected by Brussels.
Meanwhile, currency traders are monitoring signs that Washington and Beijing are seeking to de-escalate their trade dispute.
U.S. President Trump said he might not impose more tariffs on Chinese imports if China comes up with terms that he and Beijing could agree on.
It seems that Fed officials speech has made sense. Indeed, investors chilled their expectations on rate increase in December once again. Now they stand slightly above 60% while last week it was near 80%:
Source: cmegroup.com
COT report brings nothing drastic, open interest mostly has not changed while net short speculation position slightly has dropped. At the same time hedgers increased longs a bit. Sentiment mostly stands neutral this week and it means that market will be driven by technical factors, events and statistics releases. The fact that we do not see any big shifts in positions means that no major trend shift has happened yet. Thus, investors keep what they have now.
Source: cftc.gov
Charting by Investing.com
We do not have very important statistics next week. On Thursday - ECB minutes will be published.
Here is interesting view on relation of UK weather and GDP growth by Fathom consulting:
Data published last week showed that the UK economy expanded by 0.6% in the third quarter. The quarterly series, which stretches back to 1955, suggests a marked pickup in growth through 2018. However, the monthly series, which has been published since the summer of this year, is able to shed more light on the picture. It shows that, although growth was strong in July, output was broadly unchanged through August and September. Analysis carried out by Fathom suggests that unusual weather patterns have a significant impact on UK economic activity. Specifically, when the weather is unseasonably warm, growth tends to be strong, and when the weather is unseasonably cold the converse holds true. In our judgement, the apparent pickup in growth through 2018 is almost entirely a consequence of weather patterns. After a slightly colder-than-usual start, the UK experienced unseasonably warm weather for six months in a row. Were the UK to have experienced weather in line with the seasonal norms in each month of this year, we estimate that growth would have been 0.2% in each of the first, second and third quarters. This figure of 0.2% is perhaps closer to an estimate of the underlying pace of UK economic growth so far this year.
So, as fundamental data this week doesn't bring a lot of clarity on situation, it seems that technical factors come on first stage.
Technical analysis
Monthly
As we talked in our previous reports, monthly picture is the one about 1.13 lows. They have very important technical meaning for monthly chart. Now we see that despite recent break of these lows, EUR doesn't move lower but turned up again. Logical question that we have to ask here - could it be W&R. In this case situation could change at 180 degree. Although monthly chart is rather long-term, it needs more time to get confirmation of this idea - EUR needs to move above 1.15 top, but if now we indeed see upside reversal, it will have extreme importance for long-term perspective.
Because, in general, EUR doesn't look strong in recent months. As we've mentioned, EUR - hangs upon 1.14-1.15 support area. After strong drop and spike down - no meaningful upside action has followed. This is not good sign for bulls. It's already 5 months of laying upon this area. As longer EUR will stand here as greater chances on downside breakout will be.
This is indirect sign of weakness, when market can't jump out from strong support area. It means that strong level could support price from collapse but its effort is not sufficient to start bullish action. Day by day buyers will be washed out around this level and EUR could break it, if nothing will change. So, let's keep this issue in mind. It is not vital by far, but still first warning signs already exist. And now this hypothesis will be checked.
In general 1.14-1.15 is important not just because of YPP. Take a look - this is upper border of former 1.05-1.14 consolidation. If price will drop back inside it - it will open road to the bottom of 1.05 area. Also this is monthly 50% support area. Price has problems with breaking borders of any consolidation, but it has no barriers inside and could freely move from up to bottom.
Now - take a look what progress we have around it. 1.14 lows is the first test of rectangle and monthly support. After small bounce price returns back to it. So, this is the crucial border and now it seems that EUR has very good chances to break it. Once it will happen - free space to YPS1 around 1.08 will be opened. It will mean return back in rectangle. Next our target here will be 1.03 AB-CD COP extension right around major lows, if nothing will change now.
It seems that we will not bore till the end of the year. Don't forget also that trend is bearish on monthly chart...
Weekly
Our target on last week has been hit very fast - on Monday. Market has dropped and completed weekly grabber target. The rest of the week action mostly was to upside. The scale of upside action now is too small still, to make impact on weekly chart. Reversal candle also has not been formed.
The only thing that could suggest more or less definitely here - upside harmonic retracement. Minimum harmonic swing points on 1.1509 area. And the last one - bullish divergence with MACD.
Daily
Daily trend has turned bullish. Upward action shows good pace, but market is coming to very important area - K-resistance and daily Overbought. Daily upside harmonic swing mostly is completed. This area will become very good indicator to understand what to expect. Breaking of this area and action above 1.15 could bring a lot of different bullish scenarios. First of all - this will be upside reversal swing and breaking lower lows-lower highs tendency.
Second - reaching of 1.15 area could become a starting point of reverse H&S pattern as well. This will be key moment that should clarify medium-term perspective on EUR. Right now, while bearish tendency is still valid, this action still has features of retracement.
Intraday
Taking in consideration that market has broken all important resistance levels, including K-resistance and shows nice acceleration right now - it is difficult to keep bearish view. Here we have AB-CD pattern in place. XOP stands slightly above daily K-resistance but still relatively close to it. Market has not bad chances to complete it.
Trading plan for beginning of the week is relatively simple. If you would like to sell - wait for reaching of daily resistance and Overbought area, XOP completion here and keep an eye on bearish reversal patterns on hourly chart.
If you have long positions, probably you could hold them, just tight stops to breakeven at least.
For long entry we will watch for pullback down from daily K-resistance area and see what patterns will be formed. H&S could become nice setup for this purpose, but this will happen later in the week.
Conclusion:
EUR shows the action that could be the sign of sentiment changing on the market. As strong resistance ahead - we're mostly interested in pullback out from it and the way how this pullback will happen and whether any bullish patterns will be formed around.
The technical portion of Sive's analysis owes a great deal to Joe DiNapoli's methods, and uses a number of Joe's proprietary indicators. Please note that Sive's analysis is his own view of the market and is not endorsed by Joe DiNapoli or any related companies.
 . I was targeting 1.1313. Lets see If there will be a new opportunity tomorrow...