Tifia Forex Broker Daily Market Analytics, Analytics and trading recommendations by Tifia Company

GBP/USD: Brexit theme is in the foreground

02/19/2019

Current dynamics


The data presented on Tuesday by the National Bureau of Statistics of the United Kingdom, which generally coincided with the forecast, indicated an increase in the average wage in the country from October to December (excluding bonuses by 3.4%) and a decrease in the number of unemployed.

Unemployment remained at 4%, the lowest in four decades, the number of unemployed in the UK from October to December declined by 14,000 compared with the previous three-month period. The growth rate of wages far exceeds inflation, which in January was 1.8%.

However, the Bank of England is unlikely to take any action regarding monetary policy, given the uncertainty about the prospects for Brexit.

The economic performance of the UK is still in the background, as market participants expect clarification of prospects for Brexit.

The British pound almost did not respond to strong data on the UK labor market, indicating an increase in average wages and a decrease in the number of unemployed.

Now market participants will expect the results of the voting next week in the British Parliament regarding Brexit. If British Prime Minister Theresa May is defeated again, the pound will again be under pressure. If there is no agreement between the EU and the UK regarding trade relations after March 29 (the UK’s exit date), then a "hard" Brexit, as Bank of England CEO Mark Carney stated earlier, will be a disaster for the British economy. This may not happen in reality; however, a significant blow will be dealt to the pound in the foreign exchange market.

*)An advanced fundamental analysis is available on the Tifia Forex Broker website at tifia.com/analytics


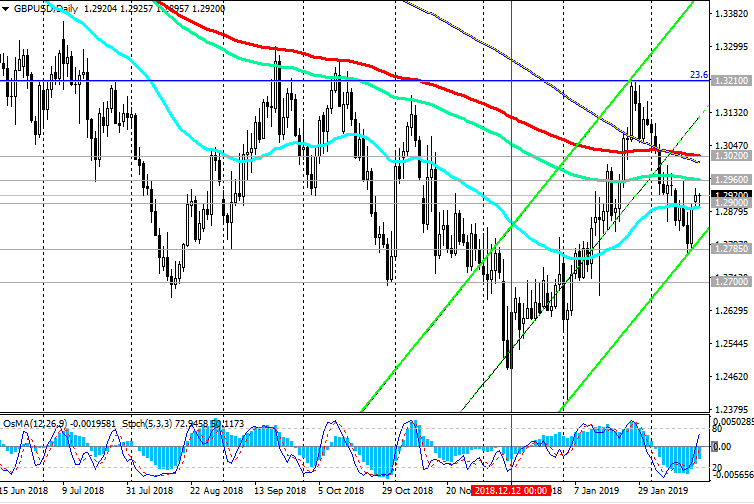
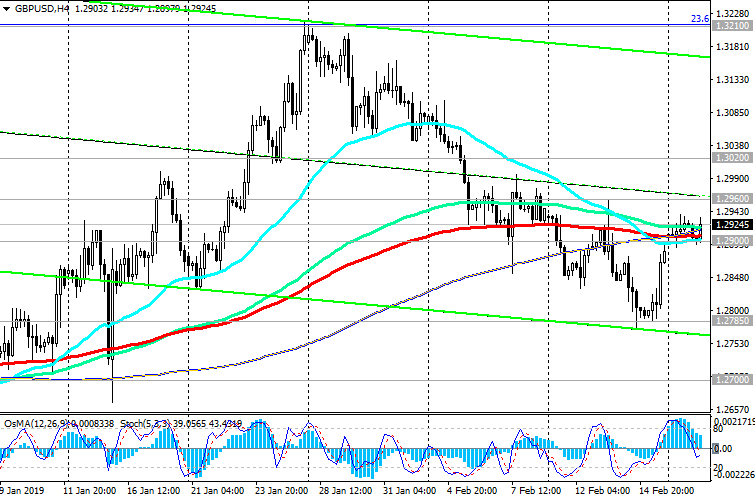
For now, the GBP / USD remains within the narrow range between the support level of 1.2900 (ЕМА200 on the 1-hour chart, ЕМА200 on the 4-hour chart, ЕМА50 on the daily chart) and the resistance level of 1.2960 (ЕМА144 on the daily chart).

So far, more likely resumption of decline. In the event of a breakdown of the support level of 1.2700, the targets for the decline will be the support levels of 1.2600 (lows of June 2017), 1.2485, 1.2365.

Support Levels: 1.2900, 1.2800, 1.2785, 1.2700, 1.2670, 1.2600, 1.2485, 1.2365, 1.2110, 1.2000

Resistance Levels: 1.2960, 1.3020, 1.3065, 1.3125, 1.3210


Trading scenarios


Sell Stop 1.2890. Stop Loss 1.2970. Take-Profit 1.2800, 1.2785, 1.2700, 1.2670, 1.2600, 1.2485, 1.2365

Buy Stop 1.2970. Stop Loss 1.2890. Take-Profit 1.3020, 1.3065, 1.3125, 1.3210

190219-GU-D.png


190219-GU-H4.png


*) For up-to-date and detailed analytics and news on the forex market visit Tifia Forex Broker website tifia.com
 
AUD/USD: on the eve of the publication of the minutes from the January Fed meeting

20/02/2019


The focus of traders on Wednesday will be the publication (19:00 GMT) of the minutes from the January Fed meeting. Earlier in the week, New York Fed President John Williams said he did not see the need to raise interest rates if growth or inflation rates did not change.

Fed Chairman Jerome Powell, after the January meeting of the Fed, also spoke more restrained about the prospects for further monetary tightening, saying that "the policy is not predetermined. We (at the Fed) will pay close attention to incoming economic and financial data".

If the texts of the protocols are also soft in content and rhetoric of statements by the Fed leaders, this will have a stimulating effect on the US stock markets.

The dollar is likely to react with more restraint to the publication of the protocols, since market participants are unlikely to find something new for themselves in them.

Recently, there has been a restrained approach on the part of the leaders of world central banks with regard to the monetary policy of their banks.

The decisive role in these conditions for the dynamics of the US dollar will be played by macro statistics coming from the United States.

In the context of world trade wars, the American economy looks more stable, which will attract investment in it and will support the demand for the dollar in the long term.

For traders who trade AUD and AUD / USD, pay attention to the publication at 00:30 (GMT) on Thursday of data from the Australian labor market.

As expected, in January, the number of employed Australian citizens increased by 15,000 people (against +21600 in December), while unemployment remained unchanged at 5%. In general, the indicators can be called positive. Data better than forecast will strengthen AUD.

On Wednesday, the Australian Finance Minister said that “risks (for the Australian economy) are increasing both domestically and abroad”, although, in his opinion, “the labor market remains strong”, and “will eventually support wage growth”.

*)An advanced fundamental analysis is available on the Tifia Forex Broker website at tifia.com/analytics


Meanwhile, AUD / USD is trading on Wednesday at the 0.7150 balance line (ЕМА50 on the daily chart, ЕМА200 on the 4-hour chart), which is also in the middle of the range between the levels of 0.7055 (February lows) and 0.7225 (ЕМА144 on the daily chart).

In case of breakdown of the local resistance level of 0.7180, AUD / USD will go to the upper part of the specified range and to resistance levels of 0.7225, 0.7275 (ЕМА200 on the daily chart). Growth above the resistance level of 0.7275 is unlikely.

The breakdown of the short-term support level of 0.7130 (ЕМА200 on the 1-hour chart) will be a signal to resume sales with targets at the support levels of 0.6910 (lows of September 2015), 0.6830 (2016 lows).

Support Levels: 0.7150, 0.7130, 0.7100, 0.7085, 0.7055, 0.7025

Resistance Levels: 0.7225, 0.7275


Trading recommendations


Sell Stop 0.7120. Stop Loss 0.7180. Take-Profit 0.7100, 0.7085, 0.7025, 0.6910, 0.6830

Buy Stop 0.7180. Stop Loss 0.7120. Take-Profit 0.7225, 0.7245, 0.7275

200219-AU-D.png


200219-AU-H4.png


*) For up-to-date and detailed analytics and news on the forex market visit Tifia Forex Broker website tifia.com
 
EUR/USD: breakdown of the range is expected

02/21/2019


Euro sluggishly reacted to the publication at the beginning of the European session on Thursday of the purchasing managers' indices (PMI) for the manufacturing sector in Germany (according to IHS Markit) and the services sector. In February, the PMI for the manufacturing sector fell to 47.6 (the forecast was 49.7), which was the lowest level in more than six years.

The composite PMI index of the Eurozone in February came out with a value of 51.4 (the forecast was 51.1 and 51.0 in January).

*)An advanced fundamental analysis is available on the Tifia Forex Broker website at tifia.com/analytics


The EUR / USD pair for the second day continues to trade in the range between the levels of 1.1325 (ЕМА200 on the 1-hour chart) and 1.1365 (ЕМА200 on the 4-hour chart).

A breakthrough in one direction or another will determine the further dynamics of EUR / USD.

The growth targets in case of continuation of the upward correction will be the resistance levels of 1.1471 (ЕМА144 and the upper limit of the downward channel on the daily chart), 1.1522 (ЕМА200 on the daily chart). Below these levels, there is a long-term bearish trend that began in May 2014 near the 1.3870 mark.

In case of breakdown of the support level of 1.1325, the targets for the decline will be the support levels of 1.1270 (December lows), 1.1215 (November and year lows), 1.1200, 1.1000 (the lower line of the downward channel on the weekly chart).

Short positions are preferred.

Support Levels: 1.1325, 1.1300, 1.1285, 1.1215, 1.1120, 1.1000

Resistance Levels: 1.1365, 1.1471, 1.1522


Trading recommendations


Sell Stop 1.1310. Stop-Loss 1.1380. Take-Profit 1.1285, 1.1215, 1.1120, 1.1000

Buy Stop 1.1380. Stop-Loss 1.1310. Take-Profit 1.1471, 1.1522

210219-EU-D.png


210219-EU-H4.png


*) For up-to-date and detailed analytics and news on the forex market visit Tifia Forex Broker website tifia.com
 
WTI: long positions are preferred

02/22/2019


Despite another increase in oil reserves in the US storages, oil prices continue to grow. According to the Energy Information Administration (EIA), the US Department of Energy, oil reserves in storage last week rose by 3.672 million barrels (the forecast was +3.080 million barrels). At the same time, oil production in the United States grew by 100,000 barrels to a record 12 million barrels per day. Thus, oil reserves in the United States rose to 455 million barrels, the highest level since November 17, 2017.

The growth of oil prices contributes to a number of fundamental factors. Among them - the recovery of stock markets, investor optimism regarding the positive outcome of trade negotiations between the US and China, expectations of a further reduction in production at OPEC, increased risks of disruptions in oil supplies from Venezuela.

On Friday, oil market participants will be waiting for the publication (at 18:00 GMT) of a weekly report from the American oilfield service company Baker Hughes on the number of active oil drilling rigs in the United States. Their number increased in the previous week and currently stands at 857 units, although this is below the maximum of 887 units reached at the end of 2018.

At the moment, oil prices are recovering after falling in the 4th quarter of 2018 (oil prices in the end of December hit bottom near the mark of 42.00 dollars per barrel of WTI crude oil). Rising oil prices create an incentive for American oil companies to increase production, which, in turn, is a deterrent to rising oil prices. The increase in the number of drilling rigs is a negative factor for oil prices and creates prerequisites for the subsequent decline in oil prices.

However, in the current situation, positive fundamental factors outweigh the negative ones, which creates prerequisites for a further increase in oil prices.

*)An advanced fundamental analysis is available on the Tifia Forex Broker website at tifia.com/analytics


To date, the price has reached the zone of important levels: resistance level 57.80 (EMA144 on the daily chart, Fibonacci 38.2% of the correction to the growth wave, which began in February 2016 with the support level near the level of 27.30), 59.00 (EMA200 on the daily chart) and support level 56.50 (EMA200 on the weekly chart).

The indicators OsMA and Stochastic on the weekly and daily charts recommend long positions.

Immediate growth targets are resistance levels 57.80, 59.00.

In the case of a breakdown of the short-term support level of 55.50 (ЕМА200 on the 1-hour chart), the price will again go into the downward channel on the daily chart.

This will return WTI oil prices to a bearish trend that began in October, with a target at the 42.20 support level (2017 and 2018 lows).

In the current situation, long positions are preferred.

Support levels: 56.50, 55.50, 53.80, 52.00, 50.25, 49.00, 46.00, 42.20

Resistance Levels: 57.80, 59.00, 60.00


Trading recommendations


Sell Stop 55.40. Stop Loss 57.10. Take-Profit 53.80, 52.00, 50.25, 49.00, 46.00, 42.20

Buy Stop 57.10. Stop Loss 55.40. Take-Profit 57.80, 59.00, 60.00

22021-WTI-W.png


22021-WTI-D.png


22021-WTI-H4.png


*) For up-to-date and detailed analytics and news on the forex market visit Tifia Forex Broker website tifia.com
 
NZD/USD: investors' optimism returned to the markets

02/25/2019


Progress in trade negotiations between the United States and China contributed to the growth of world stock indices and the weakening of the US dollar.

US President Donald Trump tweeted last Sunday that he intends to postpone the increase in fees scheduled for March 1, explaining that to significant progress towards a trade agreement.

The new trade agreement between the two countries will end the trade war and revive investor optimism, pushing global stock markets to accelerate recovery after falling in the 4th quarter.

China's leading stock indexes ended the trading session on Monday at new heights, thanks to optimism about the US-China trade negotiations.

Leading stock indicators of the country on Monday rose by about 5.5%. For the Chinese stock exchanges, this was the best trading day since 2015.

At the same time, the US dollar resumed its decline on Monday, including against the yuan and major commodity currencies, such as Canadian, Australian, New Zealand dollars.

The pair NZD / USD was trading at the beginning of the European session near the level of 0.6890, which is 0.5% higher than the closing price of the previous week (at the level of 0.6842).

The data, which indicated the growth of retail sales in New Zealand in the 4th quarter compared to the 3rd quarter (by 1.7% while the growth forecast was +0.5% and +0.3% in the previous quarter), also contributed the growth of the New Zealand dollar. This positive information was published at the beginning of the trading day on Monday.

On Tuesday and Wednesday, Fed Chairman Jerome Powell will give a speech in the US Congress. If he shows a tendency toward a softer monetary policy, the US dollar will continue to decline, including against the NZD.

*)An advanced fundamental analysis is available on the Tifia Forex Broker website at tifia.com/analytics


Meanwhile, NZD / USD is developing a positive trend above key support levels of 0.6860 (Fibonacci level 23.6% of the upward correction to the global wave of the pair's decline from the level of 0.8800, started in July 2014; wave minima are near the level of 0.6260), 0.6815 (ЕМА200 on daily chart). Growth targets are resistance levels of 0.6970 (December highs and EMA144 on the weekly chart), 0.7070 (EMA200 on the weekly chart).

So far, positive dynamics prevail. Above the support level of 0.6815 long positions are preferable.

Support Levels: 0.6860, 0.6815, 0.6785, 0.6745, 0.6710, 0.6655, 0.6515, 0.6430

Resistance Levels: 0.6900, 0.6970, 0.7070


Trading recommendations


Sell Stop 0.6850. Stop-Loss 0.6910. Take-Profit 0.6815, 0.6785, 0.6745, 0.6710, 0.6655, 0.6515, 0.6430

Buy Stop 0.6910. Stop Loss 0.6850. Take-Profit 0.6970, 0.7070

250219-NU-W.png


250219-NU-D.png


*) For up-to-date and detailed analytics and news on the forex market visit Tifia Forex Broker website tifia.com
 
EUR/USD: dollar is under pressure

26/02/2019


The dollar continues to decline on Tuesday, while DXY dollar index futures have been trading down for the third consecutive day. The pressure on the dollar have expectations of an early conclusion of a trade agreement between the United States and China. As you know, over the weekend, trade negotiations between the US and China ended. US President Donald Trump on his Twitter wrote that he had made “significant progress” on a number of issues, and he could postpone the increase in import duties on Chinese goods scheduled for March 2.

Investors are also waiting for speeches on Tuesday and Wednesday of Fed Chairman Jerome Powell. He should speak to the US Congress with a semi-annual report. Any hints of Powell to pause in the interest rate increase, and this is the most likely scenario, will cause a decrease in the dollar.

Pressure on the dollar index also had a sharp increase in the pound after reports appeared in the media that the leader of the Labor Party, Jeremy Corbin, announced his party’s intention to either support or suggest holding a second referendum on the British withdrawal from the EU.

*)An advanced fundamental analysis is available on the Tifia Forex Broker website at tifia.com/analytics


Meanwhile, the EUR / USD pair is trying to continue to grow above the short-term support level of 1.1338 (ЕМА200 on the 1-hour chart). However, this is hampered by the strong resistance level of 1.1365 (EMA200 on the 4-hour chart, EMA50 on the daily chart).

In case of its breakthrough, EUR / USD will move to resistance levels of 1.1465 (EMA144 on the daily chart), 1.1515 (EMA200 on the daily chart).

The decline scenario will be associated with the breakdown of the support level of 1.1338 and a decline to the support levels of 1.1270 (December lows), 1.1215 (November and year lows), 1.1200.

Support Levels: 1.1338, 1.1300, 1.1285, 1.1215, 1.1120, 1.1000

Resistance Levels: 1.1365, 1.1465, 1.1515


Trading scenarios


Sell Stop 1.1330. Stop-Loss 1.1380. Take-Profit 1.1300, 1.1285, 1.1215, 1.1120, 1.1000

Buy Stop 1.1380. Stop-Loss 1.1330. Take-Profit 1.1465, 1.1515

260219-DXY.png


260219-EU-D.png


260219-EU-H1.png


*) For up-to-date and detailed analytics and news on the forex market visit Tifia Forex Broker website tifia.com
 
XAU/USD: Current trend

02/28/2019


The dollar index stopped falling after the publication of stronger than expected US GDP data. According to the data released on Thursday by the US Department of Commerce, gross domestic product, a broad indicator of goods and services produced in the United States, rose by 2.6% per annum in the 4th quarter (the forecast was + 2.2%). GDP growth by 2.6% was lower than economic growth by 3.4% in the 3rd quarter and 4.2% in the 2nd quarter. The pace of economic activity slowed down as consumers limited their spending and the housing market held back economic growth.

This report by the Ministry of Commerce states that the decrease in services provided by the federal government due to the partial shutdown, that started on December 22 made a negative contribution to GDP growth of 0.1 percentage point in the 4th quarter.

Consumer spending, which is more than two-thirds of US GDP, rose by 2.8% per annum in the 4th quarter after rising by 3.5% in the 3rd quarter. Americans' spending on services and consumer goods and short-term use has become more moderate.

Nevertheless, the dollar reacted positively to the information provided. In the first half of the trading day on Thursday, the dollar was falling, and DXY dollar index futures, reflecting the value of the dollar against a basket of 6 major world currencies, were traded before the publication of US GDP data near the 95.75 mark, 25 points lower than the opening price of today's trading day. However, the DXY dollar index rose sharply after the publication of GDP data and moved to positive territory, above the 96.00 mark.

In the first half of the trading day, investors increased the demand for defensive assets such as the yen, franc, and gold. However, the publication of positive information on US GDP strengthened the demand for the dollar and caused the sale of gold.

*)An advanced fundamental analysis is available on the Tifia Forex Broker website at tifia.com/analytics


At the same time, the XAU / USD pair maintains a positive trend, trading in the ascending channel on the daily chart, the upper limit of which passes near the mark of 1357.00 (2017 highs).

In case of breakdown of a strong resistance level of 1326.00 (ЕМА200 on the 1-hour chart) the immediate goal of XAU / USD growth will be a local resistance level of 1346.00 (February and 2019 highs).

In the case of renewed decline and breakdown of the support level of 1310.00 (ЕМА200 on the 4-hour chart) XAU / USD may decline to the key support level of 1266.00 (ЕМА200 on the weekly and daily charts) and further with the goals of decline at support levels of 1197.00 (November lows) , 1185.00 (Fibonacci level 23.6% of the correction to the wave of decline since July 2016), 1160.00 (minimums of 2018).

Support Levels: 1316.00, 1310.00, 1303.00, 1297.00, 1277.00, 1266.00, 1248.00

Resistance Levels: 1326.00, 1346.00, 1357.00, 1365.00, 1370.00, 1375.00


Trading recommendations


Sell Stop 1314.00. Stop Loss 1331.00. Take-Profit 1310.00, 1303.00, 1297.00, 1277.00, 1266.00, 1248.00, 1234.00, 1220.00, 1197.00, 1185.00, 1160.00

Buy Stop 1331.00. Stop Loss 1314.00. Take-Profit 1346.00, 1357.00, 1365.00, 1370.00, 1375.00

280219-DXY.png


280219-XU-D.png


280219-XU-H4.png


*) For up-to-date and detailed analytics and news on the forex market visit Tifia Forex Broker website tifia.com
 
USD/CAD: Current Dynamics

03/01/2019


The US dollar declines on Friday against commodity currencies such as Australian, New Zealand and Canadian dollars. Participants in the financial market are inspired by the expectations of a speedy conclusion of a new trade agreement between China and the United States. As reported by the Bloomberg News agency on Thursday, the American negotiators will soon complete the preparation of a trade agreement with China, which may be signed in the coming weeks. The United States expects to complete the preparation of the agreement by mid-March, when President Donald Trump may meet with China’s leader Xi Jinping. US Treasury Secretary Stephen Mnuchin said Thursday that a 150-page document was being prepared, noting that "there is still a lot of work left".

Earlier on Thursday, Larry Cudlow, director of the National Economic Council of the United States, said he had made "amazing" progress, and the signing of the agreement was approaching.

World stock indices resumed their growth on Friday, while positive macro data came from China, indicating growth in the country's manufacturing sector. The final index of purchasing managers (PMI) for the manufacturing sector of China from Caixin in February was 49.9 against 48.3 in January, recovering to a 3-month high.

Also, the growth of these currencies, including CAD, contributed by the growth of oil and commodity prices.

*)An advanced fundamental analysis is available on the Tifia Forex Broker website at tifia.com/analytics


USD / CAD is dropping on Friday. However, USD / CAD found support at a key level of 1.3135 (ЕМА200 on the daily chart).

Strong support levels of 1.3235 (ЕМА200 on the 4-hour chart), 1.3182 (ЕМА200 on the 1-hour chart, ЕМА144 on the daily chart) are broken. Breakdown of support level 1.3135 will accelerate further decline. In this case, the USD / CAD will go to support levels 1.3090, 1.3020 (the bottom line of the downward channel on the daily chart).

A return to the zone above the resistance level of 1.3235 will cause a resumption of the upward trend and the growth of USD / CAD with the closest targets at the local resistance levels of 1.3340, 1.3370.

Support Levels: 1.3135, 1.3100, 1.3090, 1.3020

Resistance Levels: 1.3182, 1.3235, 1.3340, 1.3370, 1.3450, 1.3600, 1.3665, 1.3790


Trading Scenarios


Sell Stop 1.3110. Stop Loss 1.3190. Take-Profit 1.3090, 1.3020

Buy Stop 1.3190. Stop Loss 1.3110. Take-Profit 1.3235, 1.3340, 1.3370, 1.3450, 1.3600, 1.3665, 1.3790

010319-DXY.png


010319-UC-D.png


010319-UC-H4.png


*) For up-to-date and detailed analytics and news on the forex market visit Tifia Forex Broker website tifia.com
 
AUD/USD: on the eve of the RBA meeting

03/04/2019


Investor sentiment has recently improved by easing tensions in trade relations between the United States and China. Waiting for the early conclusion of a new trade agreement between the United States and China, commodity currencies, primarily the Australian dollar, rose at the beginning of today's trading day. The AUD / USD opened trading near the level of 0.7105, which is about 30 points higher than the closing price on Friday.

However, in the first half of the trading day, the AUD / USD decline resumed after the publication of weak macro data received in the morning from Australia.

At the beginning of the US trading session, the AUD / USD pair will trade near the 0.7085 mark.

On Tuesday, the RB of Australia makes a decision on the interest rate. The publication of the decision on rates is scheduled for 03:30 (GMT). In February, the RBA did not change interest rates, expressing a cautious propensity to increase them, given the increasing internal and external risks.

Probably, at tomorrow's meeting, the RBA will also signal an intention to continue to maintain the current monetary policy unchanged.

Interest rates may remain unchanged even longer, given the weak wage growth and slowdown in the Australian economy. "The Board does not see a weighty argument in favor of adjusting the key interest rate in the short term", said one of the latest statements of the RBA.

Economists also warn that due to the weak housing market and the continued weakening of housing prices in large cities, the RBA will not change rates until 2020.

In view of this, and also against the background of the strengthening US dollar, the AUD / USD will continue to decline.

*)An advanced fundamental analysis is available on the Tifia Forex Broker website at tifia.com/analytics


Downward trend resumed. AUD / USD continues to trade in a bearish trend and downward channel on the weekly chart, the lower limit of which passes near the level of 0.6600.

Below the key resistance level of 0.7260 (ЕМА200 on the daily chart), short positions with targets at the support levels of 0.6910 (lows of September 2015), 0.6830 (2016 lows) are preferable.

Consideration of long positions can be returned only after the breakdown of the local resistance level of 0.7140 (ЕМА50 on the daily chart, ЕМА200 on the 4-hour chart). Growth above the resistance level of 0.7260 is unlikely.

Support Levels: 0.7055, 0.7025

Resistance Levels: 0.7125, 0.7140, 0.7180, 0.7210, 0.7260


Trading Scenarios


Sell Stop 0.7070. Stop Loss 0.7110. Take-Profit 0.7055, 0.7025, 0.6910, 0.6830

Buy Stop 0.7110. Stop Loss 0.7070. Take-Profit 0.7125, 0.7140, 0.7180, 0.7210, 0.7260

040319-AU-D.png


040319-AU-H4.png


040319-AU-H1.png


*) For up-to-date and detailed analytics and news on the forex market visit Tifia Forex Broker website tifia.com
 
USD/CHF: Current dynamics on 03/05/2019

The US dollar continues to strengthen in the foreign exchange market, and futures for the dollar index DXY, which tracks the US currency against a basket of 6 other major currencies, are growing on Tuesday for the fifth consecutive day and are trading at 96.65 at the beginning of the European session, 33 points higher than the opening price at the beginning of the week.

As the data published last week showed, the US economy remains one of the fastest growing in the world. Gross domestic product in the 4th quarter grew by 2.6% per annum (the forecast was +2.2%). GDP growth by 2.6% was lower than economic growth by 3.4% in the 3rd quarter and 4.2% in the 2nd quarter. Nevertheless, last year was characterized by strong economic growth in the United States.

Another positive aspect of the report on GDP, published on Thursday, was the growth of companies' investments. “As for the internal situation, I think that the economy is in good condition. Unemployment is low, confidence is still positive, so it seems to me that we have good prospects”, said the chairman of the Federal Reserve Jerome Powell Systems in the Senate Banking Committee.

Now market participants will closely monitor the publication on Friday (13:30 GMT) of data from the US labor market. Along with data on inflation and GDP, labor market data are crucial for the Fed when planning monetary policy for the coming months.

Strong data are expected. With their confirmation, the dollar will continue to strengthen, including against the franc, despite the continued high demand for it as a refuge currency.

*)An advanced fundamental analysis is available on the Tifia Forex Broker website at tifia.com/analytics


Meanwhile, the USD / CHF resumed an upward trend, bargaining in the upward channel on the daily chart, the upper limit of which passes above the level of 1.0160 (March 2017 highs). Positive dynamics is maintained. Long positions are preferred. In the case of the breakdown of important short-term support levels of 0.9998 (ЕМА200 on the 1-hour chart), 0.9985 (ЕМА200 on the 4-hour chart) a signal appears to open short positions with targets at the support levels of 0.9900 (ЕМА200 on the daily chart), 0.9770 (ЕМА200 on the weekly chart), 0.9745 (Fibonacci level 50%), 0.9720 (January lows).

Support Levels: 0.9998, 0.9985, 0.9970, 0.9925, 0.9900, 0.9875, 0.9800, 0.9770, 0.9745, 0.9720, 0.9650, 0.9615, 0.9545

Resistance Levels: 1.0040, 1.0090, 1.0130, 1.0160


Trading recommendations


Sell Stop 0.9980. Stop Loss 1.0025. Take-Profit 0.9970, 0.9925, 0.9900, 0.9875, 0.9800, 0.9770, 0.9745

Buy Stop 1.0025. Stop Loss 0.9980. Take-Profit 1.0040, 1.0090, 1.0130, 1.0160

050319-DXY.png


050319-UCF-D.png


050319-UCF-H4.png


*) For up-to-date and detailed analytics and news on the forex market visit Tifia Forex Broker website tifia.com
 
Back
Top