Tifia Forex Broker Daily Market Analytics, Analytics and trading recommendations by Tifia Company

NZD/USD: Current Dynamics

05/07/2019


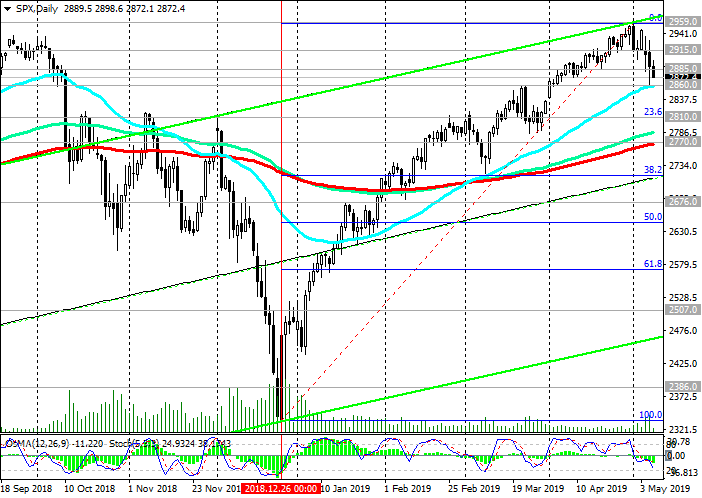
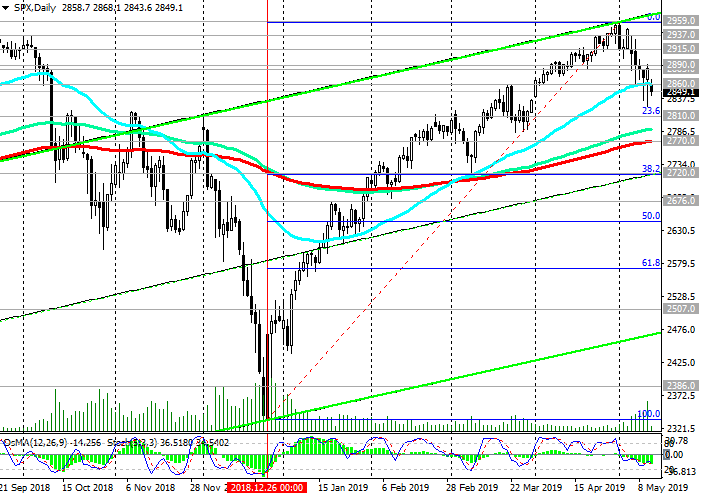
On Sunday, US President Donald Trump unpleasantly surprised investors with two Twitter messages that by Friday duties on Chinese goods would be increased. Trump's statements provoked a sharp drop in many global markets.

US Trade Representative Robert Lightheiser stated that in recent days "China has retreated from its promises". According to Lightheiser, duties on Chinese goods will be increased on Friday, as Trump warned.

The economy of New Zealand is closely connected with the economy of China, which is the largest buyer of raw materials and food (primarily meat and dairy) goods from New Zealand. Therefore, any negative information from China also negatively affects the NZD quotes.

On Tuesday, NZD / USD declines again after falling the previous day. The next meeting of the RBNZ will be held on Wednesday, and the decision on the rate of the RBNZ will be published on Wednesday at 02:00 (GMT). Probably, the rate will be reduced by 0.25% to 1.5%.

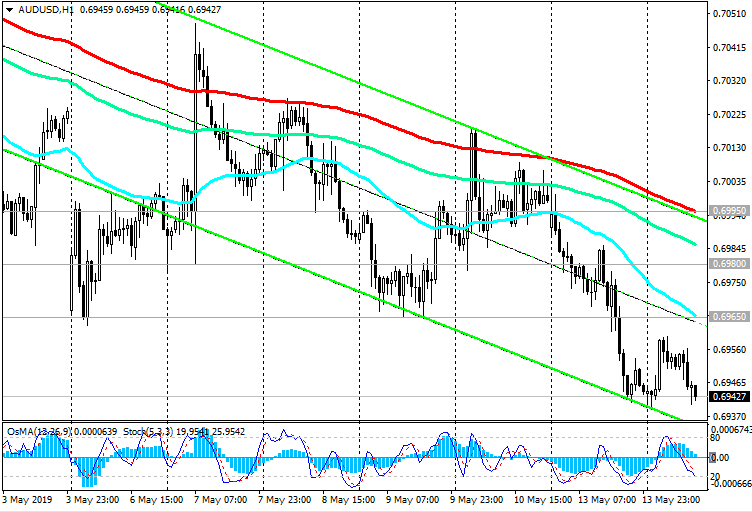
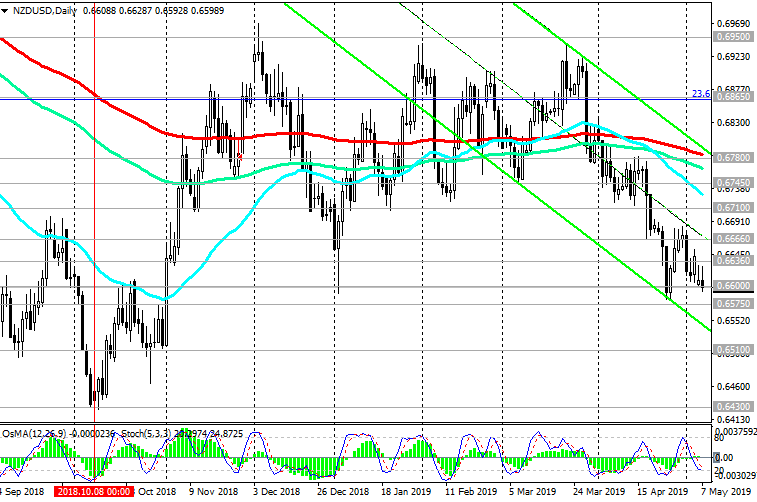
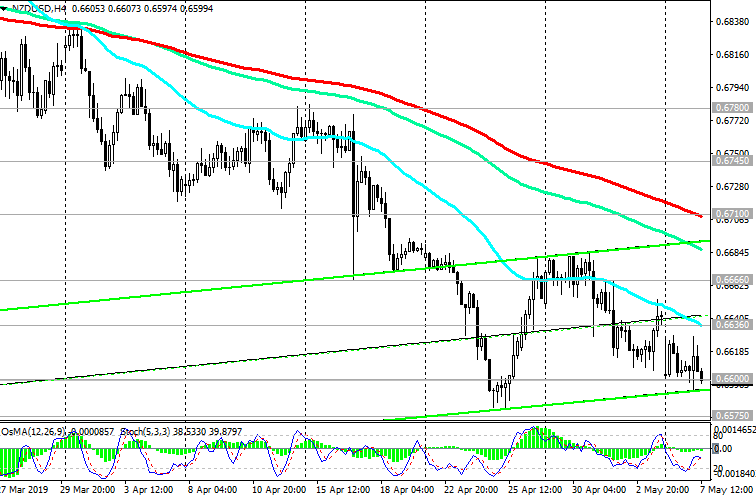
Currently, NZD / USD is again attempting to break the local support level of 0.6600. Its breakthrough may trigger a further decline to support levels of 0.6510, 0.6430.

So far, short positions look preferable.

Support levels: 0.6575, 0.6510, 0.6430

Resistance levels: 0.6660, 0.6700, 0.6745, 0.6780, 0.6800, 0.6935, 0.6980, 0.7060
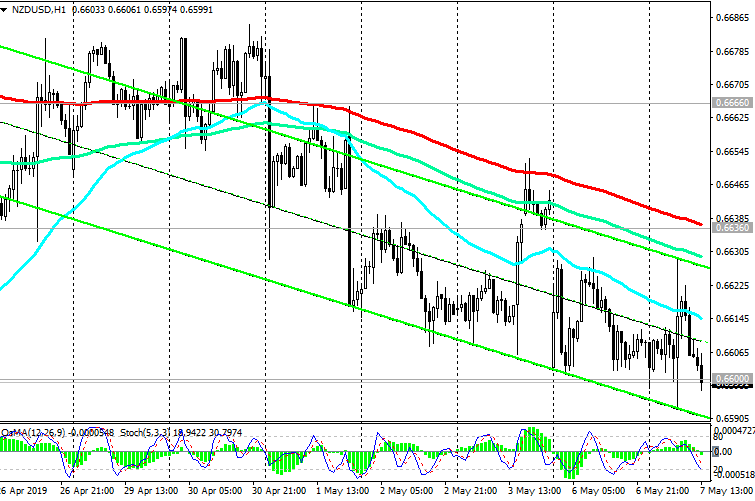

Trading scenarios


Sell Stop 0.6590. Stop Loss 0.6670. Take-Profit 0.6575, 0.6510, 0.6430

Buy Stop 0.6670. Stop Loss 0.6590. Take-Profit 0.6700, 0.6745, 0.6780, 0.6800, 0.6935, 0.6980, 0.7060

070519-NU-D.png


070519-NU-H4.png


070519-NU-H1.png


*) For up-to-date and detailed analytics and news on the forex market visit Tifia Forex Broker website tifia.com
 
S&P500: Current Situation

05/08/2019


In April, the S&P500 updated the annual and absolute maximum near the 2959.0 mark. On Wednesday, the decline in the S&P500 continues despite the fact that, overall, the positive trend continues.

While the S&P500 index is trading above the key support level of 2770.0 (ЕМА200 on the daily chart), the long-term positive trend remains. Long positions are preferred above this level.

Nevertheless, negative information, first of all, the negative course of negotiations between US and Chinese trade representatives, as well as negative economic news from the US, will cause a decrease in indices, and, as the worst-case scenario, will provoke another wave of decline.

The indicators OsMA and Stochastic on the daily, 4-hour charts turned to the short positions, signaling a likely continuation of the decline.

On Wednesday, the publication of important macro data is not planned, and Europe celebrates Victory Day. The decline in world and US indices may continue, while representatives of China and the United States will seek a solution to the situation.

Support Levels: 2860.0, 2810.0, 2770.0, 2720.0

Resistance Levels: 2885.0, 2915.0, 2937.0, 2959.0


Trading recommendations


Sell Stop 2858.0. Stop Loss 2902.0. Objectives 2810.0, 2770.0, 2720.0

Buy Stop 2902.0. Stop Loss 2858.0. Objectives 2915.0, 2937.0, 2959.0

080519-S-P500-D.png


*) For up-to-date and detailed analytics and news on the forex market visit Tifia Forex Broker website tifia.com
 
AUD/USD remains in a long-term bearish trend.

05/10/2019


On Friday, the United States raised duties on imports of Chinese goods in the amount of $ 200 billion from 10% to 25%, as previously promised by US President Donald Trump. He also said on Thursday that the US will introduce new duties in the amount of 25% on the import of Chinese goods in the amount of $ 325 billion. Thus, all goods imported from China to the United States will be subject to duties of 25%.

The foreign exchange market, on the whole, on Friday rather restrainedly reacted to this news, since it was already mainly taken into account in prices.

Meanwhile, the US trade representative Robert Lighthizer and the country's finance minister Stephen Mnuchin met with Chinese Vice Premier Liu He and agreed to continue the discussion on Friday. This allows us to preserve hope for further progress in the negotiations and the fact that both parties will come to a solution to the conflict.

From the news today, investors will also pay attention to the publication at 12:30 (GMT) of data on consumer inflation in the United States. It is expected that the consumer price index rose in April by + 0.4% (+ 2.1% in annual terms). If the data turns out to be better than the forecast, then the USD will strengthen, including with respect to AUD. With the escalation of international trade wars, the American dollar is in demand and looks more preferable than AUD.

AUD / USD remains in a long-term bearish trend. At the beginning of the European session on Friday, AUD / USD is trading near the 0.7000 mark.

Below resistance levels 0.7011 (ЕМА200 on the 1-hour chart), 0.7065 (ЕМА200 on the 4-hour chart) short positions are preferable.

Breakdown of the local support level of 0.6980 will increase the risks of further decline towards support levels of 0.6910 (lows of September 2015), 0.6830 (lows of 2016).

Support Levels: 0.6980, 0.6910, 0.6830

Resistance Levels: 0.7011, 0.7065, 0.7145, 0.7190


Trading Recommendations


Sell in the market. Stop Loss 0.7020. Take-Profit 0.6980, 0.6910, 0.6830

Buy Stop 0.7020. Stop Loss 0.6970. Take-Profit 0.7065, 0.7145, 0.7190

100519-DXY.png


100519-AU-D.png


100519-AU-H4.png


*) For up-to-date and detailed analytics and news on the forex market visit Tifia Forex Broker website tifia.com
 
S&P500: Current Dynamics

05/13/2019


Despite negotiations, on Friday the White House raised customs duties on Chinese goods worth $ 200 billion from 10% to 25%. Moreover, the USA threatened to introduce additional duties for another 325 billion dollars, i.e. on all Chinese imports. Beijing said it would retaliate.

The aggravation of the trade conflict between the United States and China led to increased fluctuations in world markets. Last week, the US S & P 500 index suffered the most severe losses since the beginning of the year.

Many economists have warned that new duties and barrage trade barriers threaten the United States with a slowdown in economic growth.

On Monday, the major US stock indices are falling, and futures for the S & P500 index at the beginning of the European session is trading near the mark of 2848.0. Probably, the American session will also begin with the fall of the indices.

In case of fixation below the support level of 2860.0, the S & P500 will go to support level of 2770.0 (ЕМА200 on the daily chart). While the S & P500 index is trading above this key support level, long-term positive dynamics remain.

Nevertheless, purchases can be resumed after the S & P500 consolidates in the zone above the short-term resistance levels of 2883.0 (ЕМА200 on the 4-hour chart), 2890.0 (ЕМА200 on the 1-hour chart).

The indicators OsMA and Stochastic on the daily, 4-hour, 1-hour charts turned to the short positions, signaling a likely continuation of the decline.

Support Levels: 2860.0, 2810.0, 2770.0, 2720.0

Resistance Levels: 2883.0, 2890.0, 2915.0, 2937.0, 2959.0


Trading Recommendations


Sell Stop 2840.0. Stop Loss 2870.0. Objectives 2810.0, 2770.0, 2720.0

Buy Stop 2870.0. Stop Loss 2840.0. Objectives 2883.0, 2890.0, 2915.0, 2937.0, 2959.0

130519-s500-D.png


130519-s500-H4.png


130519-s500-H1.png


*) For up-to-date and detailed analytics and news on the forex market visit Tifia Forex Broker website tifia.com
 
AUD/USD: trade conflict between the US and China threatens the global economy

05/14/2019


Last Monday, China announced its intention to raise duties on US imports of about $ 60 billion in response to US actions on Chinese imports. This raised investors' concerns that the US-China trade standoff would lead to a further slowdown in the global economy.

According to economists, because of the trade war, China’s GDP growth in 2019 could be less than 6%, and the US dollar / Chinese yuan pair could rise to 7.2000.

The President of the Federal Reserve Bank of Boston, Eric Rosengren, said on Monday that the escalation of the trade conflict between the United States and China increases the risk of negative developments in the economy.

Financial markets reacted to these events with a fall in stock indices, a rise in the price of the Japanese yen, government bonds and gold, as well as a fall in commodity prices and commodity currencies. First of all, it refers to the Australian dollar. China is Australia's largest trading and economic partner and a buyer of its commodities, such as liquefied gas, coal, iron ore, and gold.

External and internal macroeconomic background contributes to increasing pressure on the RBA in the direction of lowering the interest rate, and on the Australian dollar - in the direction of its further reduction.

In this situation, the AUD / USD pair is likely to continue to decline, even regardless of the Fed's actions. With the escalation of international trade wars, the US dollar still looks preferable to other currencies due to the greater stability of the American economy in this situation.

*)An advanced fundamental analysis is available on the Tifia Forex Broker website at tifia.com/analytics


Trading Scenarios

AUD / USD remains in a long-term bearish trend. The last wave of decline began in January 2018 from the level of 0.8120. AUD / USD remains under pressure below key resistance levels of 0.7140 (ЕМА144 on the daily chart), 0.7185 (ЕМА200 on the daily chart).

Nevertheless, the breakdown of the resistance levels of 0.6995 (ЕМА200 on the 1-hour chart), 0.7055 (ЕМА200 on the 4-hour chart) may provoke a continuation of the upward correction to the resistance level of 0.7140. At the moment and below the resistance levels of 0.7140, 0.7185, short positions with targets at support levels of 0.6910 (lows of September 2015), 0.6830 (2016 lows) are preferable.

Support Levels: 0.6910, 0.6830

Resistance Levels: 0.6980, 0.6995, 0.7055, 0.7140, 0.7185


Trading Scenarios


Sell in the market. Stop Loss 0.6965. Take-Profit 0.6910, 0.6830

Buy Stop 0.6965. Stop Loss 0.6935. Take-Profit 0.6980, 0.6995, 0.7055, 0.7140, 0.7185

140519-AU-D.png


140519-AU-H4.png


140519-AU-H1.png


*) For up-to-date and detailed analytics and news on the forex market visit Tifia Forex Broker website tifia.com
 
WTI: the price has reached the zone of important support levels

05/15/2019


Participants in the oil market are concerned about the escalation of trade confrontation between China and the United States and the slowdown in global economic growth. The International Energy Agency (IEA) on Wednesday lowered its forecast for global oil demand growth in 2019 by 90,000 barrels per day to 1.3 million barrels per day. These are negative fundamental factors for oil prices. At 14:30 (GMT), the Energy Information Administration of the US Department of Energy will publish its regular weekly report, according to which, reserves are expected to grow by 2.984 million barrels. If the forecast is confirmed, oil prices may resume their decline.

At the beginning of the European session on Wednesday, WTI crude oil is trading near the 61.10 mark, through which there is a strong support level (ЕМА50 and the lower line of the ascending channel on the daily chart). In case of a breakdown of this level, the price will fall to support levels of 59.90 (ЕМА200 on the daily chart) and 59.50 (Fibonacci level 50% of the upward correction to a fall from the highs of the last few years near the 76.80 mark to the support level near the 42.14 mark). Above these levels, a long-term upward trend is maintained.

If China and the United States nevertheless succeed in reaching an agreement, while negotiations between the representatives of the two countries continue, it is likely that oil prices will rise again.

The signal for the resumption of purchases will be the breakdown of the short-term resistance level of 61.85 (ЕМА200 on the 1-hour and 4-hour charts). In this case, the price will go to the recent highs near the 66.50 mark and further, to the 70.00 mark, through which the upper line of the ascending channel passes on the daily chart.

The alternative scenario will be associated with the breakdown of the support level of 59.50 and a decrease to the support level of 57.00 (EMA200 on the weekly chart). Breakdown of support levels 57.00, 55.40 (Fibonacci 38.2%) will revive the bearish trend.

Support Levels: 61.10, 59.90, 59.50, 57.00, 55.40

Resistance Levels: 61.85, 63.50, 64.40, 66.50, 68.00, 70.00


Trading Scenarios


Sell Stop 60.60. Stop Loss 62.10. Take-Profit 59.90, 59.50, 57.00, 55.40

Buy Stop 62.10. Stop Loss 60.60. Take-Profit 63.50, 64.40, 66.50, 68.00, 70.00

150519-WTI-D.png


150519-WTI-H4.png


*) For up-to-date and detailed analytics and news on the forex market visit Tifia Forex Broker website tifia.com
 
GBP/USD: Current Dynamics

05/16/2019


The pound continues to fall. The situation around Brexit has remained the main driver of the pound since mid-2016, when a Brexit referendum was held. At this time, the pound falls on information from the fact that the Prime Minister may lose his post, and his place will be taken by a supporter of tough Brexit.

Theresa May was unable to advance in negotiations with the opposition Labor Party to support the Brexit agreement. And even among the members of her Conservative Party, there are more and more of her opponents.

Having broken through the key support levels of 1.3045 (ЕМА200 on the daily chart), 1.3020 (ЕМА144 on the daily chart), on Thursday the GBP / USD pair has been falling for 9 days in a row and is trading on Thursday at the beginning of the European session, near the 1.2830 mark.

Indicators OsMA and Stochastic on the 4-hour, daily, weekly charts recommend short positions.

A further weakening of the pound will lead to a decline in GBP / USD to support levels of 1.2700 (lows of October and August 2018), 1.2600.

Purchases will be possible only after GBP / USD returns to the zone above the short-term resistance level of 1.2960 (ЕМА200 on the 1-hour chart) with growth targets at resistance levels of 1.3045, 1.3210 (Fibonacci level 23.6% of the correction to the decline of GBP / USD in the wave, started in July 2014 near the level of 1.7200), 1.3370 (March and year highs), 1.3610 (ЕМА200 on the weekly chart).

So far, short positions are preferred.

Support Levels: 1.2800, 1.2778, 1.2700, 1.2660, 1.2600

Resistance Levels: 1.2870, 1.2960, 1.3020, 1.3045, 1.3100, 1.3125, 1.3167, 1.3210


Trading Scenarios


Sell in the market. Stop Loss 1.2880. Take-Profit 1.2800, 1.2778, 1.2700, 1.2660, 1.2600

Buy Stop 1.2880. Stop Loss 1.2820. Take-Profit 1.2960, 1.3020, 1.3045, 1.3100, 1.3125, 1.3167, 1.3210

160519-GU-D.png


160519-GU-H1.png


*) For up-to-date and detailed analytics and news on the forex market visit Tifia Forex Broker website tifia.com
 
AUD/USD: Current Dynamics

05/17/2019


The US dollar rose on Thursday. The dollar index DXY, reflecting the value of the dollar against a basket of 6 major currencies, rose by 32 points on Thursday, to 97.68. Published US economic data exceeded expectations, which increased investor risk appetite.

According to data released on Thursday, the number of new homes in the United States has increased by 5.7% in April compared with the previous month and amounted to 1.235 million units; the number of initial claims for unemployment benefits was 212,000 (compared with the forecast of 220,000 and 228,000 in the previous weekly period).

On Friday, investors will pay attention to the publication (at 14:00 GMT) of the consumer confidence index from the University of Michigan. The index is an indicator of consumer confidence in economic growth. High result strengthens USD, low - weakens

The index is expected to rise to 97.5 in May against 97.2 in April. Probably, the US dollar will receive an additional impetus to growth, if the data is confirmed or will be better than the forecast. The data below the forecast will have a downward pressure on the dollar, but only in the short term.

Under conditions of uncertainty and escalation of international trade wars, the US dollar looks preferable to other currencies due to the greater stability of the American economy.

On Friday, the USD growth continues, while the DXY dollar index futures traded at the beginning of the European session near the 97.73 mark.

Meanwhile, the Australian dollar is falling after data came out on Thursday indicating that unemployment was rising in Australia to 5.2%. The revised data also indicated that unemployment in March was 5.1% versus a previous estimate of 5.0%.

Rising unemployment increases the pressure on the RBA to lower interest rates. On Tuesday, the RBA Governor will deliver a speech in Brisbane. It is possible that he will signal the imminent reduction in rates. Investors estimate the likelihood of the June decline in RBA rates at 40% and 100% in August.

In the current situation, the most likely scenario is a further decrease in AUD / USD with the closest target at 0.6830 (2016 lows).

Below the key resistance levels of 0.7130 (EMA144 on the daily chart), 0.7170 (EMA200 on the daily chart) short positions remain preferable. A strong negative impulse prevails.

Support Levels: 0.6830, 0.6800

Resistance Levels: 0.6953, 0.6980, 0.7030, 0.7130, 0.7170


Trading recommendations


Sell in the market. Stop Loss 0.6910. Take-Profit 0.6830, 0.6800

Buy Stop 0.6910. Stop Loss 0.6870. Take-Profit 0.6953, 0.6980, 0.7030, 0.7130, 0.7170

100519-DXY.png


100519-AU-D.png


100519-AU-H4.png


*) For up-to-date and detailed analytics and news on the forex market visit Tifia Forex Broker website tifia.com
 
XAU/USD: Current Dynamics

05/20/2019


At the beginning of the European session, the XAU / USD pair attempts to break through the strong and key support level of 1277.00 (Fibonacci level 61.8% of the correction to the wave of decline since July 2016 and ЕМА200 on the daily chart).

In case of a successful breakdown of this level, the targets for further decline will be the support levels of 1248.00 (Fibonacci 50%), 1197.00 (November lows), 1185.00 (Fibonacci 23.6%), 1160.00 (2018 lows), which will mean the return of gold prices in a bearish trend.

An alternative scenario involves the breakdown of the short-term resistance level of 1287.00, above which the upward trend will resume. The XAU / USD growth targets are resistance levels of 1312.00, 1323.00, 1345.00 (highs of February and 2019).

On Monday, market participants will closely monitor the performance of Fed Chairman Jerome Powell, which will begin at 23:00 (GMT). If he signals about the likelihood of a soon decrease in the interest rate, then the dollar may sharply decline, and the price of gold will rise.

Some Fed leaders are concerned about weak inflation. According to them, it is possible that the central bank will have to take measures to speed up inflation, and that they will be ready to lower interest rates. Although Jerome Powell believes that low inflation in the United States is a “temporary phenomenon”.

In the current situation, market participants prefer the dollar. The American economy as a whole is in a better condition than the economies of other countries amid the escalation of the trade conflict between the United States and China.

Support Levels: 1277.00, 1268.00, 1248.00

Resistance Levels: 1287.00, 1296.00, 1312.00, 1323.00, 1345.00, 1357.00, 1365.00, 1370.00


Trading recommendations


Sell Stop 1272.00. Stop Loss 1282.00. Take-Profit 1268.00, 1248.00, 1234.00, 1220.00, 1197.00, 1185.00, 1160.00

Buy Stop 1282.00. Stop Loss 1272.00. Take-Profit 1287.00, 1296.00, 1303.00, 1312.00, 1323.00, 1345.00, 1357.00, 1365.00, 1370.00

200519-DXY.png


200519-XU-D.png


200519-XU-H1.png


*) For up-to-date and detailed analytics and news on the forex market visit Tifia Forex Broker website tifia.com
 
AUD/USD: Trading Scenarios

05/21/2019


Rising unemployment and low inflation increase the pressure on the RBA to lower interest rates. "During the meeting on June 4, interest rate cuts will be discussed", RBA manager Philip Lowe said on Tuesday. According to him, "new stimulating measures could help accelerate economic growth".

In the minutes from the May meeting of the RBA published today, it is stated that "the lack of improvement in the labor market situation is an argument in favor of lowering interest rates". “Without easing monetary policy in the next six months, we should expect lowering forecasts for GDP growth and inflation”, the RBA leaders concluded.

International trade conflicts, primarily between the United States and China, also pose a risk to the Australian economy. Investors estimate the likelihood of the June decline in RBA rates in more than 50% and 100% in August.

Against this negative background, the decline in AUD / USD continues. Below the key resistance levels of 0.7120 (EMA144 on the daily chart), 0.7170 (EMA200 on the daily chart) short positions remain preferable.

AUD / USD remains in a long-term bearish trend. The lows of the global wave of decline, which began in July 2014 from 0.9500, are located near the mark of 0.6830. AUD / USD may reach this level in the coming days.

The objectives of the upward correction are located at the resistance levels of 0.7015 (ЕМА200 on the 4-hour chart), 0.7100, 0.7120.

However, for now, only short positions should be considered.

Support Levels: 0.6830, 0.6800

Resistance Levels: 0.6932, 0.6980, 0.7015, 0.7100, 0.7120


Trading Scenarios


Sell in the market. Stop Loss 0.6910. Take-Profit 0.6830, 0.6800

Buy Stop 0.6910. Stop Loss 0.6870. Take-Profit 0.6932, 0.6980, 0.7015, 0.7100, 0.7120

210519-DXY.png


210519-AU-D.png


210519-AU-H1.png


*) For up-to-date and detailed analytics and news on the forex market visit Tifia Forex Broker website tifia.com
 
Back
Top