Tifia Forex Broker Daily Market Analytics, Analytics and trading recommendations by Tifia Company

AUD/USD: Current dynamics and recommendations

07/18/2019


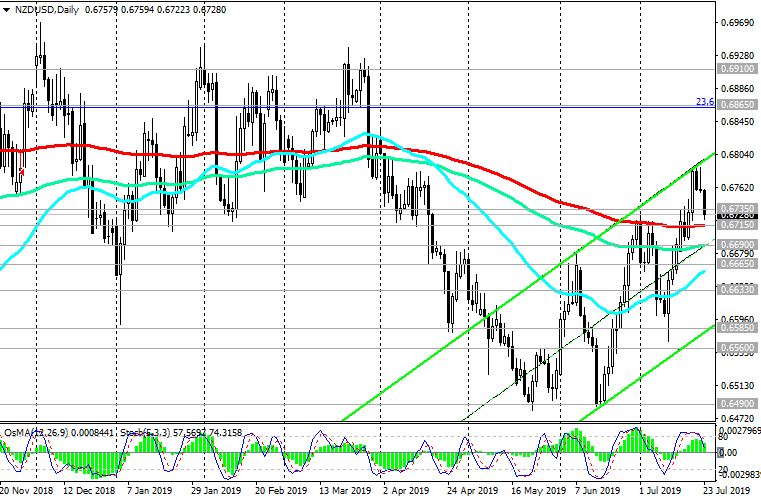
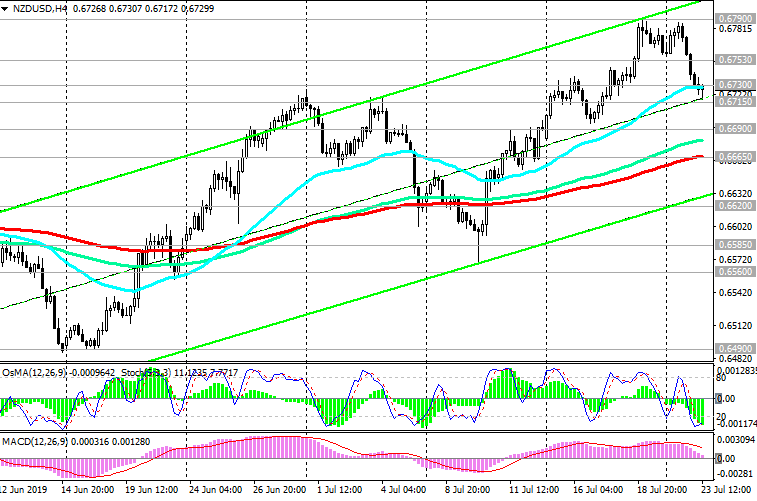
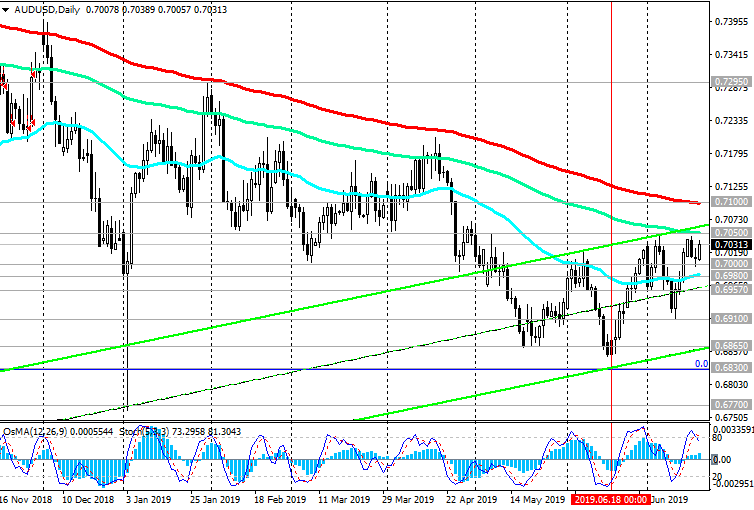
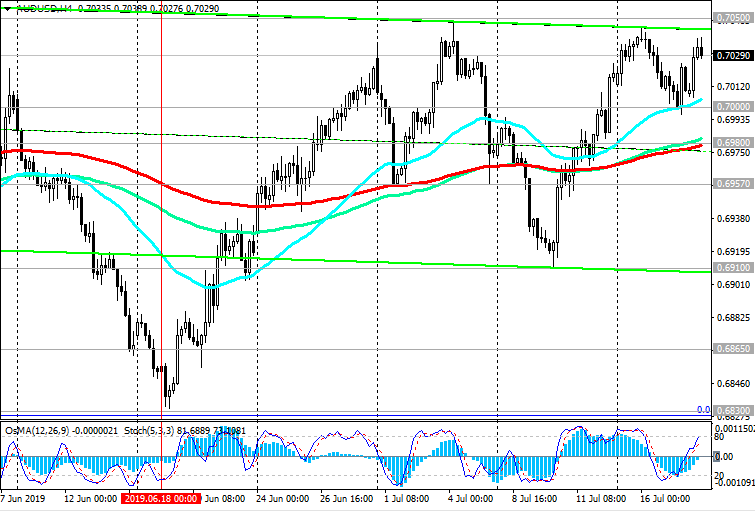
Despite the correctional growth that began in the middle of last month, AUD / USD continues to trade below key resistance levels of 0.7050 (EMA144 on the daily chart), 0.7100 (EMA200 on the daily chart), remaining in a long-term bearish trend. The last global wave of decline began in July 2014 from 0.9500. The minima of this wave and of 2016 are located near the level of 0.6830. The signal for the resumption of sales will be the breakdown of the support level of 0.6980 (ЕМА200 on the 4-hour chart). Growth above the resistance levels of 0.7050, 0.7100 is unlikely. Below these key resistance levels, short positions remain preferred. Mostly negative trend.

Intermediate reduction targets are located at support levels of 0.6910 (July lows), 0.6830 (minimums of the global decline wave, which began in July 2014 from 0.9500); long-term - at around 0.6770 (2019 lows).

Australia's leading labor market indicators point to a further slowdown in employment growth. It is likely that at this pace that testifies more about a slowdown than about the growth of the Australian labor market, the RBA leadership may go for a further easing of monetary conditions.

Unemployment remains at 5.2%, which is much higher than the forecast of the RBA, which assumed that in the 2nd quarter it will be 5%. Earlier, the RBA stated that they would like to see a fall in unemployment to 4.5% or less, as this will help accelerate wage growth and inflation rates.

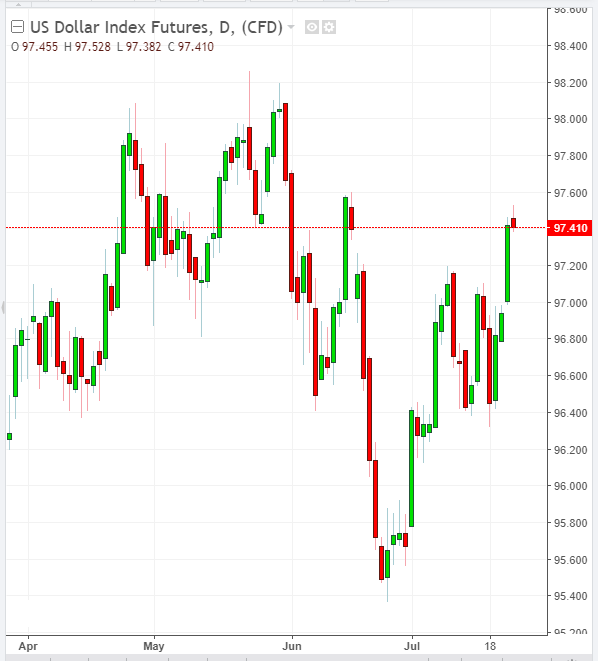
From the news today, which can increase volatility in the foreign exchange market, including in the pair AUD / USD, it is worth paying attention to the publication at 12:30 (GMT) of the macro statistics block from the USA. Weekly data on the number of unemployment claims in the US can cause an increase in volatility in trading in USD, if they are very different from the predicted values, especially for the worse.

Support levels: 0.7000, 0.6980, 0.6957, 0.6910, 0.6865, 0.6830, 0.6800, 0.6770

Resistance Levels: 0.7050, 0.7100


Trading Recommendations


Sell in the market. Stop Loss 0.7060. Take-Profit 0.7000, 0.6980, 0.6957, 0.6910, 0.6865, 0.6830, 0.6800, 0.6770

Buy Stop 0.7060. Stop Loss 0.6990. Take-Profit 0.7100

180719-AU-D.png


180719-AU-H4.png


*) For up-to-date and detailed analytics and news on the forex market visit Tifia Forex Broker website tifia.com
 
WTI Oil: Current Trends and Recommendations

07/19/2019


Despite a report by the US Department of Energy, published last Wednesday and showing a decline in oil reserves in the country, oil prices dropped sharply. Oil reserves in the US declined last week by 3.1 million barrels to 455.9 million barrels. However, it is still about 4% above the average 5-year value for this time of year.

The data of the Ministry of Energy also showed an unexpected increase in gasoline reserves by 3.6 million barrels and an increase in distillate stocks by 5.7 million barrels, to 136.2 million barrels.

The growth of stocks of petroleum products, according to economists, is due to lower demand in the United States and a decline in exports.

On Thursday, WTI quotes fell to 54.72. In total, since the beginning of the week, the price of WTI crude oil has lost approximately 7.5% by now.

On Friday, oil prices rebounded slightly after a sharp fall the day before. At the beginning of the European session on Friday, WTI crude oil traded near the mark of 56.00 dollars per barrel.

Nevertheless, due to the US-China trade conflict and due to the increase in the volume of shale oil production in the US, oil prices are likely to continue to decline.

On Friday, oil market participants will pay attention to the report of the American oilfield services company Baker Hughes on the number of active drilling rigs in the United States. Previous reports showed a decrease in the number of active oil platforms in the United States, to 784 units at the moment. If the report again indicates a decrease in the number of such installations, this may give a short-term positive impetus to prices. Publication of this report is scheduled for 17:00 (GMT).

The price of WTI crude oil has broken through key support levels of 58.80 (ЕМА200 on the daily chart), 56.80 (ЕМА200 on the weekly chart) and continues to decline, trading on Friday near the mark of 56.00 dollars per barrel at the beginning of the European session.

Negative dynamics prevail, short positions are preferable.

Further decline will mean the return of oil prices into a bearish trend.

In the alternative scenario, the growth and price fixing in the zone above the resistance levels of 58.80, 59.50 (Fibonacci level 50%) will speak about the resumption of the bull trend. The signal for this will be the breakdown of short-term resistance levels of 57.65 (EMA200 on the 4-hour chart), 58.00 (EMA200 on the 1-hour chart).

Support levels: 55.40, 54.10, 53.25, 50.30, 49.00, 42.15

Resistance Levels: 56.80, 57.65, 58.00, 58.80, 59.50, 60.90, 63.50, 64.40, 66.50


Trading Scenarios


Sell Stop 55.30. Stop-Loss 58.40. Take-Profit 54.10, 53.25, 50.30, 49.00, 42.15

Buy Stop 58.40. Stop-Loss 55.30. Take-Profit 58.80, 59.50, 60.90, 63.50, 64.40, 66.50

190719-WTI-D.png


190719-WTI-H4.png


*) For up-to-date and detailed analytics and news on the forex market visit Tifia Forex Broker website tifia.com
 
EUR/USD: Current dynamics and recommendations

07/22/2019


Last Thursday, the dollar fell sharply. The reason was the statements of the President of the Federal Reserve Bank of New York, John Williams. In his opinion, the Fed should take prompt action when signs of a weakening economy appear. Investors took his words as a signal to a potential rate cut in July by half a percentage point.

However, a further weakening of the dollar did not occur. Last Friday, the Fed said that the talk about lowering the key rate by half a percentage point and other topics that the President of the Federal Reserve Bank of New York, John Williams, said on Thursday, more relate to theoretical assumptions during periods of obvious contraction of the economy. Recent economic data do not indicate the risk of a sharp downturn in the US economy, according to Fed officials.

The rate cut by 0.25% at the meeting on July 30 - 31 was mainly already taken into account in prices, and the probability of a more aggressive easing of the Fed’s monetary policy decreased.

Meanwhile, investors will follow the ECB meeting. On Thursday (at 11:45 GMT) the ECB decision on rates will be published. It is expected that the leaders of the ECB at this meeting so far will keep the current monetary policy unchanged, but may declare a propensity for a softer policy.

The ECB press conference will also begin on Thursday, at 12:30 (GMT).

At the beginning of the European session, the EUR / USD is trading in a narrow range and near the 1.1215 mark. The signal for the resumption of sales will be the breakdown of the local support level of 1.1195 (July lows).

Long-term negative dynamics remains below the resistance level of 1.1340 (ЕМА200 on the daily chart). In the current situation and below the resistance level of 1.1285 (the Fibonacci level of 23.6% of the correction to the fall from the level of 1.3900, which began in May 2014), short positions look preferable.

Support Levels: 1.1195, 1.1180, 1.1125

Resistance Levels: 1.1241, 1.1256, 1.1285, 1.1300, 1.1340, 1.1410, 1.1445


Trading Recommendations


Sell Stop 1.1190. Stop Loss 1.1245. Take-Profit 1.1180, 1.1125, 1.1100

Buy Stop 1.1245. Stop-Loss 1.1190. Take-Profit 1.1256, 1.1285, 1.1300, 1.1340

220719-EU-D.png


220719-EU-H1.png


*) For up-to-date and detailed analytics and news on the forex market visit Tifia Forex Broker website tifia.com
 
NZD/USD: Current dynamics and recommendations

07/23/2019


In the middle of the month, the NZD / USD broke through the key resistance level of 0.6715 (ЕМА200 on the daily chart) and reached a 4-month high near the mark of 0.6790.

The reason for the growth of the pair was mainly the weakening of the US dollar after the Fed leaders expressed a propensity for a softer monetary policy.

Nevertheless, the reduction in the Fed rate at the meeting on July 30 - 31 by 0.25% has already been taken into account, mainly in prices.

If, on the part of the Fed’s management before this date, there is no further wave of verbal intervention regarding the desirability of a lower interest rate, then a further decline in the US dollar is unlikely.

This is well demonstrated by the US dollar index DXY, which is growing today for the third day in a row. DXY dollar index futures traded at the beginning of today's European session near the 97.20 mark, 40 points higher than the closing price last Friday.

At the same time, the slowdown in the global economy and the increase in import duties negatively affect the export-oriented New Zealand economy. The ongoing trade conflict between the United States and China makes market participants cautious about prospects.

Today, NZD / USD has been falling for the 3rd day in a row, trading above the key support level of 0.6715 (ЕМА200 on the daily chart).

After the breakdown of the support level of 0.6690 (EMA144 on the daily chart), short positions will again be relevant with the targets of decline at the support levels of 0.6665 (ЕМА200 on the 4-hour chart), 0.6620.

More distant reduction targets are located at support levels of 0.6490 (2019 lows), 0.6430 (2018 lows), 0.6260 (0% Fibonacci level and minimums of the global decline of the pair from 0.8820 mark).

The signal for the resumption of purchases will be the breakdown of the short-term resistance level of 0.6753 (ЕМА200 on the 15-minute chart) with targets at the resistance levels of 0.6790, 0.6865 (Fibonacci level 23.6%).

Volatility in the NZD may sharply increase at 10:45 pm (GMT), when data on New Zealand's foreign trade balance for June will be published, and if the data differ greatly from the forecast values.

So far, above the support level of 0.6715, the positive dynamics of NZD / USD remains.

Support levels: 0.6715, 0.6690, 0.6665, 0.6620, 0.6585, 0.6560, 0.6490, 0.6430, 0.6400, 0.6300, 0.6260

Resistance Levels: 0.6753, 0.6790, 0.6865, 0.6910


Trading Scenarios


Sell Stop 0.6680. Stop Loss 0.6755. Take-Profit 0.6665, 0.6620, 0.6585, 0.6560, 0.6490, 0.6430, 0.6400, 0.6300, 0.6260

Buy Stop 0.6755. Stop Loss 0.6680. Take-Profit 0.6790, 0.6865, 0.6920

230719-DXY.png


230719-NU-D.png


230719-NU-H4.png


*) For up-to-date and detailed analytics and news on the forex market visit Tifia Forex Broker website tifia.com
 
EUR/USD: Current dynamics and recommendations

07/24/2019


On Wednesday, EUR / USD declines for the fourth day in a row. Long-term negative dynamics remains below the resistance level of 1.1340 (ЕМА200 on the daily chart). A strong level that holds EUR / USD from a more significant correction growth is the resistance level of 1.1285 (Fibonacci level 23.6% of the correction to the fall from the level of 1.3900, which began in May 2014). In the alternative scenario and after the breakdown of the resistance level of 1.1285, EUR / USD will move towards the key resistance level of 1.1340 (ЕМА200 on the daily chart) with the intermediate goal at the resistance level of 1.1300 (ЕМА144 on the daily chart).

A more aggressive scenario involves the return of EUR / USD to the zone of resistance levels 1.1410 (monthly maximum), 1.1445. However, this is an unlikely scenario.

In the current situation and below the resistance level of 1.1285, only short positions should be considered.

The PMI purchasing managers' index for the manufacturing sector in Germany, published on Wednesday, fell to a minimum of 84.1 in 84 months in July from 45.0 in June. The accelerated decline in industrial production in Germany indicates a growing recession risk in this country with the largest economy in Europe.

Investors expect the ECB at its next meeting on Thursday to not change its monetary policy, but Mario Draghi is likely to set the stage for easing monetary policy later, in September or November.

Expectations of such a decision by the ECB put strong pressure on the euro. The publication of the ECB decision on rates will be held on Thursday (at 11:45 GMT), the ECB press conference will begin at 12:30.

Obviously, before these events, the euro and the EUR / USD pair will remain under pressure.

Support Levels: 1.1125, 1.1100, 1.1030

Resistance Levels: 1.1180, 1.1195, 1.1215, 1.1248, 1.1285, 1.1300, 1.1340, 1.1410, 1.1445


Trading Recommendations


Sell Stop 1.1125. Stop Loss 1.1160. Take-Profit 1.1100, 1.1030

Buy Stop 1.1160. Stop-Loss 1.1125. Take-Profit 1.1180, 1.1195, 1.1215, 1.1248, 1.1285, 1.1300, 1.1340

240719-DXY.png


240719-EU-D.png


240719-EU-H4.png


*) For up-to-date and detailed analytics and news on the forex market visit Tifia Forex Broker website tifia.com
 
XAU/USD: Current dynamics and recommendations

07/25/2019


In anticipation of easing monetary policy by the world's largest central banks, global stock indices are rising. Gold quotes are also rising. In addition to expectations of easing monetary policy, primarily from the Fed, the rise in gold prices is stimulated by the preservation of geopolitical tensions and the risks of a slowdown in the global economy against the backdrop of international trade conflicts.

Today, the ECB meeting is in the center of attention of traders. The ECB rate decision will be published at 11:45 (GMT), and the ECB press conference will begin at 12:30. It is widely expected that the ECB will keep its monetary policy unchanged today. More interest to traders will be the press conference. It is highly likely that the head of the bank, Mario Draghi, announces a reduction in the ECB interest rate in September and, possibly, in November, as well as a restart of the quantitative easing program in the amount of 2.6 trillion euros in December.

During this period of time (11:45 - 12:30 GMT) a sharp increase in volatility is expected in the entire financial market, including in gold quotes.

Last week, the XAU / USD pair reached a new 6-year high near the mark of 1452.00.

The signal for short-term sales will be the breakdown of the support level of 1420.00 (ЕМА200 on the 1-hour chart) with the target at the support levels of 1394.00 (ЕМА200 on the 4-hour chart), 1380.00 (Fibonacci level 38.2%). Despite a slight decrease in quotations (to the current mark of 1426.00), the bullish trend of gold remains.

Above support levels 1394.00, 1380.00 long positions are preferable. A signal for purchases will be the breakdown of local resistance levels of 1440.00, 1452.00. The breakdown of the resistance level of 1485.00 (Fibonacci 50% of the correction to the wave of decline since September 2011 and the mark of 1920.00) will confirm the completion of the corrective decline and the resumption of price growth.

Support Levels: 1420.00, 1394.00, 1380.00, 1357.00, 1346.00, 1324.00, 1315.00, 1298.00, 1278.00, 1268.00, 1253.00

Resistance Levels: 1440.00, 1452.00, 1485.00


Trading recommendations


Sell Stop 1413.00. Stop-Loss 1431.00. Take-Profit 1394.00, 1380.00

Buy Stop 1431.00. Stop Loss 1413.00. Take-Profit 1440.00, 1452.00, 1485.00

250719-XU-D.png


250719-XU-H4.png


*) For up-to-date and detailed analytics and news on the forex market visit Tifia Forex Broker website tifia.com
 
EUR/USD: US GDP exceeded forecast

07/26/2019

Current Dynamics


GDP growth is "not bad, considering" the Fed's interest rate policy. That is how American President Donald Trump reacted to the publication on Friday of data on US GDP for the 2nd quarter, which exceeded market expectations.

The Commerce Department reported on Friday (12:30 GMT) a 2.1% increase in gross domestic product in the 2nd quarter. Economists had expected GDP growth of 1.8%.

Trump again lashed out at the Fed after the publication of GDP data, calling the US central bank "a burden hanging on our neck".

Increased consumer spending leveled the fall in investment by American companies. Consumer spending, which accounts for more than two-thirds of the US economy, in the 2nd quarter, adjusted for inflation, rose by 4.3% per annum, which is a maximum since the end of 2017, after rising by 1.1% per annum in the previous quarter.

Government spending also spurred GDP growth, adding 5.0% per annum.

The general inflation indicator also rose. The price index for personal consumption expenditure (PCE) in the 2nd quarter rose 2.3% after rising 0.4% in the 1st quarter. The base PCE index, which does not take into account the prices of food and energy, rose by 1.8%.

Thus, the ten-year period of economic growth in the United States continued, despite foreign trade tensions and a slowdown in the global economy.

The Commerce Department’s report released Friday showed little impact on expectations that the Federal Reserve would lower its key interest rate by 0.25% at a meeting July 30 - 31.

However, the dollar rose strongly on Friday. His positive dynamics were also spurred by statements by Lawrence Kudlow, director of the White House National Economic Council, who said that the United States would not intervene in the markets in order to lower the rate of its currency.

At the same time, the euro continued to decline against the dollar after the European Central Bank on Thursday signaled its willingness to lower short-term interest rates and restart its large-scale bond purchase program. The current interest rate of the ECB from 2016 is at the level of 0%, and the deposit rate at the level of -0.4%. In a related statement, the ECB expressed concern about the weakening European economy and global negative factors, such as international trade conflicts and Brexit.

The next meeting of the ECB is scheduled for September 12, and it is likely that a whole package of measures will be adopted at this meeting, including a reduction in the interest rate of 0.25% and a restart of the quantitative easing program in the amount of 2.6 trillion euros.


At the time of this writing, the EUR / USD pair was trading near the 1.1120 mark, 25 points lower than the opening price of the trading day on Friday. The negative dynamics of EUR / USD persists after the pair reached a new annual minimum on Thursday near the 1.1100 mark.

In the current situation, short positions look relevant and safer.

Below resistance levels of 1.1335 (ЕМА200 on the daily chart), 1.1290 (ЕМА144 on the daily chart), 1.1285 (Fibonacci 23.6% of the correction to the fall from the level of 1.3900, which began in May 2014), long-term negative dynamics remain.

An upward correction is also possible, but so far no higher than the short-term resistance level of 1.1233 (ЕМА200 on the 4-hour chart). There are no prerequisites for more confident growth of EUR / USD.

Support Levels: 1.1100, 1.1030

Resistance Levels: 1.1187, 1.1233, 1.1285, 1.1290, 1.1335, 1.1410, 1.1445


Trading Recommendations


Sell in the market. Stop Loss 1.1160. Take-Profit 1.1100, 1.1030

Buy Stop 1.1160. Stop Loss 1.1100. Take-Profit 1.1187, 1.1233, 1.1285, 1.1290, 1.1335

260719-EU-D.png


260719-EU-H4.png


*) For up-to-date and detailed analytics and news on the forex market visit Tifia Forex Broker website tifia.com
 
S&P500: Current dynamics before the Fed meeting

07/29/2019


Expectations of easing of the monetary policy of the Fed and positive macro statistics coming from the United States are pushing major US stock indexes to new heights.

Last week, the S&P500 index updated its record high near the 3028.0 mark after the US Department of Commerce released a report, according to which GDP grew in the 2nd by +2.1% (annualized) after +3.1% in the 1st quarter, with a forecast of +2.0%. At the same time, consumer spending, which accounts for more than two-thirds of the US economy, in the 2nd quarter grew at the highest rate since the end of 2017, reaching +4.3%.

Trump again lashed out at the Fed after the publication of GDP data, calling the US central bank "a burden hanging on our neck", although GDP growth, in his opinion, was "not bad, given" the Fed's policy.

At the same time, the GDP report did not affect expectations that the Federal Reserve will lower its key interest rate by 0.25 percentage points at the meeting July 30 - 31, given the continuing risks of a downturn in the global economy and the need to achieve the target inflation rate.

Interest for investors will be the accompanying statements by the Fed leadership and a press conference following a meeting of the central bank. If Jerome Powell signals a propensity to lower the rate in September or before the end of the year, in this case, US stock indexes will accelerate their growth.

Since the opening of today's trading day, the S&P500 is trading in a narrow range near the 3020.0 mark.

Above support levels 2840.0 (ЕМА200 on the daily chart), 2865.0 (Fibonacci level 23.6% of the correction to the growth since December 2018 and 2335.0 mark), the bullish trend of the S&P500 remains.

The signal for sales and the start of a downward correction will be the breakdown of the short-term support level of 3004.0 (ЕМА200 on the 1-hour chart) with targets at the support levels of 2965.0 (ЕМА200 on the 4-hour chart and highs of May), 2937.0 (2018 highs).

So far, long positions are preferred. However, it is also likely that the S&P500 will remain in the current range until the end of the Wednesday when the Fed’s decision and plans are known.

Support Levels: 3004.0, 2965.0, 2937.0, 2865.0, 2840.0, 2765.0

Resistance Levels: 3028.0


Trading Recommendations


Sell Stop 2990.0. Stop-Loss 3030.0. Targets 2965.0, 2937.0

Buy Stop 3030.0. Stop Loss 2990.0. Targets 3050.0, 3100.0, 3200.0

290719-S500-D.png


290719-S500-H1.png


*) For up-to-date and detailed analytics and news on the forex market visit Tifia Forex Broker website tifia.com
 
GBP/USD: the fall of the pound has intensified

30/07/2019


The pair GBP / USD resumed falling amid risks for the British economy due to the increased likelihood of a “tough” Brexit.

Boris Johnson, who succeeded Theresa May as prime minister, said earlier that he was ready for a tough Brexit. On October 31, the UK should finally withdraw from the EU, even if no agreement is reached between the parties.

"The exit agreement is dead and should be canceled, but there is a possibility of a new deal", Johnson said on Monday during his visit to Scotland. His press secretary announced the Prime Minister’s decision to refuse to meet with EU leaders, unless they change their position. "The UK will withdraw from the EU on October 31, anyway", she said.

The pound fell 1.3% against the US dollar on Monday and also traded at the lowest level against the euro since September 2017. On Tuesday, the decline in the pound continues.

In the current situation, only short positions should be considered for the GBP / USD pair. Mostly long-term negative dynamics. The immediate goal of the decline is the support level of 1.2000 (2017 lows and the Fibonacci 0% level of the correction to the decline of the GBP / USD pair in the wave that started in July 2014 near the level of 1.7200).

Consideration of long positions can only be returned after the pair grows to a zone above resistance levels of 1.2480 (November 2018 lows), 1.2530 (ЕМА200 on 4-hour chart) with targets at resistance levels of 1.2775, 1.2840 (upper line of the ascending channel and ЕМА200 on the daily chart). However, this is an unlikely scenario.

On Thursday at 11:00 (GMT) the decision of the Bank of England on the rate will be published, and at 11:30 the speech of the head of the Bank of England Mark Carney will begin. The risks of a “tough” Brexit and the likelihood of a deteriorating economic situation in the country have a negative impact on the Bank of England, which is aimed at easing policies. Although, most likely, the bank will refrain so far from any changes.

Support Levels: 1.2110, 1.2000

Resistance Levels: 1.2400, 1.2480, 1.2530, 1.2670, 1.2700, 1.2775, 1.2840


Trading Recommendations


Sell in the market. Stop Loss 1.2230. Take-Profit 1.2110, 1.2000

Buy Stop 1.2230. Stop Loss 1.2150. Take-Profit 1.2400, 1.2480, 1.2530, 1.2670, 1.2700

300719-GU-D.png


300719-GU-H4.png


*) For up-to-date and detailed analytics and news on the forex market visit Tifia Forex Broker website tifia.com
 
NZD/USD: the dynamics of the pair depends mainly on the Fed and the US dollar

07/31/2019


In mid-July, the NZD / USD pair broke through the key resistance level of 0.6710 (ЕМА200 on the daily chart) and continued to rise against the background of the weakening US dollar. Growth stopped at 0.6790, almost a 4-month high.

The upper line of the ascending channel on the daily chart also passes through this mark. There was a rebound from it into the channel and to its lower boundary, passing near the level of 0.6610, where NZD / USD is now trading.

Investors are waiting for the outcome of the two-day Fed meeting, which will end on Wednesday with the publication (at 18:00 GMT) of an interest rate decision. Probably, the Fed will reduce the interest rate by 25 basis points (to 2.25%). However, the markets have already taken into account in the quotations the reduction of the rate by 0.25%, and if the Fed does not give a strong signal about the further easing of its monetary policy, the dollar decline may have a short-term character.

Steadily weak inflation is the main and, perhaps, so far the only negative domestic economic factor that can affect the Fed’s decision to lower the rate more strongly. Among other negative factors are the uncertainty in US trade relations with China and the risks of a slowdown in the global economy.

At 18:30 (GMT), a press conference on the results of the Fed meeting will begin. Signals from Fed Chairman Jerome Powell, aimed at the likelihood of further easing of monetary policy, will cause the dollar to fall. Otherwise, after a short-term decline, the dollar is likely to resume growth, and the NZD / USD pair will decline.

In this case, the decline in NZD / USD is likely to resume after a small short-term correction.

After the breakdown of the local support level of 0.6585, NZD / USD will head towards the annual minimum near the 0.6490 mark. More distant targets of decline are located at support levels of 0.6430 (2018 lows), 0.6260 (Fibonacci 0% level and minima of the global decline pair from 0.8820).

The signal for the resumption of long positions will be the breakdown of the short-term resistance level of 0.6659 (ЕМА200 on the 1-hour and 4-hour charts) with targets at the resistance levels of 0.6680 (ЕМА144), 0.6710 (ЕМА200 and the middle of the rising channel on the daily chart). Further growth of NZD / USD is unlikely, and short positions are preferred below the local support level of 0.6610.

Support Levels: 0.6610, 0.6585, 0.6560, 0.6490, 0.6430, 0.6400, 0.6300, 0.6260

Resistance Levels: 0.6659, 0.6680, 0.6710, 0.6790, 0.6865, 0.6910


Trading Recommendations


Sell Stop 0.6580. Stop Loss 0.6635. Take-Profit 0.6560, 0.6490, 0.6430, 0.6400, 0.6300, 0.6260

Buy Stop 0.6635. Stop Loss 0.6580. Take-Profit 0.6659, 0.6680, 0.6710

310719-NU-D.png


310719-NU-H4.png


*) For up-to-date and detailed analytics and news on the forex market visit Tifia Forex Broker website tifia.com
 
Back
Top