Tifia Forex Broker Daily Market Analytics, Analytics and trading recommendations by Tifia Company

EUR/USD: on the eve of the ECB meeting

09/12/2019


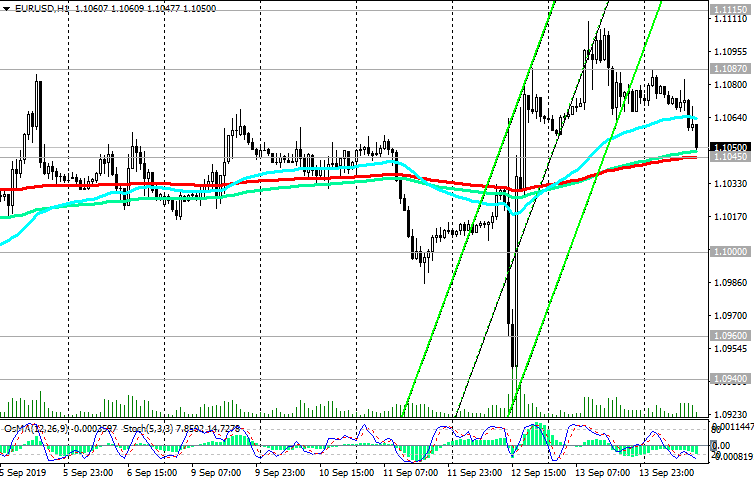
The focus of traders today is the ECB meeting. The ECB is expected to announce a large-scale easing program, including a reduction in deposit rates by 20 basis points, and bond purchases of € 30 billion per month for nine months.

If the ECB's decisions on monetary policy turn out to be more modest and disappoint market participants, then the euro may further strengthen, including in the EUR / USD pair. Thus, the intrigue about the actions of the ECB at its meeting today remains, and you need to be prepared for high volatility in this period of time. The decision on rates will be published at 11:45 (GMT), and at 12:30 the ECB press conference will begin.

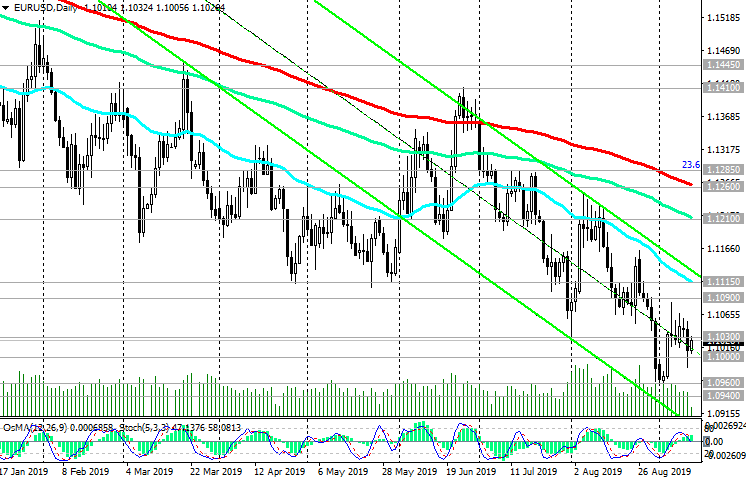
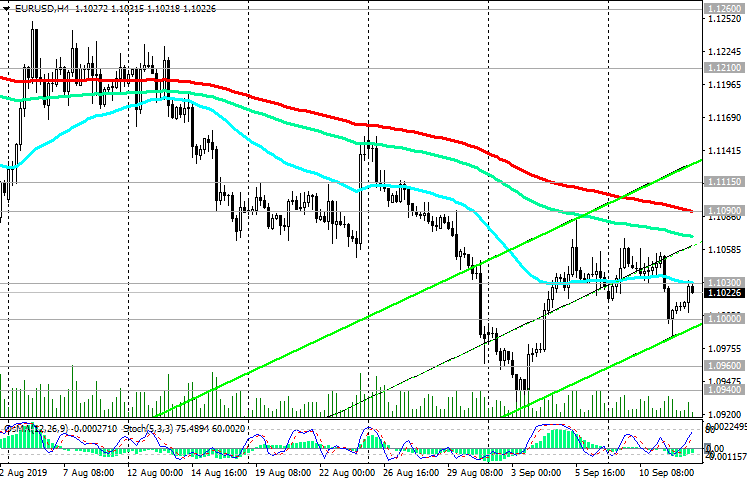
In case of significant mitigation measures by the ECB today, the EUR / USD pair will again go “south” with the immediate target at 1.0960 (the lower border of the downward channel on the weekly chart).

If the ECB does not live up to market expectations and declares a less aggressive stimulus policy, then the EUR / USD pair after a short-term decline may resume corrective growth in the direction of resistance levels 1.1210 (ЕМА144 on the daily chart), 1.1260 (ЕМА200 on the daily chart), 1.1285 (Fibonacci level 23.6% of the correction to the fall from the level of 1.3900, which began in May 2014).

Growth above these resistance levels is unlikely.

Support Levels: 1.1000, 1.0960, 1.0940, 1.0900

Resistance Levels: 1.1030, 1.1090, 1.1115, 1.1210, 1.1260, 1.1285


Trading Recommendations


Sell Stop 1.0980. Stop-Loss 1.1060. Take-Profit 1.0960, 1.0940, 1.0900, 1.0800

Buy Stop 1.1060. Stop-Loss 1.0980. Take-Profit 1.1090, 1.1115, 1.1210, 1.1260

[img]https://i.postimg.cc/gcCv5zrk/120919-EU-W.png[/img]

120919-EU-D.png


120919-EU-H4.png


*) For up-to-date and detailed analytics and news on the forex market visit Tifia Forex Broker website tifia.com
 
S&P500: positive momentum maintains

09/13/2019


As already known, on Thursday the ECB lowered the base interest rate on deposits to -0.5% and resumed the QE program by 20 billion euros per month. The new quantitative easing program is expected to be “implemented as much as needed”, the ECB said.

European, world and US stock indices positively accepted the ECB decision, continuing to strengthen on Friday.

Expectations of reaching an agreement in a trade dispute between the US and China, easing the monetary policy of the Fed and positive macro statistics coming in from the USA on Thursday also contributed to the resumption of growth in major US stock indexes.

On Thursday, the Dow Jones Industrial Average rose 0.2% to 27182.00 points, which was the seventh consecutive growth session. The S&P 500 added 0.3% to reach 3009.00 points, while the Nasdaq Composite also rose 0.3% to 8194.0 points. The yield on 10-year US Treasury bonds rose on Friday to 1.805% versus 1.733% on Wednesday, which indicates the tendency of investors to buy more risky, but also more profitable stock market assets.

At the beginning of the European session on Friday, futures on the S&P500 index were trading near 3014.0, close to absolute and annual highs at 3028.0.

On the eve of the Fed meeting next week, the S&P500 index maintains a long-term positive trend. It is widely expected that the Fed will lower rates by 0.25%, to 2.0%, the second time this year.

The index is trading above the key support level of 2865.0 (ЕМА200 and the lower border of the ascending channel on the daily chart, as well as the Fibonacci level 23.6% of the correction to the growth since December 2018 and the level of 2335.0). After the breakdown of the local resistance level of 3028.0 (absolute maximums), the S&P500 growth is likely to continue.

Above the support level of 2940.0 (ЕМА200 on the 4-hour chart and the middle of the rising channel on the daily chart), from S&P500 sales should be abstained.

Support Levels: 2990.0, 2972.0, 2965.0, 2940.0, 2900.0, 2865.0, 2765.0

Resistance Levels: 3028.0


Trading Recommendations


Sell Stop 2990.0. Stop-Loss 3022.0. Goals 2972.0, 2965.0, 2940.0, 2900.0, 2865.0

Buy Stop 3022.0. Stop-Loss 2990.0. Goals 3028.0, 3100.0, 3200.0

130919-s500-D.png


130919-s500-H4.png


*) For up-to-date and detailed analytics and news on the forex market visit Tifia Forex Broker website tifia.com
 
EUR/USD: negative dynamics prevail

09/16/2019


EUR / USD continues to decline in the long-term bearish trend, trading in downward channels on the daily and weekly charts.

At the beginning of this month, EUR / USD tested the support level near the level of 1.0960, however, subsequently rose to the resistance level of 1.1115 (the upper border of the downward channel and ЕМА50 on the daily chart).

At the moment, EUR / USD is falling, remaining under pressure from the ECB's decision on monetary policy last Thursday. As you know, the ECB resumed the program of quantitative easing and lowered the key interest rate on deposits by 0.1%, to -0.5%.

Now financial market participants are turning their attention to the Fed meeting next week. As expected, the Fed will reduce the rate by 0.25% to 2.00%, which will not have a significant impact on the dynamics of the dollar. The dollar may weaken sharply if the Fed leaders announce plans to further mitigate monetary policy by the end of the year.

The Fed meeting will be held September 17 - 18. Probably, up to this point, the EUR / USD pair will also remain under pressure. In the context of trade wars, the dollar remains a protective asset.

Currently, EUR / USD is trading below the key resistance levels of 1.1210 (ЕМА144 on the daily chart), 1.1260 (ЕМА200 on the daily chart), 1.1285 (Fibonacci level 23.6% of the correction to the fall from the level of 1.3900, which began in May 2014) .

Short positions are recommended below these resistance levels.

The breakdown of the short-term support level of 1.1045 (ЕМА200 on the 1-hour chart) will be a signal for resuming sales of EUR / USD with targets near the levels of 1.0900, 1.0850.

Support Levels: 1.1045, 1.1000, 1.0960, 1.0940, 1.0900, 1.0850

Resistance Levels: 1.1087, 1.1115, 1.1210, 1.1260, 1.1285


Trading Recommendations


Sell Stop 1.1040. Stop-Loss 1.1090. Take-Profit 1.1000, 1.0960, 1.0940, 1.0900, 1.0850

Buy Stop 1.1090. Stop-Loss 1.1040. Take-Profit 1.1115, 1.1210, 1.1260

[img]https://i.postimg.cc/g0FyLwNf/160919-EU-D.png[/img]

160919-EU-H1.png


*) For up-to-date and detailed analytics and news on the forex market visit Tifia Forex Broker website tifia.com
 
NZD/USD: NZD remains under pressure

09/17/2019


In August, the RBNZ cut the rate by 50 bp to 1.00%, explaining this decision by the aggravation of the trade war between the US and China and the loss of momentum in the New Zealand economy.

The New Zealand currency remains vulnerable amid the risks of a slowdown in the global economy and a trade conflict between China and the United States, New Zealand's two largest trading partners.

According to Westpac McDermott Miller on Monday evening (21:00 GMT), consumer confidence in New Zealand has fallen to its lowest level since 2012. The consumer confidence index in the 3rd quarter amounted to 103.1, which is 0.4 lower than the previous value and less than the forecast of 104.0.

Recent data show that New Zealand’s annual GDP growth may be below 2%, although economists believe that annual GDP growth should be 3% to sustainably achieve the inflation target.

Data on the country's GDP for the 2nd quarter will be published on Wednesday at 22:45 (GMT). According to the forecast, GDP growth in the 2nd quarter was + 0.4% (+ 2.0% in annual terms).

In general, the long-term bearish trend of the NZD / USD pair continues, which resumed in April 2018. Despite the expected easing of the Fed's monetary policy, the fall of NZD / USD is likely to continue.

Currently, NZD / USD is trading near 0.6325, below the short-term resistance level of 0.6385 (ЕМА200 on the 1-hour chart).

Below the resistance levels 0.6443, 0.6425 (ЕМА200 on the 4-hour chart and the lows of October 2018), only short positions should be considered.

Below the resistance level of 0.6620 (ЕМА200 on the daily chart), the long-term bearish trend NZD / USD prevails.

Support Levels: 0.6300, 0.6260

Resistance Levels: 0.6385, 0.6425, 0.6443, 0.6490, 0.6575, 0.6620


Trading Scenarios


Sell by market. Stop-Loss 0.6390. Take-Profit 0.6300, 0.6260, 0.6200

Buy Stop 0.6390. Stop-Loss 0.6320. Take-Profit 0.6425, 0.6443, 0.6490

170919-NU-D.png


170919-NU-H4.png


*) For up-to-date and detailed analytics and news on the forex market visit Tifia Forex Broker website tifia.com
 
USD/CAD: Fed meeting and rates

09/18/2019

Current Dynamics


The US dollar returns its previously lost positions, while commodity currencies are falling in price amid an escalation of the US-China trade conflict.

On Tuesday, USD / CAD again tested the local resistance level of 1.3300. Above the support level of 1.3245 (EMA200 on the daily chart), the long-term positive dynamics of USD / CAD prevails and long positions are preferred.

In the event of a breakdown of the local resistance level of 1.3345 (August highs) USD / CAD will go towards the local resistance levels 1.3435, 1.3452 (Fibonacci level 23.6% of downward correction to the pair's growth in the global uptrend since September 2012 and the level of 0.9700), 1.3465, 1.3520, 1.3560 (highs of the year).

In an alternative scenario, the signal for the resumption of short positions will be a breakdown of the short-term support level 1.3233 (ЕМА200 on the 1-hour chart).

The objectives of the decline are local support levels 1.3182, 1.3138.

A breakdown of these levels will trigger a further decline with targets at support levels 1.3020, 1.2880 (EMA200 on the weekly chart).

Today, the focus of traders is the Fed meeting. The acceleration of inflation in the United States may prompt the Fed to report a limited space for lower interest rates in the future.

According to CME Group, investors estimate the likelihood of another rate cut this year (after lowering it on Wednesday) at 58% against 93% a month ago.

If the leaders of the central bank nevertheless signal the next rate cut this year, the US stock market will receive a powerful incentive for further growth, and the dollar may drop sharply.

Otherwise (if the Fed reduces the rate by 0.25%, but does not give a signal about a further reduction in the rate), the dollar, after a short-term reduction, may go on to increase.

The decision on the rate will be published today at 18:00, and the Fed press conference will begin at 18:30 (GMT).

Support Levels: 1.3258, 1.3245, 1.3238, 1.3233, 1.3182, 1.3138, 1.3020, 1.2975, 1.2880

Resistance Levels: 1.3300, 1.3345, 1.3435, 1.3452, 1.3465, 1.3520, 1.3560, 1.3600, 1.3660


Trading Scenarios


Sell Stop 1.3230. Stop-Loss 1.3310. Take-Profit 1.3182, 1.3138, 1.3020, 1.2975, 1.2880

Buy in the market. Stop-Loss 1.3230. Take-Profit 1.3300, 1.3345, 1.3435, 1.3452, 1.3465, 1.3520, 1.3560

180919-UC-D.png


180919-UC-H4.png


*) For up-to-date and detailed analytics and news on the forex market visit Tifia Forex Broker website tifia.com
 
GBP/USD: Current dynamics

09/19/2019


On the eve of the meeting of the Bank of England, the pound and GBP / USD are trading higher getting support from the reduced risks of the “hard” Brexit and positive macro statistics.

Earlier this month, the pound also received support after the publication of positive macro statistics, indicating a decrease in unemployment in the UK in May-July to 3.8% from 3.9% in April-June. The average earnings excluding bonuses in May-July increased by 3.8%, which is higher than the forecast of 3.7%, although lower than the indicator of April-June 3.9%.

The growth of British income is a positive factor for the pound, since it speaks in favor of an increase in spending on personal consumption and, accordingly, is an inflationary indicator.

On Tuesday, the GBP / USD pair reached a local and 2-month high near 1.2530 (June lows), through which the upper border of the descending channel on the daily chart passes.

A breakthrough of this resistance level will open the way for the growth of GBP / USD in the zone of resistance levels 1.2565 (ЕМА144 on the daily chart), 1.2660 (ЕМА200 on the daily chart).

In case of breakdown of the support levels 1.2400 (ЕМА200 on the 1-hour chart), 1.2310 (ЕМА200 on the 4-hour chart), the bearish GBP / USD trend will resume.

The current goal of the decline is the support level of 1.2000 (2017 lows and the Fibonacci level 0% of the correction to decline of the GBP / USD pair in the wave that began in July 2014 near the level of 1.7200).

The intrigue regarding the decisions of the Bank of England and its further actions remains. You must be prepared for a sharp increase in volatility in pound trading after 11:00 (GMT), when the Bank of England decision on rates will be published, as well as the minutes from this meeting of the bank.

Support Levels: 1.2400, 1.2310, 1.2270, 1.2255, 1.2200, 1.2175, 1.2150, 1.2100, 1.2000

Resistance Levels: 1.2530, 1.2565, 1.2660


Trading Scenarios


Sell Stop 1.2390. Stop-Loss 1.2540. Take-Profit 1.2310, 1.2270, 1.2255, 1.2200, 1.2175, 1.2150, 1.2100, 1.2000

Buy Stop 1.2540. Stop-Loss 1.2390. Take-Profit 1.2565, 1.2660

DXY.png


190919-GU-D.png


190919-GU-H1.png


*) For up-to-date and detailed analytics and news on the forex market visit Tifia Forex Broker website tifia.com
 
WTI: positive dynamics prevail

09/20/2019


After media reports that last Saturday oil refineries in Saudi Arabia were attacked by terrorist's drones, oil prices rose sharply. WTI oil futures on Nymex hit $ 63.34 a barrel against Friday's close of $ 60.61.

The price of WTI crude oil rose sharply, approaching a strong resistance level of 63.50 (Fibonacci 61.8% of the upward correction to the fall from the highs of the last few years near 76.80 to the support level near 42.15, as well as the upper border of the ascending channel on the daily chart )

Saudi officials said the kingdom intends to start importing crude oil and petroleum products to restore production.

Positive momentum prevails. OPEC’s policy of limiting production, increasing tensions in the Middle East, reducing the likelihood of improved US-Iran relations, and the vulnerability of Saudi oil infrastructure are leading to higher prices.

Today, oil market participants will follow the publication (at 17:00 GMT) of the weekly report of the American oilfield services company Baker Hughes on the number of active drilling rigs in the United States. If the report again indicates a decrease in the number of such installations, then this may give a short-term positive impetus to prices.

A breakdown of the resistance level of 59.50 (Fibonacci level of 50%) will strengthen the bullish trend of WTI and direct the price to the resistance level of 60.90 (July highs) and further towards the upper border of the ascending channel on the daily chart and marks 63.50, 64.40.

In an alternative scenario, the first signal to resume sales will be a breakdown of the support level of 58.27. The long-term reduction target is located at the support level of 42.15 (Fibonacci level of 0% and December 2018 lows).

So far, and above the support level of 57.80, long positions are preferred.

Support Levels: 58.27, 57.80, 57.30, 56.80, 55.40, 55.00, 53.00, 50.30, 49.00, 42.15

Resistance Levels: 59.50, 60.90, 63.50, 64.40, 66.50


Trading Recommendations


Sell Stop 57.70. Stop-Loss 58.40. Take-Profit 57.30, 56.80, 55.40, 55.00, 53.00, 50.30

Buy Stop 59.10. Stop-Loss 58.10. Take-Profit 59.50, 60.90, 63.50, 64.40, 66.50

200919-WTI-D.png


200919-WTI-H1.png


*) For up-to-date and detailed analytics and news on the forex market visit Tifia Forex Broker website tifia.com
 
Back
Top