2023 Market Forecast by Solid ECN

USDCAD - Growth is possible.

On the daily chart, the upward fifth wave of the higher level 5 develops, within which the wave (3) of 5 forms. Now, the wave 5 of (3) is developing, within which the wave i of 5 has appeared, a local correction has ended as the wave ii of 5, and the formation of the wave iii of 5 is starting.

If the assumption is correct, the USDCAD pair will grow to the area of 1.3978 – 1.45. In this scenario, critical stop loss level is 1.3315.

usdcad.png
 

USDCHF - Growth is possible

On the daily chart, the third wave of the higher level 3 develops, within which the upward first wave (1) of 3 formed, and a downward correction ended as the second wave (2) of 3. Now, the wave C of (2) has ended, and the development of the upward wave (3) of 3 has started, within which the first entry wave of the lower level i of 1 of (3) has formed.

If the assumption is correct, the USDCHF pair will grow to the area of 0.99 – 1.0147. In this scenario, critical stop loss level is 0.9164.

 
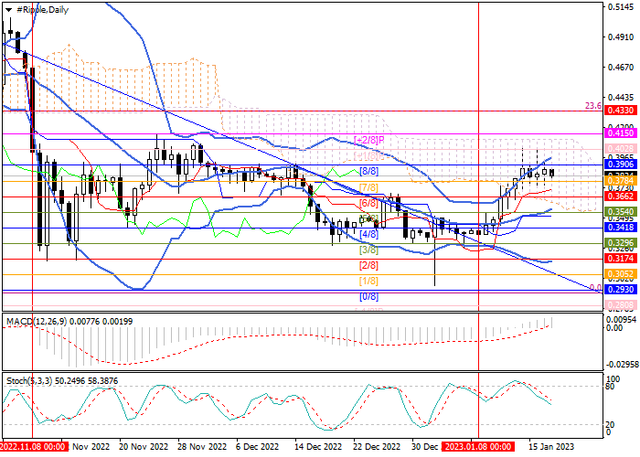
XRPUSD - The pair has stabilized after a week of growth

In general, investor enthusiasm has somewhat weakened, and the cryptocurrency market has stabilized in anticipation of new drivers of movement. Currently, further price growth is hindered by uncertainty over the US Securities and Exchange Commission (SEC) lawsuit against Ripple. Recall that the regulator insists that the XRP token is an unregistered security, which the company does not agree with. Now the parties have submitted to the court the final versions of their arguments, but no decision has been made yet. The cryptocurrency community estimates Ripple's chances of a successful outcome of the case as high, but even in this case, new lawsuits by the department against the company are not excluded.

Investors are also concerned about the new management of the bankrupt FTX exchange gaining access to assets worth 5.5B dollars, a certain share of which are XRP tokens. It is assumed that they will be used to compensate customers for losses and can be sold, which will put additional pressure on the pair.

xrp.png


The key for the "bulls" is the level of 0.3906 (Murray level [8/8]), consolidation above which will give the prospect of further growth to the area of 0.4150 (Murray level [+2/8]) and 0.4330 (Fibo retracement 23.6%). The resumption of a serious decline should be expected when the 0.3540 mark is broken down (Murray level [5/8], the middle line of the Bollinger Bands), and in this case the quotes will be able to reach 0.3296 (Murray level [3/8]), 0.3174 (Murray level [2/8]).

Resistance levels: 0.3906, 0.4150, 0.4330 | Support levels: 0.3540, 0.3296, 0.3174​
 
NZDUSD Touches the Second Target

The NZDUSD pair managed to touch our second waited target at 0.6510 and bounced downwards clearly from there, to test the intraday bullish channel’s support line now, accompanied by witnessing positive signals through stochastic, waiting to motivate the price to resume the bullish wave that its next target reaches 0.6600.

nzdusd.png


Therefore, we suggest the continuation of the main positive scenario, noting that failing to consolidate above 0.6415 will put the price under additional negative pressure that targets 0.6345 followed by 0.6275 levels as next main stations. The expected trading range for today is between 0.6360 support and 0.6500 resistance​
 
USDCAD Achieves Clear Gains

The USDCAD pair rallied upwards yesterday to breach 1.2420 and touch the key resistance 1.3500, noticing that the price finds difficulty to surpass this level, accompanied by witnessing negative signals through stochastic, which supports the chances of bouncing bearishly to resume the bearish trend, which targets 1.3415 followed by 1.3350 levels as next negative stations.

usdcad.png


Therefore, we expect to witness bearish bias in the upcoming sessions unless the price managed to breach 1.3500 and hold with a daily close above it. The expected trading range for today is between 1.3415 support and 1.3560 resistance.​
 
AUDUSD - Growth is possible.

On the daily chart, the first wave of the higher level (1) formed, a downward correction formed as the second wave (2), and the third wave (3) develops, within which the first entry wave of the lower level i of 1 of (3) forms. Now, the wave (iii) of i has ended, a local correction has formed as the wave (iv) of i, and the wave (v) of i is forming.

If the assumption is correct, the AUDUSD pair will grow to the area of 0.7200–0.7464. In this scenario, critical stop loss level is 0.6860.

audusd.png
 
Chart of the Day - EURTRY

Norges Bank decided to leave rates unchanged at a meeting today but there is one more rate decision to be announced today. Central Bank of the Republic of Turkey will announce its rate decision at 11:00 am GMT. Market expects no change from CBRT with one-week repo rate staying unchanged at 9:00 am GMT. The Bank said that it has ended the rate cut cycle after a 150 bp rate cut in November and indeed rates stayed unchanged at the December meeting later on. While Turkey is facing massive inflation, there is a view that rates may stay unchanged until mid-2023 when elections in Turkey take place. However, should the Bank make a move at one of the coming meetings, it is more likely to be another cut rather than hike.

eurtry.png


Apart from CBRT rate decisions, traders will also get a chance to take a look at ECB minutes. ECB hiked interest rates by 50 basis points at the latest meeting, slowing the pace of hikes from previous 75 bps. Bank noted that rates will have to rise further significantly and a balance sheet reduction schedule was also announced. While there were some rather dovish comments from ECB members in recent days, minutes may not reflect it as they relate to the December 15, 2022 meeting.

Taking a look at EURTRY chart at the H1 interval, we can see that the pair has bounced off the 200-hour moving average (purple line) and climbed above the 20.28 swing area later on. The nearest resistance zone to watch can be found in the 20.42 area and is marked with recent local highs. Should CBRT surprised with a rather unlikely rate cut, the pair may quickly jump above the aforementioned 20.42 zone and look towards all-time highs from late-2021 in the 20.68 area.​
 
USDCAD - macroeconomic statistics did not support the position of the Canadian currency

The industrial goods price index lost 1.1% in December, exceeding the previous month's –0.5% decline, with annual growth slowing to 7.6% from 9.4% earlier. The value for commodities declined 3.1% after the –0.8% correction in November and from 7.9% to 7.5% YoY. The main reason for the negative dynamics is the fall in oil prices on world exchanges, where quotes of the benchmark Brent Crude Oil fell to 86.00.

The US dollar fell below the key support level of 102.000 in the USD Index against the negative statistics from the housing market: the volume of construction of new houses in December amounted to 1.382M, which was lower than 1.401M earlier, and the number of building permits issued amounted to 1.330M compared to 1.351M in November. Investors ignored data on initial jobless claims, which fell to 190.0K from 205.0K in a week.

usdcad.png


On the daily chart, the trading instrument is growing within the global Triangle pattern with dynamic boundaries 1.3620–1.3300 towards the resistance line, and the technical indicators maintain a sell signal and hint at a correction.

Resistance levels: 1.3523, 1.3697 | Support levels: 1.3409, 1.3224​
 
EURGBP Takes Advantage of the Additional Support Line Stability

The EURGBP pair faced additional negative pressures to form strong negative waves and suffer some losses by crawling towards 0.8722, to face additional support and settle above it, noting that the main stability within the bullish channel that appears on the chart allows us to wait to gather the additional positive momentum to manage to form bullish waves and target 0.8820 followed by pressing on 0.8880 barrier in order to find a way to resume the bullish rally in the upcoming period.

eurgbp.png


The expected trading range for today is between 0.8740 and 0.8820.​
 
BTCUSD - The pair's upside potential remains

Positive sentiment associated with monetary factors still prevails. Investors are confident that against the backdrop of declining inflationary pressures, the US regulator will start raising interest rates less rapidly, reducing the increment to 25 basis points from 50 basis points. These actions should lead to a decrease in support for the US currency and at the same time reduce the likelihood of the US economy going into recession, which increases the risk appetite of investors.

btc.png


The price corrected to the level of 22500 (Murrey level [6/8]), a breakdown of which will give the prospect of developing a decline to the levels of 21250 (Murrey level [5/8], Fibonacci retracement 61.8%) and 20000 (Murrey level [4/8], Fibonacci retracement 38.2%). The key level for the "bulls" remains the level of 23400, consolidation above which will ensure growth to the levels of 25000 (Murrey level [8/8]) and 26250 (Murrey level [+1/8]).

Resistance levels: 23400, 25000, 26250 | Support levels: 22500, 21250, 20000​
 
Back
Top