4 hour Anchor

Status
Not open for further replies.
:)

B4 i can really getting happy 0.9848/0.9850 need to be breached on good news or bad news from the CAD posted earlier. then i will double up. PLease be aware that this could also be a 5th wave down from a corrective 4th wave.

Mr Price apporaching daily resistance @ 0.9845 so will see
pls check the news update on timelesstrading.blogspot.com usdcad bullish bat update
 

Attachments

  • USDCADBullishBAT240min23032011.jpg
    USDCADBullishBAT240min23032011.jpg
    173.3 KB · Views: 13
STERLING : TTrading Preference: Short positions below 1.6055 with targets @ 1.575 & 1.5350 in extension.

Alternative scenario: Above 1.6100 look for further upside with 1.62 as targets.

Comment: the pair remains within a bearish channel and is challenging its support.
also Be/co We are so close to the pervious support now
turned Resisitnace senitment can change very quickly and what was is no longer what is

If 1.5977 Daily Support Remains Broken
EXTABLISH SHORTS
-----------------------------------------------------------------------------------------------------------------------------------
EURUSD:
TTrading preference: Short positions below 1.4110 with targets @ 1.3950 & 1.3900 in extension.

Alternative scenario: Above 1.4110 back with the rising trangle
look for further upside with 1.4160 & 1.42 as targets.

Comment:
Eur Has played out our pervious bearish butterfly and is at crucial pivot area as there has been another possiable bullish Butterfly but not as harmoniious as the bearish BUtterfly any price are still below 55DMA so we will stay short untill may be 1.4110 is re captured untill then we will stay on the sell side which remains under pressure and also Pair is approaching its next support as the RSI is weak.
Prices Stuck inbetween 200DMA and 90DMA
-----------------------------------------------------------------------------------------------------------------------------------

AUDUSD:
TTrading preference: Long positions above 1.024 with targets @ 1.0315 & 1.0355 in extension.

Alternative intraday scenario: Below 1.024 look for further downside with 1.0195 & 1.015 as targets.

Comment: As long as the pair remains within its upside channel, look for further advance. there is a slight break of previous dotted trend line but i will use this a a warning on a conformation of a small correction to the 31/12/2010 Daily high resistance turn Support.
as we still above pivot and 55DMA averages we will remain on the long side of the channel


-----------------------------------------------------------------------------------------------------------------------------------


USDCHF: Will the usdchf held its 0.8800 Support and has headed up since we last looked at this a week ago still looking ofr an upside break of 0.920 93.00 then futher upisde to 0.9350 the 0.9600

Long positions above 0.9155 buying Zone with targets @ 0.9300 then back dwn to 0.925 which will be the 4th wave dwn if the holds then 5th wave advance ment will be Play 0.9350/0.9600 in extension.

Alternative scenario: Below 0.9155 look for further downside with 0.9115 & 0.907 as targets.

Comment/ and conerns : the pair is pulling back on its support ahead of a rebound.


-----------------------------------------------------------------------------------------------------------------------------------


USDCAD: i reall think this pair has potenial mainly becasue on of the Bullish Bat as price test the spring board floor for a possable major reversal so for now

TTradnig preference: Long positions above 0.9790 with targets @ 0.9845 & 0.9865 in extension.

TTrading Alternative scenario: Below 0.978 look for further downside with 0.973 & 0.9705 as targets. support zone as we range trade between 0.9810 and 0.9730

Comment and conerns: The break above 0.9810 is a positive signal that has opened a path to 0.9845 as Prices pull back into Bullish BAT support Zone trying to extablissh a bottom personally i would like price to stay above the 21 DMA but if i am really aggressive i could initate a light trade in the support zone .

---------------------------------------------------------------------------------------------------------------------------------------------------------------------------------

USDJPY : See previous Chart T1 200DMA 82.30 falling Mr Price apporaches falling trend line resistance @ 81.95 a break above above 200DMA then UP UP Up
:)
 

Attachments

  • AUDUSD28032011.jpg
    AUDUSD28032011.jpg
    141.3 KB · Views: 9
  • EURUSD28032011.jpg
    EURUSD28032011.jpg
    179.2 KB · Views: 11
  • GBPUSD28032011.jpg
    GBPUSD28032011.jpg
    169.4 KB · Views: 10
  • USDCAD28032011.jpg
    USDCAD28032011.jpg
    185.5 KB · Views: 10
  • USDCHF28032011.jpg
    USDCHF28032011.jpg
    143.6 KB · Views: 10
Only a break of 1.4115 the break of the falliong trend line and the abc elwave corrective dwn is taken out can we consider going long
 

Attachments

  • EURUSD28032011.jpg
    EURUSD28032011.jpg
    160.7 KB · Views: 18
EURUSD Updated

As pointed out in pervious Eurusd chart only long above 55DMA on the condition that 1.4150 was taken out. during the trade prices continued to buy up and failed as i spotted an hrly Gartley sell( pls check blog or twitter where i post the hrly entries Timeless77 timelesstrading.blogspot.com)
This signaled to me that this could be a possiable correction of the 1.420 high l thought to myself although there has been a 4hr buy up from the Asian session and early European morning the trend was still bearish, exspecially after the bulls attempted to challenge the dwn trend as they run out of strem at 1.4146.

I then checked my intraday strength indictors RSi and stochastics as they approached the over brought region and failed. The rally attempt by this session bulls simply was not enough at this time to take out the 1.42 barricade and hit its pervious resistance . So i sold it and Mr Price turned south wards.

The problems with the portugal and the euro defict is still pending and the US has posted some recent gains. So on that biase i applauded the Gartely sell signal to enter short coupled with possiable elwave abc short.
Alternatively a break of 1.4028 will need to confirm futher declines we still could be in a possiable 4th wavve up. As i know 4th waves can be very choppy also check usdchf trade

Thanks for taking the time to Read
Bless You
 

Attachments

  • EURUSD29032011UPDATE.jpg
    EURUSD29032011UPDATE.jpg
    134.5 KB · Views: 11
Last edited:
to start of with there was a Bearish Gartley on the 4 Hours However, according to the 55DMA 4hr Anchor Strategy
We have to use this as a retracement signal to go long.
Mr price Holding support @ 0.9130 holding the Poseidon base trend line so offers in the Market being found.
caution still watching How Mr Price reacts
...........................................................................

End of the European session start of US session
Currently Mr price is a 4th wave Decline to supprt @ 0.915 with a 5th wave Rally ahead Targeting. 0.9350
Our bias is to go long as prices are above the 55DMA 4hr Moving average
0.9141
Prices have also rallied above he 1hr 55DMA so I placed a buy at 0.91682 stop @ 0.9140
Prices rallied but was halted by the US Consumer confidence
which was diappointing. banked 50% Now at breakeven.
With the 50% risk free trade i have left on.
@ the moment I am suggesting that 38.2% will be cleared Targeting the 0.9240 and may be even higher to the back of the Andrew pichfork trend line
4hr projection and break out. still May be this will happen who knows if the USDX index continues to post gaines then the likely hood is possiable anyway still risk free now and banked 50% so i'm happy.:)

pls see 4 hr Anchor 5 currency update posted at the begining of every week for the weeks intraday plays

Thank you for taking the time to read As God has MAde us Wealth and Abundant by Nature.
 

Attachments

  • USDCHFHRLY29032011.jpg
    USDCHFHRLY29032011.jpg
    166.5 KB · Views: 11
Last edited:
Well i've been carrying out this new method of play and it seeem to be working out nicely
At the begining of the week from Sunday for the weekly 4hr Anchor weekly plays,

1stly i'll mention to you my screen set up's
The 1st computer screen is the Anchor Screen i have the 6 USD currency's displayed on that screen
Theses are then analysed, building the case for all of the 6 USD pairs on the 4 hr Tiime frame with possiable senerios.

I also in the backfore ground have the USDX

Then on my excution screen i have the same six pairs on an hrly Time frame
I then build a case for each of the six pairs using the Anchor as a reference Point, connecting the dots

i Then Check up on up and and coming newsevent or fundermental releases.

Then i wait for trade set ups that i recognise always referring back to the plan if i get lost.

Plan, FolloW, Action,Review

I then checked my pervious 4hr journal notes and then matched my hrly trades to see if i was following what i planned to do. YES!! YES!! Plan, Follow, Action,Review.

But i have to be so mentally strong!! if not i find that my ego takes over and i start to sabbtage My self as i stray from the path of Englightenment to the dark side. anyway back to Earth

Eur worked out perfectly and the USD/CHF is still working on a risk free bases brillaint so far. just need to keep it up stay disciplined and focused, never trade when i'm tired manage my risk, always bank break even when unclear.

Might need some help in tracking as the oppotunites presented it's self. Anyway i just need to take my time and place an ordder in that shouldn't really be a problem because the plan of execution has already been made. i think it was the thought of being in to many trades and mangeing them.

Which is why i like using the 4hr time frame because it give me time to access, things and judge market senitment.

No Fear!!!!
 
Last edited:
Index of Services
Actual -0.50%
Forecast -0.90%
Previous -0.60% &
CBI Distributive Trades Survey
Actual 15.00
Forecast -1.00
Previous 6.00
What next then


The US
The ADP National Employment Report
Actual
forecast 210.00k
Previous 217.00k


The ADP National Employment Report is a measure of the monthly change of nonfarm private employment, based on a subset of aggregated and anonymous payroll data that represents approximately 400,000 U.S. business clients. This release, 2 days before the government-released employment data , is a good predictive to the government's non-farm payrolls data. The change in this indicator can be very volatile.
A higher than expected reading should be taken as positive/bullish for the USD, while a lower than expected reading should be taken as negative/bearish for the USD.

Then the GBP
The Gfk Consumer Confidence

The Gfk Consumer Confidence measures the level of consumer confidence in economic activity. It is a leading indicator as it can predict the consumer spending, which is a major part in the total economic activity. Higher readings point to higher consumer optimism.
A higher than expected reading should be taken as positive/bullish for the GBP, while a lower than expected read should be taken as negative/bearish for the GBP.
Actual -
Forecast 210.00K
Previous 217.00K
see chart you already have the 4hr Chart if not vist blog
Timeless Trading
 
Hello!!
I have a hrly and 4hr Gartley sell on the Pound But Momemtum Buying from the double bottom in the Pound from the good news earlier
Index services
and the CBI distributive trades surevy

I have an wave Count that suggest a possiable Minor 3rd wave up ab-c Up

What shall i do ?

Maybe i should waite till it clears 1.6150


see 4 hour Anchor Journal :)
 

Attachments

  • GBPUSDhrlyGartley30032011.jpg
    GBPUSDhrlyGartley30032011.jpg
    157.3 KB · Views: 9
4 HR Anchor Strategy KISS (Keeping it Stupidly Simple )

In my opinion the 4hr time frame is the most powerful of all the time frame for swing traders and it stands in between the daily and higher time frames and the intraday time frame acting as a steering wheel of the ship as we navigator through the markets.
I've tried to do my best and combine the best tools the describe the 4hr anchor Swing strategy. Using a triple screen trading system) once the

What you need: ( these can be Retrieved from mq4 website on your meta trader platform. if not email me and i'll send it to you.)
Multiple time frame stochastic called stoc-2b or stoc
Multiple time frame Fractal ( from Forex Factory brilliant website
Mac/D
Moving average 8DEMA (Daily exponential moving average )
Moving average 50 DMA (Daily moving average)
Auto pivots


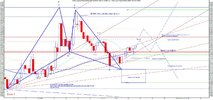
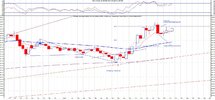
Daily Bullish stochastics will CASCADE UP WITH 4 HR STOCH OR WAITE FOR 4 HR FRACTURAL SUPPORT SIGNAL. CONFIRMED MOVE ABOVE 50 % OR WAITE FOR 4HR FOR STOCH RETRACEMENT WITH DAILY STOCH STOCHASTICS UP.
Daily Bearish stochastics will CASCADE DOWN WITH 4 HR STOCH OR WAITE FOR 4 HR FRACTURAL RESISTANCE SIGNAL. CONFIRMED MOVE BELOW 50 % OR WAITE 4HR FOR STOCH RETRACEMENT AS THE DAILY IS DOWN.
 Buying a currency is only confirmed with a Daily 8 DMA CROSS OVER
Earlier entries are ‘4HR PRICE CROSS OVER 8 DMA
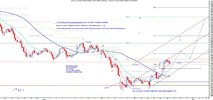
 4hr Bullish Price Cross below 8DeMA, But above 55DMA, correctively bullish,
 4hr Bullish Price cross over 8DeMA and above 55DMA, probability increases to the upside.
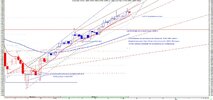
 4hr Bullish Stochastics turning from an oversold position SYNCH/ rising with 1hrly.

 On the 1hr Entry Frame apply M&M ( Market Maker Technique) 4hr Stochastic leads. Allow 1hr to finish cycle and become over-sold. and will come meet the yellow 4hr Line up or they will both move together and rise
to the Daily Green line UP
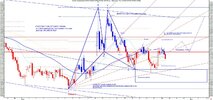
4hr Support Fractural shown on the 1hr time frame (Green) With an Hrly buy signal to confirm synchronization. These are the best set ups Call True Swing............
 Entry screen......................
1st wait for Candle Stick Confirmation, Closure of price above 8DEMA,
High volume Trend bullish.
4hr fractural and hourly buy signal brilliant (True swing)

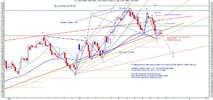
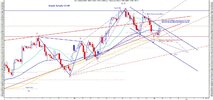
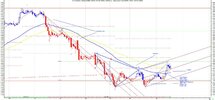
Bearish Daily 4hr Anchor Swing Strategy. Note: Ideally we want Mr Price to stay below 55DMA.
Therefore observe, Patiently, Marking Daily Support and Resistance.

 Selling a currency is confirmed with a Daily Price crossover 8 DMA CROSS OVER
 Earlier entries are ‘4HR PRICE CROSS OVER, 8DMA’
 4hr Bearish Price Cross above 8DeMA, But below 55DMA, correctively Bearish,
 4hr Bearish Price cross over 8DeMA and below 55DMA, probability increases to the down side.
 4rh Bearish stochastics bearish from and overbought position synchronization with falling hrly
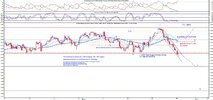
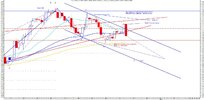
 Entry Screen

1hr Time Frame Apply M&M ( Market Maker Techique ) 4hr Stoch leads 1hr. Allow 1hr to finish cycle and become over brought and will come meet the 4hrs yellow line Down
4hr Resistance Fractural shown on the 1hr time frame . Hrly Sell signal to confirm synchronization. These are the best set ups to swing trade...............................................................
1st wait for Candle Stick Confirmation, Closure of price under 8DEMA, high volume
Trend bearish.......4hr fractural and hourly sell signal brilliant
Weekly leads Daily leads 4hrs, 4hrs leads 1hrly and if they out of sychronixation no trade. Market may be in consolidation. syncronsation error.

Note technique can be applied to the daily time Frame
Skills
Harmonics
Eillot Wave analysis
Candle stick identification
patterns i.e Trangle and flags
Poseidon (Andrewd Pitch fork trading)
Hope this helps::)
 
Last edited:
Status
Not open for further replies.
Back
Top