Sive Morten
Special Consultant to the FPA
- Messages
- 18,644
Fundamentals
This week gold market has lack of driving factors, which results in choppy and slow price action. Next week it should be more interesting as Fed and BoE statements come on first stage, as well as US GDP release.
The only activity has come on Friday when it has become clear that new virus starts spreading across the Globe. Gold jumped to a more than two-week high on Friday as the latest updates on the coronavirus dented risk sentiment, and prompted a flight into safe-haven assets.
“The entire market just switched into risk-off mood,” said Bart Melek, head of commodity strategies at TD Securities.
The U.S. Centers for Disease Control and Prevention confirmed a second U.S. case of the coronavirus in the country, denting appetite for riskier assets. This comes after the World Health Organization (WHO) designated the coronavirus outbreak an emergency for China but not for the rest of the world currently, and added it was tracking it “every minute.” The spread of the virus ahead of this weekend’s Lunar New Year, a peak period of travel in China has kept investors concerned.
“Mounting concerns about the virus ahead of the weekend are driving accumulation of gold. ... Clearly, the headlines will get worse before they get better,” said Tai Wong, head of base and precious metals derivatives trading at BMO. Further developments surrounding the outbreak and a U.S. Federal Reserve meeting on Jan. 28-29 will be key drivers for gold into next week, Wong added.
Keeping with a global trend of accommodative monetary policy, the European Central Bank left rates unchanged on Thursday. Gold is highly sensitive to any reduction in interest rates, which decreases the opportunity cost of holding non-yielding bullion. Also helping non-interest-bearing bullion, U.S. 10-year Treasury yields fell to a two-week low. Holdings of the world’s largest gold-backed exchange-traded fund, SPDR Gold Trust, rose 0.2% to 900.58 tonnes on Thursday.
CFTC Data
SPDR Fund statistics shows weak reaction on Middle East tensions. While speculators and news agencies have tried to blow this fire as hot as possible, it seems that long-term investors understand that hardly this will lead to real conflict. As a result, even on 1600 gold rally - overall position has not changed significantly. Currently situation similar a bit to 2018 when performance of SPDR reserves were the same - 1 week dive before the rally:

Source: SPDR Fund, FPA calculations
But at the same time this was a huge difference as in Sep-Nov 2018 net gold position first time ever has turned bearish, while now it stands at all time high:

Source: cftc.gov
Charting by Investing.com
This could explain why SPDR Fund position doesn't grow faster. It happens because investors already keep longs at maximum levels. All time highs of SPDR fund dated Dec 2012, when it storage was around 1353 tonnes. But, since 2015, when CFTC published, its maximum stands around 982 tonnes, while right now it stands about 900 tonnes. It makes possible some upside action on gold, but upside potential is limited right now. This is the same conclusion that we've made last week as well.
Recently World Gold Council released 2020 outlook report and they suggest that gold should show moderate upside tendency this year due low interest rates and economical growth. Here is some extractions from their report.
We expect that many of the global dynamics seeded over the past few years will remain generally supportive for gold in 2020. In particular, we believe that:
• Financial and geopolitical uncertainty combined with low interest rates will likely bolster gold investment demand
• Net gold purchases by central banks will likely remain robust even if they are lower than the record highs seen in recent quarters
• Momentum and speculative positioning may keep gold price volatility elevated
• And that gold price volatility, as well as expectations of weaker economic growth, may result in softer consumer demand near term but structural economic reforms in India and China will support demand in the long term.
Looking ahead, we believe investors – including central banks – will face an increasing set of geopolitical concerns, while many pre-existing ones will likely be pushed back rather than being resolved. In addition, the very low level of interest rates worldwide will likely keep stock prices high and valuations at extreme levels. And although investors may not step away from risk assets, anecdotal evidence suggests they are increasing exposure to safe-haven assets like gold as a means to hedge their portfolios.
One of the key drivers of gold, especially in the short and medium term, is the opportunity cost of holding it relative to other assets, such as short-dated bonds. Unlike bonds, gold does not pay interest or dividends because it does not have credit risk. This perceived lack of yield can deter some investors. But in an environment where a whopping 90% of developed market sovereign debt is trading with negative real rates, we believe the opportunity cost of gold almost goes away. And it may even provide what can be seen as a positive “cost of carry” relative to bonds.
This is further evidenced by the strong positive correlation between the amount of debt and price of gold over the past four years (Chart 3). To some degree this illustrates the erosion of confidence in fiat currencies due to monetary intervention.

And the low rate environment is unlikely to change any time soon. Many central banks – the highest number since the global financial crisis – are cutting rates, expanding or implementing quantitative (or quasi-quantitative) easing and, in some instances, doing both. In fact, gold has historically performed well in the 12- to 24-month period following policy shifts from tightening to “on-hold” or “easing” – the environment in which we currently find ourselves. And, historically, when real rates have been negative, gold’s average monthly returns have been twice as high as the long-term average. Even slightly positive real interest rates may not push gold prices down.
Market surveys indicate that the majority of economists expect positive growth in 2020 for most countries, with a few forecasting contractions in major economies by 2021 or 2022. However, median forecasts also show an expectation of softer global economic growth relative to 2019. This, combined with gold price volatility at or above current levels, may discourage jewellery consumers and cause technology demand to soften.
As the gold price significantly rose in 2019 so did volatility, but, similarly to other assets, it remains well below its long-term trend (Chart 4). And we don’t anticipate a reduction in gold volatility near term. Should the economic and political environment deteriorate, it may even rise, especially as gold volatility historically exhibits a positive skew in such circumstances, tending to increase as stocks pull back.

Gold rallied by 4% in December 2019, increasing by an additional 6% by 7 January 2020. While we believe that there are various reasons for this move, tensions in the Middle East linked to the US-Iran confrontation ultimately pushed the gold price to an almost seven-year high in early January. Subsequent comments by President Trump aimed to ease concerns, pushing the price down to the US$1,560/oz-US$1,550/oz level as of 10 January 2020. Yet, gold still remains still 2.6% higher relative to the end of 2019.4
We expect that investor positioning related to this specific event will likely influence gold’s performance in the near term. But over the medium term, broader financial and geopolitical uncertainty and developments in monetary policy will play a more important role. We analysed the performance of gold as implied by four different hypothetical macro-economic scenarios provided by Oxford Economics. These included:
• a global deceleration (their base-case scenario)
• a US-led recession
• a more pronounced slowdown in China
• an economic improvement in emerging markets.
The results of the analysis suggest that, in general, gold may see a positive performance in 2020. Some of the scenarios – with the exception of an economic upturn in emerging markets – could result in lower consumer demand. But the dampening effect of consumer demand on price performance will likely be offset by potentially robust investment demand on the back of deteriorating credit conditions and stable to lower interest rates.
Technical
Monthly
Monthly picture mostly stands the same. Middle East political events help gold to hit extended weekly and monthly targets. Particular speaking, here, price is testing major monthly 5/8 Fib resistance level. And gold missed XOP just for 20$. It means that our next target here is still 1650.
At the same time, take a look what we have... Gold stands at major monthly resistance level, weekly Overbought, net long position is extremely high and now we have some relief in tensions on Middle East. This combination shifts advantage in favor of retracement and diminish chances on immediate upward action and challenge of our major 1650 target.
Here, on monthly chart we already see pullback out from the level. In general gold has pretty much room for pullback and keeping overall context intact. 40 - 50 $ downside action should not hurt upside scenario. As more extended downside target, if somehow it will happen - we could point YPP at 1445 area.
Monthly chart tells that now it is not the moment yet for taking investing long position on gold market.

Weekly
On weekly chart huge doji pattern plays central role in analysis. As we've said, from technical point of view - gold price will follow to direction of doji breakout side. From this point of view, the key moment is failed attempt of downside breakout last week, when price has tested doji's lows. It means that gold could spend more time in doji range and even show some upside action as it is not at overbought anymore - market easily could reach 1590 level.
Still, overall combination of existing driving factors suggest some advantage on bearish side as gold has no strong driving factors to start new rally above 1600 highs.
So here is the same conclusion. Despite some upside action that could happen on daily/intraday charts, here we do not want to take long-term bullish position now and will be watching for better entry levels. Any daily bullish setup will have just tactical, short-term purpose.
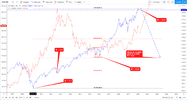
Potentially, as MACD lines stand at lower level compares to the top - we could get divergence and large H&S pattern. This is just a suggestion by far, but it doesn't seem absolutely impossible.

Daily
Daily chart shows no specific signals and patterns by far, but it confirms that market momentum is one of the most reliable and fundamental features in market mechanics. Whatever could happen, but previous strong momentum has to find the way to show itself. That is what we see right now. Recall, how doubtful was entry process and view on B&B setup. Nevertheless, market is going with this setup - slowly, choppy, but it is going. Now we stand near the destination point, where situation could change and new driving factors start impact the gold price.

Intraday
Here is our major setup for coming week. Price indeed has taken the shape of H&S pattern, but it was not sharp and it was extremely difficult to catch the right moment for entry. Besides, price action fluctuates too much with lack of driving factors.
Anyway, gold is coming to momentum trade's target, which is 1582 major 5/8 Fib resistance. There we also have H&S AB=CD target and WPR1. The latter, by the way, could also give us some clarity on this action. If market will turn down there, it confirms the retracement background of this action.
Completion of "222" Sell pattern will be setup to consider for bears.

On 1H chart upside action could be finalized by Butterfly "Sell" pattern, which 1.618 extension also coincides with major Fib resistance:

Conclusion:
This week we do not have big shifts for gold background. Coming Fed, BoE meetings and US GDP report could make significant impact in a lack of other factors. Long-term background on gold market stands bullish but suggests pullback due overextended investors' long position, relief in Middle East crisis and relatively positive economy statistics. Gold also in entering in seasonal bearish trend in January - February. Short-term setup is also creates bearish pattern and particular Fed meeting and GDP release could become the ones that trigger downside action.
This week gold market has lack of driving factors, which results in choppy and slow price action. Next week it should be more interesting as Fed and BoE statements come on first stage, as well as US GDP release.
The only activity has come on Friday when it has become clear that new virus starts spreading across the Globe. Gold jumped to a more than two-week high on Friday as the latest updates on the coronavirus dented risk sentiment, and prompted a flight into safe-haven assets.
“The entire market just switched into risk-off mood,” said Bart Melek, head of commodity strategies at TD Securities.
The U.S. Centers for Disease Control and Prevention confirmed a second U.S. case of the coronavirus in the country, denting appetite for riskier assets. This comes after the World Health Organization (WHO) designated the coronavirus outbreak an emergency for China but not for the rest of the world currently, and added it was tracking it “every minute.” The spread of the virus ahead of this weekend’s Lunar New Year, a peak period of travel in China has kept investors concerned.
“Mounting concerns about the virus ahead of the weekend are driving accumulation of gold. ... Clearly, the headlines will get worse before they get better,” said Tai Wong, head of base and precious metals derivatives trading at BMO. Further developments surrounding the outbreak and a U.S. Federal Reserve meeting on Jan. 28-29 will be key drivers for gold into next week, Wong added.
Keeping with a global trend of accommodative monetary policy, the European Central Bank left rates unchanged on Thursday. Gold is highly sensitive to any reduction in interest rates, which decreases the opportunity cost of holding non-yielding bullion. Also helping non-interest-bearing bullion, U.S. 10-year Treasury yields fell to a two-week low. Holdings of the world’s largest gold-backed exchange-traded fund, SPDR Gold Trust, rose 0.2% to 900.58 tonnes on Thursday.
CFTC Data
SPDR Fund statistics shows weak reaction on Middle East tensions. While speculators and news agencies have tried to blow this fire as hot as possible, it seems that long-term investors understand that hardly this will lead to real conflict. As a result, even on 1600 gold rally - overall position has not changed significantly. Currently situation similar a bit to 2018 when performance of SPDR reserves were the same - 1 week dive before the rally:
Source: SPDR Fund, FPA calculations
But at the same time this was a huge difference as in Sep-Nov 2018 net gold position first time ever has turned bearish, while now it stands at all time high:
Source: cftc.gov
Charting by Investing.com
This could explain why SPDR Fund position doesn't grow faster. It happens because investors already keep longs at maximum levels. All time highs of SPDR fund dated Dec 2012, when it storage was around 1353 tonnes. But, since 2015, when CFTC published, its maximum stands around 982 tonnes, while right now it stands about 900 tonnes. It makes possible some upside action on gold, but upside potential is limited right now. This is the same conclusion that we've made last week as well.
Recently World Gold Council released 2020 outlook report and they suggest that gold should show moderate upside tendency this year due low interest rates and economical growth. Here is some extractions from their report.
We expect that many of the global dynamics seeded over the past few years will remain generally supportive for gold in 2020. In particular, we believe that:
• Financial and geopolitical uncertainty combined with low interest rates will likely bolster gold investment demand
• Net gold purchases by central banks will likely remain robust even if they are lower than the record highs seen in recent quarters
• Momentum and speculative positioning may keep gold price volatility elevated
• And that gold price volatility, as well as expectations of weaker economic growth, may result in softer consumer demand near term but structural economic reforms in India and China will support demand in the long term.
Looking ahead, we believe investors – including central banks – will face an increasing set of geopolitical concerns, while many pre-existing ones will likely be pushed back rather than being resolved. In addition, the very low level of interest rates worldwide will likely keep stock prices high and valuations at extreme levels. And although investors may not step away from risk assets, anecdotal evidence suggests they are increasing exposure to safe-haven assets like gold as a means to hedge their portfolios.
One of the key drivers of gold, especially in the short and medium term, is the opportunity cost of holding it relative to other assets, such as short-dated bonds. Unlike bonds, gold does not pay interest or dividends because it does not have credit risk. This perceived lack of yield can deter some investors. But in an environment where a whopping 90% of developed market sovereign debt is trading with negative real rates, we believe the opportunity cost of gold almost goes away. And it may even provide what can be seen as a positive “cost of carry” relative to bonds.
This is further evidenced by the strong positive correlation between the amount of debt and price of gold over the past four years (Chart 3). To some degree this illustrates the erosion of confidence in fiat currencies due to monetary intervention.
And the low rate environment is unlikely to change any time soon. Many central banks – the highest number since the global financial crisis – are cutting rates, expanding or implementing quantitative (or quasi-quantitative) easing and, in some instances, doing both. In fact, gold has historically performed well in the 12- to 24-month period following policy shifts from tightening to “on-hold” or “easing” – the environment in which we currently find ourselves. And, historically, when real rates have been negative, gold’s average monthly returns have been twice as high as the long-term average. Even slightly positive real interest rates may not push gold prices down.
Market surveys indicate that the majority of economists expect positive growth in 2020 for most countries, with a few forecasting contractions in major economies by 2021 or 2022. However, median forecasts also show an expectation of softer global economic growth relative to 2019. This, combined with gold price volatility at or above current levels, may discourage jewellery consumers and cause technology demand to soften.
As the gold price significantly rose in 2019 so did volatility, but, similarly to other assets, it remains well below its long-term trend (Chart 4). And we don’t anticipate a reduction in gold volatility near term. Should the economic and political environment deteriorate, it may even rise, especially as gold volatility historically exhibits a positive skew in such circumstances, tending to increase as stocks pull back.
Gold rallied by 4% in December 2019, increasing by an additional 6% by 7 January 2020. While we believe that there are various reasons for this move, tensions in the Middle East linked to the US-Iran confrontation ultimately pushed the gold price to an almost seven-year high in early January. Subsequent comments by President Trump aimed to ease concerns, pushing the price down to the US$1,560/oz-US$1,550/oz level as of 10 January 2020. Yet, gold still remains still 2.6% higher relative to the end of 2019.4
We expect that investor positioning related to this specific event will likely influence gold’s performance in the near term. But over the medium term, broader financial and geopolitical uncertainty and developments in monetary policy will play a more important role. We analysed the performance of gold as implied by four different hypothetical macro-economic scenarios provided by Oxford Economics. These included:
• a global deceleration (their base-case scenario)
• a US-led recession
• a more pronounced slowdown in China
• an economic improvement in emerging markets.
The results of the analysis suggest that, in general, gold may see a positive performance in 2020. Some of the scenarios – with the exception of an economic upturn in emerging markets – could result in lower consumer demand. But the dampening effect of consumer demand on price performance will likely be offset by potentially robust investment demand on the back of deteriorating credit conditions and stable to lower interest rates.
Technical
Monthly
Monthly picture mostly stands the same. Middle East political events help gold to hit extended weekly and monthly targets. Particular speaking, here, price is testing major monthly 5/8 Fib resistance level. And gold missed XOP just for 20$. It means that our next target here is still 1650.
At the same time, take a look what we have... Gold stands at major monthly resistance level, weekly Overbought, net long position is extremely high and now we have some relief in tensions on Middle East. This combination shifts advantage in favor of retracement and diminish chances on immediate upward action and challenge of our major 1650 target.
Here, on monthly chart we already see pullback out from the level. In general gold has pretty much room for pullback and keeping overall context intact. 40 - 50 $ downside action should not hurt upside scenario. As more extended downside target, if somehow it will happen - we could point YPP at 1445 area.
Monthly chart tells that now it is not the moment yet for taking investing long position on gold market.
Weekly
On weekly chart huge doji pattern plays central role in analysis. As we've said, from technical point of view - gold price will follow to direction of doji breakout side. From this point of view, the key moment is failed attempt of downside breakout last week, when price has tested doji's lows. It means that gold could spend more time in doji range and even show some upside action as it is not at overbought anymore - market easily could reach 1590 level.
Still, overall combination of existing driving factors suggest some advantage on bearish side as gold has no strong driving factors to start new rally above 1600 highs.
So here is the same conclusion. Despite some upside action that could happen on daily/intraday charts, here we do not want to take long-term bullish position now and will be watching for better entry levels. Any daily bullish setup will have just tactical, short-term purpose.
Potentially, as MACD lines stand at lower level compares to the top - we could get divergence and large H&S pattern. This is just a suggestion by far, but it doesn't seem absolutely impossible.
Daily
Daily chart shows no specific signals and patterns by far, but it confirms that market momentum is one of the most reliable and fundamental features in market mechanics. Whatever could happen, but previous strong momentum has to find the way to show itself. That is what we see right now. Recall, how doubtful was entry process and view on B&B setup. Nevertheless, market is going with this setup - slowly, choppy, but it is going. Now we stand near the destination point, where situation could change and new driving factors start impact the gold price.
Intraday
Here is our major setup for coming week. Price indeed has taken the shape of H&S pattern, but it was not sharp and it was extremely difficult to catch the right moment for entry. Besides, price action fluctuates too much with lack of driving factors.
Anyway, gold is coming to momentum trade's target, which is 1582 major 5/8 Fib resistance. There we also have H&S AB=CD target and WPR1. The latter, by the way, could also give us some clarity on this action. If market will turn down there, it confirms the retracement background of this action.
Completion of "222" Sell pattern will be setup to consider for bears.
On 1H chart upside action could be finalized by Butterfly "Sell" pattern, which 1.618 extension also coincides with major Fib resistance:
Conclusion:
This week we do not have big shifts for gold background. Coming Fed, BoE meetings and US GDP report could make significant impact in a lack of other factors. Long-term background on gold market stands bullish but suggests pullback due overextended investors' long position, relief in Middle East crisis and relatively positive economy statistics. Gold also in entering in seasonal bearish trend in January - February. Short-term setup is also creates bearish pattern and particular Fed meeting and GDP release could become the ones that trigger downside action.