Sive Morten
Special Consultant to the FPA
- Messages
- 18,639
Fundamentals
The happy sentiment lasts not too long on gold market as is has turned down faster and earlier than other dollar rivals. Once jump has happened last week we've warned that it might be short-term as overall sentiment is not changed and reasons for jump was arguable. Another reasons to have doubts on gold bullish perspective is the sentiment. It shows no improvement and keeps under question any more or less significant action. Statistics of this week is dollar supportive that makes additional short-term pressure on gold market. It seems that in general status quo remains the same - we could see tactic upside swings on daily and intraday charts but hardly we could speak about breaking of the major tendency and count on rally to 2K area.
Market overview
Gold prices were subdued on Monday after weak jobs growth numbers failed to temper expectations that the U.S. Federal Reserve would start paring its stimulus this year. Although, in fact, report was not as bad as stated in headlines.
Despite that data on Friday showed U.S. nonfarm payrolls increased by 194,000 jobs in September below economists’ forecast of 500,000 - August numbers were revised up. Meanwhile, the unemployment rate dropped to an 18-month low of 4.8% and wage gains accelerated.
The current bout of inflation in the euro zone is not a trigger for monetary policy action as growth in services prices and wages remains weak, European Central Bank chief economist Philip Lane said on Monday.
Gold prices rose on Tuesday as a risk-off sentiment and concerns over inflation bolstered its appeal, however expectations that the U.S. Federal Reserve will start paring economic stimulus capped gains.
Inflation fears triggered by global energy crunch, and debt troubles at China Evergrande weighed on Asian shares. The benchmark U.S. 10-year Treasury yield hit its highest since early June on expectations that elevated inflation could add pressure on the Fed to raise interest rates.
Three Fed policymakers said on Tuesday the economy has healed enough for the central bank to begin withdrawing its crisis-era support, cementing expectations the Fed will start tapering as soon as next month. Meanwhile, money markets are charging ahead with pricing aggressive interest rate hikes as inflationary pressures mount globally. Reduced central bank stimulus and interest rate hikes tend to push government bond yields up, translating into a higher opportunity cost for holding gold that pays no interest.
Gold prices rose 2% to a near one-month peak on Wednesday, as a pullback in the dollar and U.S. Treasury yields lifted demand for the safe-haven metal.
Gold initially pared gains as benchmark U.S. 10-year Treasury yields rose above 1.6% following data showing U.S. consumer prices increased solidly in September and were poised for a further rise in coming months.
The metal also drew support from a slide in the dollar and worries that high inflation would hit global economic growth.
U.S. central bankers signaled they could start reducing their crisis-era support for the economy in mid-November, though they remain divided over how much of a threat high inflation poses and how soon they may need to raise interest rates in response, minutes from their Sept. 21-22 policy meeting showed.
Meanwhile, a group of banks that partnered with the London Metal Exchange to launch gold and silver futures in 2017 is preparing to abandon the project after hoped-for volumes did not materialize.
Gold prices fell on Friday as U.S. bond yields rebounded, though a subdued dollar helped put the precious metal on track for its best week since late August.
Dimming gold’s appeal by raising its opportunity cost, U.S. benchmark 10-year Treasury yields recovered from a more than one-week low hit on Thursday.
Retail Sales, in turn has shown better numbers than expected and this pushed gold lower.
U.S. retail sales unexpectedly increased in September, boosting equities, and extending losses in risk-hedge gold.
In the physical markets, gold prices flipped to premiums in India, bolstered by festival demand. Physical gold flipped back to premiums in India this week as key festivals ushered in jewellery buying, while a rally in domestic prices curbed demand in top consumer China. The December quarter usually accounts for about a third of India’s gold sales as it takes in the start of the wedding season as well as festivals like Dussehra and Diwali.
Consumer confidence has also improved with decreasing coronavirus cases and a recovery in economic activity, he said. Dealers charged premiums of up to $2 an ounce over official domestic prices — inclusive of 10.75% import and 3% sales levies — versus last week’s $2 discounts.
International Monetary Fund annual meeting
Supply chain woes and growing inflation concerns pushed aside a widening gap in COVID-19 vaccinations and mounting debt problems for developing countries as the top concerns for global policymakers at International Monetary Fund and World Bank annual meetings this week. Relatively little new progress was made on increasing vaccine supplies to developing countries, although officials highlighted an increasing divergence between rich and poor countries as a growing financial and economic risk.
World Health Organization chief Tedros Adhananom Ghebreyesus told an IMF forum that the world is falling behind on goals to immunize 40% of the world's population by the end of this year, and criticized wealthy countries for approving third booster shots when much of the world's population has yet to receive a single vaccine dose.
The IMF said a "great vaccine divide" was keeping developing countries mired in low growth as they struggle with high coronavirus infection rates. This, along with supply chain bottlenecks, semiconductor shortages and rising price pressures in advanced economies, prompted the IMF to trim its global growth forecast for 2021.
Some policymakers were more focused on managing the next phases of economic recovery after unprecedented fiscal support, and other multilateral issues, such as implementing a deal to revamp global corporate taxation.
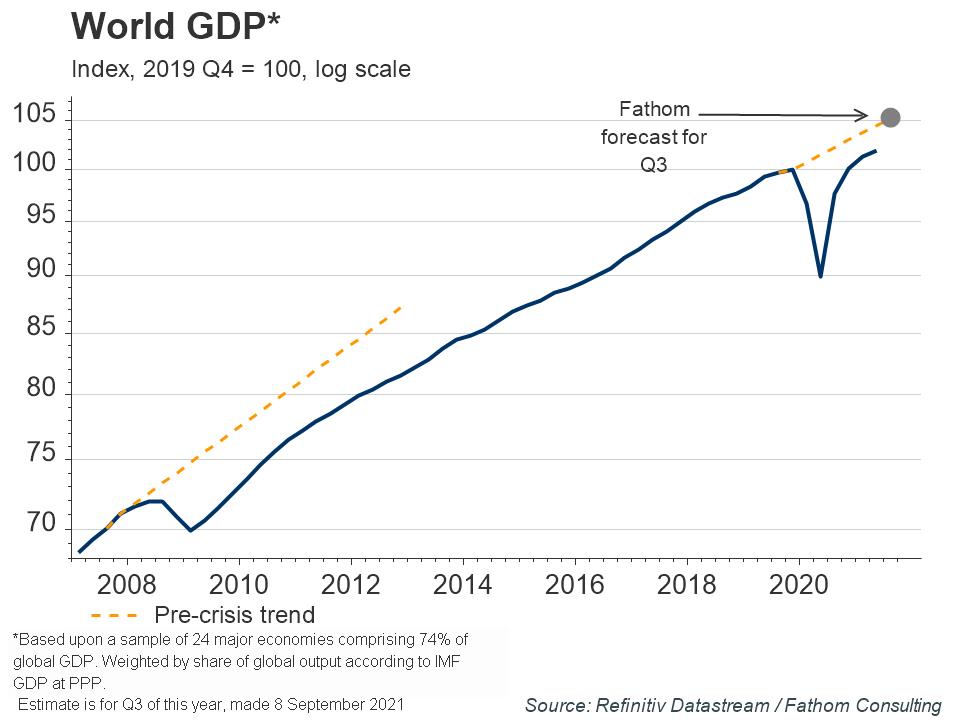
World GDP has surpassed its pre-pandemic level, and Fathom expects output will reach its pre-pandemic trend before the end of the year. Whether this is achieved, will in part be based on how quickly households and non-financial businesses spend savings built up during the pandemic. With elevated inflation, particularly in western advanced economies, a strong recovery through the remainder of the year could push up inflation expectations and put further pressure on central banks to remove some policy accommodation.
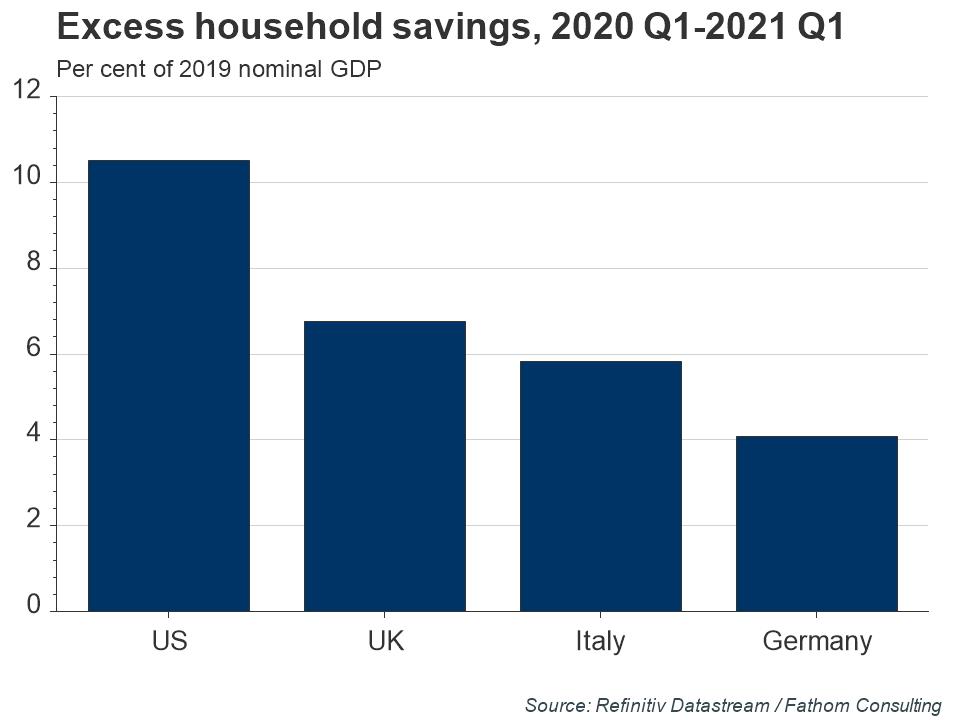
During the pandemic, households across the most advanced economies built up huge excess savings. In the US, incomes rose despite widespread unemployment amid high levels of government support to households. Although consumption expenditure fell drastically, it has now returned to its pre-pandemic level, though it is yet to return to the previous trend. Excess savings in the US amount to as much as 10% of GDP, higher than in other developed economies.
Evidence suggests that the excess savings in developed economies remain largely unspent, despite highly vaccinated countries having entirely removed or significantly reduced domestic COVID-19 restrictions, and retailers being open. Data on retail sales show that US households have largely returned to high street shops, whilst online sales remain elevated in the UK and elsewhere.
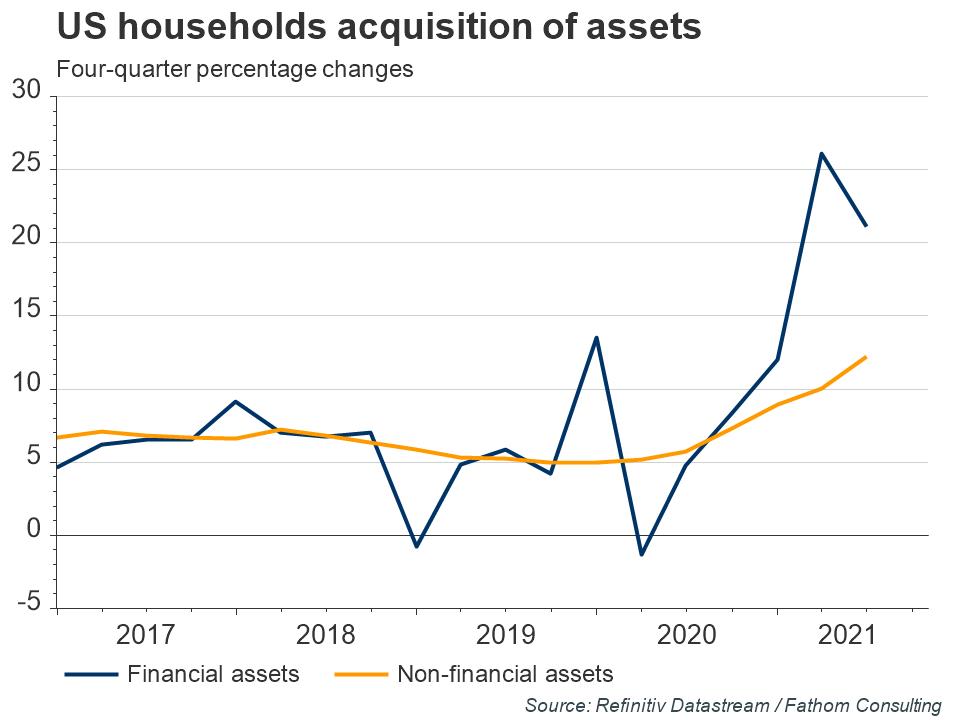
In the US and other countries, households have so far used their savings to acquire financial assets, mostly in the form of accessible bank deposits. UK survey evidence from the Bank of England suggests that some households are still holding back on drawing down these deposits due to concerns about the virus. With a low rate of return, holding instant access deposits makes little sense unless households expect to be cash constrained. As these fears subside, some of these deposits could be spent, posing an upside risk to the economic outlook.
Despite concerns over the Delta variant of the virus, consumer confidence has returned to normal levels in most advanced economies. Mobility data for western developed countries suggest that time spent near retail and recreation is close to normal levels and OpenTable data for those economies suggest that eating out is above 2019 levels.
Fathom places around a 50% weight on the scenario in which the current period of above-target inflation proves to be transitory. If households do increasingly spend their pandemic savings, it will leave central banks facing a dilemma. They could opportunistically shift the inflation target upwards after a period of higher inflation, a move which would be supported by many, including Fathom Consulting. We place a 40% weight on that scenario. Alternatively, central banks could materially tighten policy leading to a sharp slowdown in growth and a big fall in asset prices — a scenario on which we place only a 10% weight.
COT Report
Precious metals funds faced a third consecutive weekly outflow of $482 million. Gold ETF flows generally tracked gold price fluctuations during the third quarter, led by outflows from North American funds which lost 46.3t (-US$2.6bn, -2.4%) overall. North American outflows were dominated by larger US funds, with a majority of losses coming in August.
European funds proved more resilient to price declines over the period as inflation expectations continued to notch higher, resulting in net inflows of 15.2t (US$909mn, 1.0%). This was driven by German funds which, similar to the second quarter, represented more than half of all flows into Europe (8.9t, US$516mn). Low-cost ETFs10 across these regions continued to exhibit strong growth and helped mitigate outflows, adding a total of US$920mn (15.9t). Still Outflows from European and North American funds in September outweighed inflows into Asian funds.
SPDR Fund data also shows no improvement. Reserves shows no reaction on gold price fluctuation and keep downside tendency:

Source: SPDR Fund, FPA
Recent CFTC data brings no clarity as we have minimal changes in general and to the net position as well. Open interest mostly stands unchanged:

Not occasionally last week we gently warned that upside reaction has fragile foundation as NFP data in fact was not as bad as suggested by headlines. It was poor numbers on the surface but inside report was mostly in a row of Fed expectations. Still gold was able to complete minimum upside target. By looking at multiple factors that we have here, including those that we've considered yesterday, we do not see a lot of room for extended upward action, as in terms of price as in terms of time. Now it is becoming more and more obvious that inflation is not transitory, global economy is getting pace and spin off more and more showing great demand for commodities and cargo vessels, as we've seen from CRB and Baltic Dry Indexes. Companies reports record results in 3rd quarter and US statistics also looks good. This makes us think that GDP numbers will be closer to 3.5-4% by the year end.
The same factors accelerate Fed decision and now markets anticipate first rate change for 5 month higher than previously - in the summer of 2022. Finally the gold performance itself looks depressed and sentiment around it shows no improvement. With this burden on the back it is difficult to fly out from the earth. And that makes us think that downside action is more probable in nearest few months. At the same time we do not expect collapse by far, it should be more or less gradual. Indeed 1550$ area mentioned above is matched to our expectations either. Last week we also have mentioned UBS long term view that expects average 1600$ price in 2022. As a bottom line our conclusion here stands the same - some daily/intraday bullish setups could appear from time to time and could be traded (as it happens this week by the way), but we do not see good environment for long-term investing in gold market right now.
Monthly
Long-term charts are not very interesting to us right now as recent price action barely impacts on the long-term picture. October is an inside month by far. On a technical side, we have few bearish moments that suggest deeper action, but, in general, market stands in very small pullback from ATH comparing to the scale of the rally. Market again shows problems with breaking through YPP. We have three equal tops month by month around YPP. It means that somewhere around 1835-1836 big selling orders hold gold from further upward action.
In a shorter-term everything is based on August huge trading range. With the more information from the Fed, we suggest that sentiment becomes more bearish and action to 1650 support area gets more chances to happen in near term. Next target is YPS1 at 1540$.
At the same time, as we've mentioned before, in long term scale price action has the features of retracement, forming big flag consolidation with choppy action inside and standing above nearest 3/8 Fib level. This type of action is difficult to call as strong bearish reversal, at least for now.

Weekly
Weekly trend remains bearish and we do not have reasons to change our view by far, despite recent pullback. It would be nice if bears could get the grabber this week, but this has not happened. Anyway, as all upside swings do not change the trend - they are retracement attempts only and care no features of tendency changing. Weekly time frame shows patterns and scenarios that theoretically are possible here. Gold very accurately follows to scenario that we've suggested a month ago. Here we have two important details. First is - gold inability to reach the upper border of triangle and early turn down. Since the drop is strong, we could say that this is real early reversal and hardly gold returns back to hit the triangle line. This week attempt confirms this once again. So let's keep going with the setup that we have here:

Daily
The sharp reversal has come as soon as market has got reasons for that. This time it was Retail Sales release. Based on weekly/daily basis we have bearish context as we fade daily bullish trend against weekly bearish one at major 5/8 Fib resistance level and after upside AB=CD pattern is completed. So, if bearish context starts getting power again - gold should continue downside action and keep 1800 recent top intact.
Formally, daily bullish context is not broken yet and its vital point stands around 1720$ lows, while intermediate validity we could check around 1745 support area. still some moments on intraday chart indirectly suggest that upward action might be over.

Intraday
On 4H chart upside H&S target was accurately hit, but price turns down sharp as fast as it was going higher. Drop below the neckline of H&S pattern gives little chances on upward continuation. Market's drop through the consolidation could become another bearish sign.

Recent drop has broken through the first K-support area that we've specified as important level and stuck at the 2nd one by far. Still since downside punch is strong enough, it is possible to consider a kind of B&B "Sell" here. The pullback to 1780-1786 area could be considered for short position taking:

The happy sentiment lasts not too long on gold market as is has turned down faster and earlier than other dollar rivals. Once jump has happened last week we've warned that it might be short-term as overall sentiment is not changed and reasons for jump was arguable. Another reasons to have doubts on gold bullish perspective is the sentiment. It shows no improvement and keeps under question any more or less significant action. Statistics of this week is dollar supportive that makes additional short-term pressure on gold market. It seems that in general status quo remains the same - we could see tactic upside swings on daily and intraday charts but hardly we could speak about breaking of the major tendency and count on rally to 2K area.
Market overview
Gold prices were subdued on Monday after weak jobs growth numbers failed to temper expectations that the U.S. Federal Reserve would start paring its stimulus this year. Although, in fact, report was not as bad as stated in headlines.
“The payrolls data is not going to do anything to stop the Fed from tapering... Labor shortage is feeding into higher wage pressures and that could exacerbate inflation even further, which will mean that they’ll eventually have to step in,” said IG Market analyst Kyle Rodda. “The gold market is having a lot of trouble making odds and ends of where it should go from here. My personal bias is to the downside, but we’re stuck in a range in the moment,” Rodda said.
Despite that data on Friday showed U.S. nonfarm payrolls increased by 194,000 jobs in September below economists’ forecast of 500,000 - August numbers were revised up. Meanwhile, the unemployment rate dropped to an 18-month low of 4.8% and wage gains accelerated.
“In face of this energy crisis and the poor September non-farm payrolls, gold still traded below $1,800. There is little conviction among gold bulls,” OCBC Bank economist Howie Lee said in a note, adding gold is likely to stabilize at $1,500 before end-2022. The dollar rose to its highest level in nearly three years versus the yen, while benchmark U.S. 10-year Treasury yields touched their highest level since early June on Friday, increasing the opportunity cost of holding non-interest bearing gold.
The current bout of inflation in the euro zone is not a trigger for monetary policy action as growth in services prices and wages remains weak, European Central Bank chief economist Philip Lane said on Monday.
Gold prices rose on Tuesday as a risk-off sentiment and concerns over inflation bolstered its appeal, however expectations that the U.S. Federal Reserve will start paring economic stimulus capped gains.
“This energy crisis continues to dominate market sentiment because there are concerns that inflation is now probably not as transitory as earlier expected and that’s underpinning gold prices,” said Harshal Barot, a senior research consultant for South Asia at Metals Focus. Economic data will be closely watched for the health of global economy and signs of prolonged stagflation could push gold towards $1,800, he added.
Inflation fears triggered by global energy crunch, and debt troubles at China Evergrande weighed on Asian shares. The benchmark U.S. 10-year Treasury yield hit its highest since early June on expectations that elevated inflation could add pressure on the Fed to raise interest rates.
Three Fed policymakers said on Tuesday the economy has healed enough for the central bank to begin withdrawing its crisis-era support, cementing expectations the Fed will start tapering as soon as next month. Meanwhile, money markets are charging ahead with pricing aggressive interest rate hikes as inflationary pressures mount globally. Reduced central bank stimulus and interest rate hikes tend to push government bond yields up, translating into a higher opportunity cost for holding gold that pays no interest.
There was also an increase in risk aversion ahead of the U.S. earnings season, Jeffrey Halley, a senior market analyst for Asia-Pacific at OANDA, said in a note. The threat of Fed taper should cap gold’s rally and the bias is still towards the downside in the coming weeks, he said.
Gold prices rose 2% to a near one-month peak on Wednesday, as a pullback in the dollar and U.S. Treasury yields lifted demand for the safe-haven metal.
“Gold is just following yields at the moment. The initial reaction after CPI (consumer price index) data was a big spike in yields, which is now starting to fade away,” said Daniel Pavilonis, senior market strategist at RJO Futures.
Gold initially pared gains as benchmark U.S. 10-year Treasury yields rose above 1.6% following data showing U.S. consumer prices increased solidly in September and were poised for a further rise in coming months.
The metal also drew support from a slide in the dollar and worries that high inflation would hit global economic growth.
“Inflation expectations mixed with global growth concerns have made many investors nervous that the business and the consumer will be much weaker in the second half of 2022. Safe-haven flows are starting to come gold’s way,” Edward Moya, senior market analyst at brokerage OANDA, said in a note.
U.S. central bankers signaled they could start reducing their crisis-era support for the economy in mid-November, though they remain divided over how much of a threat high inflation poses and how soon they may need to raise interest rates in response, minutes from their Sept. 21-22 policy meeting showed.
Meanwhile, a group of banks that partnered with the London Metal Exchange to launch gold and silver futures in 2017 is preparing to abandon the project after hoped-for volumes did not materialize.
Gold prices fell on Friday as U.S. bond yields rebounded, though a subdued dollar helped put the precious metal on track for its best week since late August.
Dimming gold’s appeal by raising its opportunity cost, U.S. benchmark 10-year Treasury yields recovered from a more than one-week low hit on Thursday.
“Expectations are growing that the Fed and other central banks are going to tighten their monetary policy, which should keep yields supported, and when yields rise gold tends to struggle,” said Fawad Razaqzada, analyst with ThinkMarkets. “Investors are, however, likely expecting only a moderate tightening from major central banks and that shouldn’t cause too much of a problem for gold as investors hedge against elevated price levels.”
“While gold could face resistance at the 100 and 200-day moving averages of about $1,798 and $1,795 respectively, gold could overcome this threshold if U.S. economic data – especially retail sales – turn out to be weaker and the dollar depreciates in response,” Commerzbank analysts wrote in a note.
Retail Sales, in turn has shown better numbers than expected and this pushed gold lower.
“Gold has everything going against it. Real rates are rising, equities are higher, so is bitcoin,” said Phillip Streible, chief market strategist at Blue Line Futures in Chicago.
U.S. retail sales unexpectedly increased in September, boosting equities, and extending losses in risk-hedge gold.
In the physical markets, gold prices flipped to premiums in India, bolstered by festival demand. Physical gold flipped back to premiums in India this week as key festivals ushered in jewellery buying, while a rally in domestic prices curbed demand in top consumer China. The December quarter usually accounts for about a third of India’s gold sales as it takes in the start of the wedding season as well as festivals like Dussehra and Diwali.
“Retail demand has improved to pre-pandemic level. Jewellery stores are witnessing very good footfall in urban and rural areas,” said Ashish Pethe, chairman of the All India Gem & Jewellery Domestic Council.
Consumer confidence has also improved with decreasing coronavirus cases and a recovery in economic activity, he said. Dealers charged premiums of up to $2 an ounce over official domestic prices — inclusive of 10.75% import and 3% sales levies — versus last week’s $2 discounts.
International Monetary Fund annual meeting
Supply chain woes and growing inflation concerns pushed aside a widening gap in COVID-19 vaccinations and mounting debt problems for developing countries as the top concerns for global policymakers at International Monetary Fund and World Bank annual meetings this week. Relatively little new progress was made on increasing vaccine supplies to developing countries, although officials highlighted an increasing divergence between rich and poor countries as a growing financial and economic risk.
World Health Organization chief Tedros Adhananom Ghebreyesus told an IMF forum that the world is falling behind on goals to immunize 40% of the world's population by the end of this year, and criticized wealthy countries for approving third booster shots when much of the world's population has yet to receive a single vaccine dose.
The IMF said a "great vaccine divide" was keeping developing countries mired in low growth as they struggle with high coronavirus infection rates. This, along with supply chain bottlenecks, semiconductor shortages and rising price pressures in advanced economies, prompted the IMF to trim its global growth forecast for 2021.
Some policymakers were more focused on managing the next phases of economic recovery after unprecedented fiscal support, and other multilateral issues, such as implementing a deal to revamp global corporate taxation.
"My feeling about all the meetings we had in Washington, and during these IMF meetings, is that we are beyond COVID," French Finance Minister Bruno Le Maire told reporters. Even if we have to monitor the situation, even if there remains some decisions to be taken on vaccination, especially for the poorest countries, now we are beyond COVID," Le Maire said.
World GDP has surpassed its pre-pandemic level, and Fathom expects output will reach its pre-pandemic trend before the end of the year. Whether this is achieved, will in part be based on how quickly households and non-financial businesses spend savings built up during the pandemic. With elevated inflation, particularly in western advanced economies, a strong recovery through the remainder of the year could push up inflation expectations and put further pressure on central banks to remove some policy accommodation.
During the pandemic, households across the most advanced economies built up huge excess savings. In the US, incomes rose despite widespread unemployment amid high levels of government support to households. Although consumption expenditure fell drastically, it has now returned to its pre-pandemic level, though it is yet to return to the previous trend. Excess savings in the US amount to as much as 10% of GDP, higher than in other developed economies.
Evidence suggests that the excess savings in developed economies remain largely unspent, despite highly vaccinated countries having entirely removed or significantly reduced domestic COVID-19 restrictions, and retailers being open. Data on retail sales show that US households have largely returned to high street shops, whilst online sales remain elevated in the UK and elsewhere.
In the US and other countries, households have so far used their savings to acquire financial assets, mostly in the form of accessible bank deposits. UK survey evidence from the Bank of England suggests that some households are still holding back on drawing down these deposits due to concerns about the virus. With a low rate of return, holding instant access deposits makes little sense unless households expect to be cash constrained. As these fears subside, some of these deposits could be spent, posing an upside risk to the economic outlook.
Despite concerns over the Delta variant of the virus, consumer confidence has returned to normal levels in most advanced economies. Mobility data for western developed countries suggest that time spent near retail and recreation is close to normal levels and OpenTable data for those economies suggest that eating out is above 2019 levels.
Fathom places around a 50% weight on the scenario in which the current period of above-target inflation proves to be transitory. If households do increasingly spend their pandemic savings, it will leave central banks facing a dilemma. They could opportunistically shift the inflation target upwards after a period of higher inflation, a move which would be supported by many, including Fathom Consulting. We place a 40% weight on that scenario. Alternatively, central banks could materially tighten policy leading to a sharp slowdown in growth and a big fall in asset prices — a scenario on which we place only a 10% weight.
COT Report
Precious metals funds faced a third consecutive weekly outflow of $482 million. Gold ETF flows generally tracked gold price fluctuations during the third quarter, led by outflows from North American funds which lost 46.3t (-US$2.6bn, -2.4%) overall. North American outflows were dominated by larger US funds, with a majority of losses coming in August.
European funds proved more resilient to price declines over the period as inflation expectations continued to notch higher, resulting in net inflows of 15.2t (US$909mn, 1.0%). This was driven by German funds which, similar to the second quarter, represented more than half of all flows into Europe (8.9t, US$516mn). Low-cost ETFs10 across these regions continued to exhibit strong growth and helped mitigate outflows, adding a total of US$920mn (15.9t). Still Outflows from European and North American funds in September outweighed inflows into Asian funds.
SPDR Fund data also shows no improvement. Reserves shows no reaction on gold price fluctuation and keep downside tendency:
Source: SPDR Fund, FPA
Recent CFTC data brings no clarity as we have minimal changes in general and to the net position as well. Open interest mostly stands unchanged:
Not occasionally last week we gently warned that upside reaction has fragile foundation as NFP data in fact was not as bad as suggested by headlines. It was poor numbers on the surface but inside report was mostly in a row of Fed expectations. Still gold was able to complete minimum upside target. By looking at multiple factors that we have here, including those that we've considered yesterday, we do not see a lot of room for extended upward action, as in terms of price as in terms of time. Now it is becoming more and more obvious that inflation is not transitory, global economy is getting pace and spin off more and more showing great demand for commodities and cargo vessels, as we've seen from CRB and Baltic Dry Indexes. Companies reports record results in 3rd quarter and US statistics also looks good. This makes us think that GDP numbers will be closer to 3.5-4% by the year end.
The same factors accelerate Fed decision and now markets anticipate first rate change for 5 month higher than previously - in the summer of 2022. Finally the gold performance itself looks depressed and sentiment around it shows no improvement. With this burden on the back it is difficult to fly out from the earth. And that makes us think that downside action is more probable in nearest few months. At the same time we do not expect collapse by far, it should be more or less gradual. Indeed 1550$ area mentioned above is matched to our expectations either. Last week we also have mentioned UBS long term view that expects average 1600$ price in 2022. As a bottom line our conclusion here stands the same - some daily/intraday bullish setups could appear from time to time and could be traded (as it happens this week by the way), but we do not see good environment for long-term investing in gold market right now.
Monthly
Long-term charts are not very interesting to us right now as recent price action barely impacts on the long-term picture. October is an inside month by far. On a technical side, we have few bearish moments that suggest deeper action, but, in general, market stands in very small pullback from ATH comparing to the scale of the rally. Market again shows problems with breaking through YPP. We have three equal tops month by month around YPP. It means that somewhere around 1835-1836 big selling orders hold gold from further upward action.
In a shorter-term everything is based on August huge trading range. With the more information from the Fed, we suggest that sentiment becomes more bearish and action to 1650 support area gets more chances to happen in near term. Next target is YPS1 at 1540$.
At the same time, as we've mentioned before, in long term scale price action has the features of retracement, forming big flag consolidation with choppy action inside and standing above nearest 3/8 Fib level. This type of action is difficult to call as strong bearish reversal, at least for now.
Weekly
Weekly trend remains bearish and we do not have reasons to change our view by far, despite recent pullback. It would be nice if bears could get the grabber this week, but this has not happened. Anyway, as all upside swings do not change the trend - they are retracement attempts only and care no features of tendency changing. Weekly time frame shows patterns and scenarios that theoretically are possible here. Gold very accurately follows to scenario that we've suggested a month ago. Here we have two important details. First is - gold inability to reach the upper border of triangle and early turn down. Since the drop is strong, we could say that this is real early reversal and hardly gold returns back to hit the triangle line. This week attempt confirms this once again. So let's keep going with the setup that we have here:
Daily
The sharp reversal has come as soon as market has got reasons for that. This time it was Retail Sales release. Based on weekly/daily basis we have bearish context as we fade daily bullish trend against weekly bearish one at major 5/8 Fib resistance level and after upside AB=CD pattern is completed. So, if bearish context starts getting power again - gold should continue downside action and keep 1800 recent top intact.
Formally, daily bullish context is not broken yet and its vital point stands around 1720$ lows, while intermediate validity we could check around 1745 support area. still some moments on intraday chart indirectly suggest that upward action might be over.
Intraday
On 4H chart upside H&S target was accurately hit, but price turns down sharp as fast as it was going higher. Drop below the neckline of H&S pattern gives little chances on upward continuation. Market's drop through the consolidation could become another bearish sign.
Recent drop has broken through the first K-support area that we've specified as important level and stuck at the 2nd one by far. Still since downside punch is strong enough, it is possible to consider a kind of B&B "Sell" here. The pullback to 1780-1786 area could be considered for short position taking: