WaveRider
Master Sergeant
- Messages
- 350
This is a wiki posting of Sive's trading method. Please help. Here are the rules: I'm going to describe Sive's morning trading analysis as I understand it. Correct me when I'm wrong (I will be wrong) and I'll edit the original posting to make it accurate. When you correct me, if possible, provide the link to the video and list the time we're looking for or the book with the page number, or the link to the archived posting by Sive. Also, Sive uses various terms like "butterfly sell." I will try to define the terms he uses here but I will not get all of them. At the bottom of the post I will list all the terms that need to be defined and will continue to update them as we define them accurately. Please help me define them here and ask about other phrases you don't know about and we will try to answer your questions. Again, post a source link and a time to watch for or the page number of the book you are referring to so we want this thread to be accurate, not just opinion. We are trying to capture Sive's trading methodology, not our own or our own variation. Also, please post screen shots of winning and losing trades based on this method.
.
Sive gives useful pointers in about every video. If you watch the video list the tip. For instance, he says that any very long daily or 4h bar will usually see retracement to the 50% level and then continue in the direction of the thrust. It's those tips we want and we list a lot at the bottom of this post.
.
Sive's method is heavily influenced by the books Trading with Dinapoli Levels by Joe Dinapoli and Trade What You See - by Larry Pesavento.
.
Sive's trading method is guided by nine main principles:
1. Price will go the along with the trend, along its current trajectory, until something is strong enough to change its direction. Usually, but not always, this is a confluence area.
.
2. He identifies confluence as places the market is likely to turn around making it good to enter and exit. Confluence is the idea that if many decision making levels are grouped together, the price is more likely to turn around. Spotting a good area is essential to setting targets and entering in the market. See glossary below.
.
3. He examines whatever is popular at the moment since that can turn the markets. For example, pivot points are pretty popular still and although he doesn't trade them, he looks at them because so is everyone else. If the current flavor were a specific moving average or the RSI (which they aren't) and that frequently offered significant S/R, he would look at that too.
.
4. He watches for the institutional sharks who will be looking to stop you out. This is the wash and rinse and the stop grabber trades. See glossary below. Stay out of the way of anyone who has more capital than you or can move the market. Resting stops above a high or low is prime meat for the sharks. Classical chart patterns are too.
.
5. A trend in one time frame is a retracement in another. Using the fractal nature of time frame analysis, we can piece together a direction and a target/turning point. It's okay to stay on larger time frames as long as your stops are wide enough and positions are small enough to allow for retracement. It's not wise to start on a smaller time frame since the larger TF's will win.
.
6. Price action indicates mood. Tells us if the market is going to break out or retrace. The candle stick patterns he watched for are listed in the FPA school. See pic below for an example of PA and market sentiment.
.
7. Buy pull backs and sell rallies. Sive NEVER EVER chases price. It doesn't matter how obvious the price action is in a certain direction, he always waits for a pull back before entering. ALWAYS. In a couple years of watching his videos, never have I seen him say "Jump in now or you'll miss the move." Don't worry, the price will retrace and you can get in.
.
8. Always use smart entries, exits, multiple positions, take some profit early and move stops to break even when possible. Smart money management is how you let winners run and stop out losers early. It turns a break even or a slightly losing plan into a real big money maker. This is the point new traders ignore and so end up buying vacations and boats for the guys at JP Morgan and Deutsche.
.
9. Trade small enough to survive several losses. Sive risks no more than 3% of total account value on any one trade. A 2% monthly return beats the historical market (4% annual) by about 600%. Think your account is too small for this to matter? Save up and put more money in it. Or risk big and keep blowing your account. There is no way to win every time. 2% compounded monthly would put you as a very high wage earner at any major financial institution.
Here is a link to his demo statement at post #15. Shows a 36% increase in a 4 month period. He calls this mediocre results because he doesn't trade forex all the time. See the next post below where I analyze this a little more in depth.
https://www.forexpeacearmy.com/fore...299-forex-pro-weekly-june-04-08-2012-a-2.html
.
On every time frame Sive performs the same process starting with the monthly and ending on the 4h or the 1h, usually the 1h. It goes like this:
.
1. Establish current trend on the monthly. Where is the market headed?
a. Dinapoli MACD (up or down)
b. Above or below the (monthly or weekly) pivot point.
.
Remember higher TF's win. Smaller TF's allow for intraday trades but big trends are on the monthly, weekly and daily time frames.
.
2. Establish a target the price will likely go to:
a. Targets are the completion of patterns, specifically: Gartley Butterfly, Crab, (maybe the 222 pattern but I have never seen him use it), AB=CD aka fib expansion levels, 3 drives, and to a lesser extent classical chart pattern like the head and shoulders, wedge, widening wedge, pennant, flag, triangle etc.
b. Add to that a confluence area of relevant support/resistance from fib's and other targets and you will get a solid likely turning point for the market.
c. He uses the Oscillator Predictor indicator to determine overbought and oversold levels. The market does not like to be OB or OS for long and will want to retrace and this is another strong area of S and R. I have yet to get a hold of this indicator so if anyone can put me in the right direction, PM me.
.
3. Devise a strategy for entering safely and exiting intelligently. Sell the rallies and buy the pull backs.
a. Entries are at a confluence retracement. This means you'll be entering with the trend.
b. Stops are placed behind the protection of a confluence area. If your stop was hit, it isn't because of random market noise. It was because your analysis was wrong. (Forex is noisier than many markets though and noise may still get you.)
c. Exits are at a logical confluence area or completion of a pattern. Often partial profits are taken because the price is likely to continue in your direction.
.
.
Glossary of terms Sive uses:
.
3x3 - Joe Dinapoli found that a 3 period SMA displaced 3 periods was useful for identifying the end of strong thrusting markets. A close across the line was confirmation the trend was over. Often the price will cross the line but not close across it. It also helps for his Double Repo pattern defined below.
.
7x5 - Joe Dinapoli found that a 7 period SMA displaced 5 periods was useful in equity markets. Sive doesn't seem to use this.
.
25x5 - Joe Dinapoli found that a 25 period SMA displaced 5 periods was useful for identifying the end of longer term trends. A close across the line was confirmation the trend was over. This can also serve to act as support or resistance. Like any support or resistance, it may be tested several times and if it has ben deisprespected, it will often be retested from the other side. There is a screen shot of this in post 9 of this thread.
.
3 drives reversal pattern - the harmonic thrusts that are each about a 1.27 extension of the last thrust.

.
"Direction overrules trend". This is from Dinapoli's book and Sive has used this phrase. A direction indicator is usually some chart pattern like an ABCD or butterfly. These patterns will want to complete before the trend can continue. So if a pattern is counter trend, direction over rules trend. Wait for the directional pattern to complete and then enter again with the trend. A butterfly is a good example of this because it is a reversal pattern. If the extension leg of the butterfly is counter trend, getting in at the completion of the butterfly puts you in with the trend and at a great price.
.
Double Repo - A directional pattern using a 3x3. If price is thrusting/trending down, then jumps up across the 3x3, down again and above again. This is a reversal pattern. It indicated the end of a strong trend. This is a zig zag that will often stop many market players out.
.
Bread and Butter Trade - A directional pattern using a 3x3. Price is thrusting/trending down (if in a down market), then jumps up across the 3x3 to close for a bar or two then continues down to complete the thrusting action. These look like a pause in a great thrust and are caused by big money taking some profit out of a big thrust. They have some positions open to let profits run and so the trend continues. The thrust should have at least 8 bars. Indicates very strong market sentiment.
.
Here's a good example of a Bread and Butter sell. In this daily EUR/USD chart, there is an ascending wedge that breaks at the end of Aug 2011. The thrust is decisive but not 8 perfect down bars. A little jump up but is contained by the 3x3. Are we in yet? No. The market retraces across the 3x3 to the 382 fib retracement level. We get in at the 382 level (in aqua marine) because the price action is so decisively down, it is VERY likely to continue down after a little pull back. It does and continues down to the 618 fib extension level (in red at the bottom) of this ABCD pattern. Bread and butter means this trade is almost a free one. Few major players want to be long after such strong thrust down. The retracement is usually someone taking profits, not a change in market sentiment.
. .
.
Trend - is captured by the 25x5 SMA , the 3x3 SMA and the MACD with Dinapoli's inputted numbers. The market isn't always trending.
.
ABCD - Price will move in a harmonic math function of its previous move. This ABCD pattern is built into MT4 and all serious trading platforms.
See this archived analysis under the 4 hour heading:
https://www.forexpeacearmy.com/fore...20809-forex-pro-weekly-july-16-20-2012-a.html
.
Harmonics: On 11/11/12's daily analysis video Sive spoke of using the harmonic of the currency as a safe stop loss . This is talked about in FPA's forex training. The idea is that any currency tends to move in spurts or waves that are of a certain length and those waves repeat themselves and that the waves have some predictive power on where price will go. Sive mentioned he uses the EUR/USD harmonic which is currently 37-40 pips as a safe stop loss distance. If a directional pattern will fail, it will need to fail by the harmonic to really fail. This is because if the market tests the bottom of a pattern, it may just be completing the harmonic, that is it may be just market noise and doesn't mean the pattern is completely washed out. If the market wants to not complete a pattern, it will go past its harmonic indicating decisive direction away.
.
Gartley Butterfly pattern - A reversal pattern with two linked ABCD patterns with these characteristics:
.
The first pattern has the D leg not clearing the B leg and C is a significant retracement to the A, can be 618 but usually, preferably 782. The second pattern's AB leg is the same as the first patterns CD leg. The second patterns D target is a 100%, 138.2% or 161.8% ABCD extension. Sive trades this target. This target is a bigger extension when the market shows great decisive thrust toward the target. This is a reversal pattern. At the end of the extension, there is a reversal of price and the target is either another confluence area, a weekly pivot point, the bottom of a channel or other major S/R? Help, I need a target.
See this archived analysis under the daily heading:
https://www.forexpeacearmy.com/fore...20809-forex-pro-weekly-july-16-20-2012-a.html
.
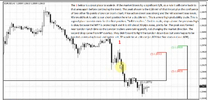
Gartley 222 pattern - This is essentially a butterfly failure. In the image here, a butterfly sell pattern would need to clear the high of the beginning of the pattern at 1.3175 and continue until the 161.8 ext or 200% extension. The 222 hit the 100% extension and did not clear the old high. It was completed 10/17/12 and resulted in a sell off. Sive spoke about it several times in the daily reveiws.
View attachment 7319
Confluence - a grouping of decision making points that are more likely to change the direction of the market. I trade pivot points on the weekly TF and you trade fibonacci's on the daily and another trader only trades psychological levels. None of us are looking at each other's charts but it so happens that all of our targets are in a 30 pips range. No one target would be enough to change the market but all of them together does.
.
Wash and Rinse - This refers to market movers moving the market intentionally to hit your stops. It allows them to get a better fill on their orders and can propel the market their way. Any classical chart pattern is suspect to the wash and rinse. For this reason, using narrow stops is a bad idea. Stop should be hidden where the sharks don't want to go, such as behind a confluence level.
.
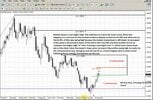
Price action - How is the market moving in time and volitilaty? Does it look like the market is decisive? Strong thrusts indicate a safe continuation. Weak price movement indicates indecision and fear. It's easy to be wrong when the maket hasn't made up it's mind. Also, price action can be a bar or 3 bars indicating a reversal is about to take place. The pic below shows price bouncing on a support level. The lower highs were made of strong thrusts down and weak retracements. The price broke the support for an 800 pip run.

For more on chart patterns, see this link:
https://www.forexpeacearmy.com/fore...ary-japanese-candlesticks-patterns-sheet.html
.
Some of Sive's random tips:
.
Some of these are taken from the FPA school's pages such as this link and halfway down the page. Some are ones I've heard while watching the videos. Please help expand this section.
https://www.forexpeacearmy.com/fore...chapter-10-part-ii-fibonacci-retracement.html
.
1. The major Fibonacci ratios and most reliable levels are 0.382 and 0.618;
.
2. Because of that, they are extremely well-known among traders and market makers. It means that the appearance of a failure breakout, such as Wash and Rinse is very probable there.
.
3. If some level has been broken by price action – then it should be dropped out from further analysis and you have to not take it in consideration.
.
4. If the market totally disrespects some obvious and strong level, say, on weekly or monthly time frame – very often the market returns to it and tests it from the other side after breakout;
.
5. 0.5 level of some long range single up/down candle itself could be a support/resistance level, so as its low/high.
.
6. We can judge via retracement depth about further market moves. If a retracement was shallow (0.382-0.5) then we can expect a significant further move. If a retracement was deep (0.618-1.0), then any up move could be shallower, or even just back to the previous highs.
.
7. Levels could be broken - they are just temporary supports or resistances. How it looks like – you can see on chart #1. They are not “Stand forever” substance. If it was so – there will not be any simpler thing, as just to buy or sell from them. Unfortunately this is not the case.
.
8. Use Fibonacci levels only in combinations with other tools to increase probability to success.
.
9. It’s better to use levels of higher time frames to trade on lower time frames. For instance to enter long on 60-min chart, it’s better use support levels of daily time frame, etc.
.
10. The higher the time frame of the swing – the stronger retracement levels from it.
.
11. If price bounces between daily overbought to oversold, or visa versa, in a bar or two, it will want to go back to the center of those two extremes.
.
12. The weekly pivot is traded 70-80% of the time. The monthly?
.
13. Head and shoulders patterns fail as much as they work. Dinapoli says in his book: "Show me a classical chart pattern and I'll show you a classical chart pattern failure."
.
14. If the market holds above/below the support/resistance level and has not closed below/above it but just insignificantly pierced it (with candle shadows), the more probable that it still valid. So, Close price is your first assistant.
.
15. To not be trapped with stop licking (i.e. Wash and Rinse) you may act in two ways – place your stop-loss order a bit deeper or wait for the appearance of a Wash and Rinse pattern as a confirmation of the level’s strength and further upward/downward market move. After you will see, that the Stop licking pattern completed – you may enter in corresponding direction.
.
16. Wash and Rinse is a fast pattern, so if the market has broken a level (i.e. close below/above it) and holds there for 3 periods (i.e. 3 bars/candles) or more, then probably this level has been erased by market action and not valid anymore; (screen shot needed)
.
17. When price breaks the support level - later it could retest it and this area can act as resistance. The same is true for a resistance level – after breakout, it could act as support if the market will return and retest this area;

.
18. The more often price tests the level – the weaker it becomes;
.
19. The longer some level holds, the stronger could be the move after a true breakout of this level;
.
20. Treat S/R levels as an area or zone, not a hard line, especially on longer time frames, such as weekly and monthly. The longer your time frame – the wider support/resistance area.
.
21. When the butterfly pattern fails, it usually fails in a big way.
.
22. Taken from Sive's daily update 9/11/12 at about minutes 4-7. Weekly shows a new higher high. This indicates an end to the down trend. When this happens, it is common for the market to retrace deeply, at least to the 50% and often even to the 61.8%, of this new swing high because the market momentum is still down. So we expect at this point a retracement down to the 618 to form the ABC and then another thrust up making a new higher high "D" after forming a new higher low "C" which hasn't been made yet on this chart. Since Sive doesn't chase price, he doesn't buy at this swing high "B", he waits for the retracement "C" to buy. Seeing a new HH and HL as a trend changing event is classic trend following theory (and ALL the bankers see this too).

.
Sive gives useful pointers in about every video. If you watch the video list the tip. For instance, he says that any very long daily or 4h bar will usually see retracement to the 50% level and then continue in the direction of the thrust. It's those tips we want and we list a lot at the bottom of this post.
.
Sive's method is heavily influenced by the books Trading with Dinapoli Levels by Joe Dinapoli and Trade What You See - by Larry Pesavento.
.
Sive's trading method is guided by nine main principles:
1. Price will go the along with the trend, along its current trajectory, until something is strong enough to change its direction. Usually, but not always, this is a confluence area.
.
2. He identifies confluence as places the market is likely to turn around making it good to enter and exit. Confluence is the idea that if many decision making levels are grouped together, the price is more likely to turn around. Spotting a good area is essential to setting targets and entering in the market. See glossary below.
.
3. He examines whatever is popular at the moment since that can turn the markets. For example, pivot points are pretty popular still and although he doesn't trade them, he looks at them because so is everyone else. If the current flavor were a specific moving average or the RSI (which they aren't) and that frequently offered significant S/R, he would look at that too.
.
4. He watches for the institutional sharks who will be looking to stop you out. This is the wash and rinse and the stop grabber trades. See glossary below. Stay out of the way of anyone who has more capital than you or can move the market. Resting stops above a high or low is prime meat for the sharks. Classical chart patterns are too.
.
5. A trend in one time frame is a retracement in another. Using the fractal nature of time frame analysis, we can piece together a direction and a target/turning point. It's okay to stay on larger time frames as long as your stops are wide enough and positions are small enough to allow for retracement. It's not wise to start on a smaller time frame since the larger TF's will win.
.
6. Price action indicates mood. Tells us if the market is going to break out or retrace. The candle stick patterns he watched for are listed in the FPA school. See pic below for an example of PA and market sentiment.
.
7. Buy pull backs and sell rallies. Sive NEVER EVER chases price. It doesn't matter how obvious the price action is in a certain direction, he always waits for a pull back before entering. ALWAYS. In a couple years of watching his videos, never have I seen him say "Jump in now or you'll miss the move." Don't worry, the price will retrace and you can get in.
.
8. Always use smart entries, exits, multiple positions, take some profit early and move stops to break even when possible. Smart money management is how you let winners run and stop out losers early. It turns a break even or a slightly losing plan into a real big money maker. This is the point new traders ignore and so end up buying vacations and boats for the guys at JP Morgan and Deutsche.
.
9. Trade small enough to survive several losses. Sive risks no more than 3% of total account value on any one trade. A 2% monthly return beats the historical market (4% annual) by about 600%. Think your account is too small for this to matter? Save up and put more money in it. Or risk big and keep blowing your account. There is no way to win every time. 2% compounded monthly would put you as a very high wage earner at any major financial institution.
Here is a link to his demo statement at post #15. Shows a 36% increase in a 4 month period. He calls this mediocre results because he doesn't trade forex all the time. See the next post below where I analyze this a little more in depth.
https://www.forexpeacearmy.com/fore...299-forex-pro-weekly-june-04-08-2012-a-2.html
.
On every time frame Sive performs the same process starting with the monthly and ending on the 4h or the 1h, usually the 1h. It goes like this:
.
1. Establish current trend on the monthly. Where is the market headed?
a. Dinapoli MACD (up or down)
b. Above or below the (monthly or weekly) pivot point.
.
Remember higher TF's win. Smaller TF's allow for intraday trades but big trends are on the monthly, weekly and daily time frames.
.
2. Establish a target the price will likely go to:
a. Targets are the completion of patterns, specifically: Gartley Butterfly, Crab, (maybe the 222 pattern but I have never seen him use it), AB=CD aka fib expansion levels, 3 drives, and to a lesser extent classical chart pattern like the head and shoulders, wedge, widening wedge, pennant, flag, triangle etc.
b. Add to that a confluence area of relevant support/resistance from fib's and other targets and you will get a solid likely turning point for the market.
c. He uses the Oscillator Predictor indicator to determine overbought and oversold levels. The market does not like to be OB or OS for long and will want to retrace and this is another strong area of S and R. I have yet to get a hold of this indicator so if anyone can put me in the right direction, PM me.
.
3. Devise a strategy for entering safely and exiting intelligently. Sell the rallies and buy the pull backs.
a. Entries are at a confluence retracement. This means you'll be entering with the trend.
b. Stops are placed behind the protection of a confluence area. If your stop was hit, it isn't because of random market noise. It was because your analysis was wrong. (Forex is noisier than many markets though and noise may still get you.)
c. Exits are at a logical confluence area or completion of a pattern. Often partial profits are taken because the price is likely to continue in your direction.
.
.
Glossary of terms Sive uses:
.
3x3 - Joe Dinapoli found that a 3 period SMA displaced 3 periods was useful for identifying the end of strong thrusting markets. A close across the line was confirmation the trend was over. Often the price will cross the line but not close across it. It also helps for his Double Repo pattern defined below.
.
7x5 - Joe Dinapoli found that a 7 period SMA displaced 5 periods was useful in equity markets. Sive doesn't seem to use this.
.
25x5 - Joe Dinapoli found that a 25 period SMA displaced 5 periods was useful for identifying the end of longer term trends. A close across the line was confirmation the trend was over. This can also serve to act as support or resistance. Like any support or resistance, it may be tested several times and if it has ben deisprespected, it will often be retested from the other side. There is a screen shot of this in post 9 of this thread.
.
3 drives reversal pattern - the harmonic thrusts that are each about a 1.27 extension of the last thrust.
.
"Direction overrules trend". This is from Dinapoli's book and Sive has used this phrase. A direction indicator is usually some chart pattern like an ABCD or butterfly. These patterns will want to complete before the trend can continue. So if a pattern is counter trend, direction over rules trend. Wait for the directional pattern to complete and then enter again with the trend. A butterfly is a good example of this because it is a reversal pattern. If the extension leg of the butterfly is counter trend, getting in at the completion of the butterfly puts you in with the trend and at a great price.
.
Double Repo - A directional pattern using a 3x3. If price is thrusting/trending down, then jumps up across the 3x3, down again and above again. This is a reversal pattern. It indicated the end of a strong trend. This is a zig zag that will often stop many market players out.
.
Bread and Butter Trade - A directional pattern using a 3x3. Price is thrusting/trending down (if in a down market), then jumps up across the 3x3 to close for a bar or two then continues down to complete the thrusting action. These look like a pause in a great thrust and are caused by big money taking some profit out of a big thrust. They have some positions open to let profits run and so the trend continues. The thrust should have at least 8 bars. Indicates very strong market sentiment.
.
Here's a good example of a Bread and Butter sell. In this daily EUR/USD chart, there is an ascending wedge that breaks at the end of Aug 2011. The thrust is decisive but not 8 perfect down bars. A little jump up but is contained by the 3x3. Are we in yet? No. The market retraces across the 3x3 to the 382 fib retracement level. We get in at the 382 level (in aqua marine) because the price action is so decisively down, it is VERY likely to continue down after a little pull back. It does and continues down to the 618 fib extension level (in red at the bottom) of this ABCD pattern. Bread and butter means this trade is almost a free one. Few major players want to be long after such strong thrust down. The retracement is usually someone taking profits, not a change in market sentiment.
.
.Trend - is captured by the 25x5 SMA , the 3x3 SMA and the MACD with Dinapoli's inputted numbers. The market isn't always trending.
.
ABCD - Price will move in a harmonic math function of its previous move. This ABCD pattern is built into MT4 and all serious trading platforms.
See this archived analysis under the 4 hour heading:
https://www.forexpeacearmy.com/fore...20809-forex-pro-weekly-july-16-20-2012-a.html
.
Harmonics: On 11/11/12's daily analysis video Sive spoke of using the harmonic of the currency as a safe stop loss . This is talked about in FPA's forex training. The idea is that any currency tends to move in spurts or waves that are of a certain length and those waves repeat themselves and that the waves have some predictive power on where price will go. Sive mentioned he uses the EUR/USD harmonic which is currently 37-40 pips as a safe stop loss distance. If a directional pattern will fail, it will need to fail by the harmonic to really fail. This is because if the market tests the bottom of a pattern, it may just be completing the harmonic, that is it may be just market noise and doesn't mean the pattern is completely washed out. If the market wants to not complete a pattern, it will go past its harmonic indicating decisive direction away.
.
Gartley Butterfly pattern - A reversal pattern with two linked ABCD patterns with these characteristics:
.
The first pattern has the D leg not clearing the B leg and C is a significant retracement to the A, can be 618 but usually, preferably 782. The second pattern's AB leg is the same as the first patterns CD leg. The second patterns D target is a 100%, 138.2% or 161.8% ABCD extension. Sive trades this target. This target is a bigger extension when the market shows great decisive thrust toward the target. This is a reversal pattern. At the end of the extension, there is a reversal of price and the target is either another confluence area, a weekly pivot point, the bottom of a channel or other major S/R? Help, I need a target.
See this archived analysis under the daily heading:
https://www.forexpeacearmy.com/fore...20809-forex-pro-weekly-july-16-20-2012-a.html
.
Gartley 222 pattern - This is essentially a butterfly failure. In the image here, a butterfly sell pattern would need to clear the high of the beginning of the pattern at 1.3175 and continue until the 161.8 ext or 200% extension. The 222 hit the 100% extension and did not clear the old high. It was completed 10/17/12 and resulted in a sell off. Sive spoke about it several times in the daily reveiws.
View attachment 7319
Confluence - a grouping of decision making points that are more likely to change the direction of the market. I trade pivot points on the weekly TF and you trade fibonacci's on the daily and another trader only trades psychological levels. None of us are looking at each other's charts but it so happens that all of our targets are in a 30 pips range. No one target would be enough to change the market but all of them together does.
.
Wash and Rinse - This refers to market movers moving the market intentionally to hit your stops. It allows them to get a better fill on their orders and can propel the market their way. Any classical chart pattern is suspect to the wash and rinse. For this reason, using narrow stops is a bad idea. Stop should be hidden where the sharks don't want to go, such as behind a confluence level.
.
Price action - How is the market moving in time and volitilaty? Does it look like the market is decisive? Strong thrusts indicate a safe continuation. Weak price movement indicates indecision and fear. It's easy to be wrong when the maket hasn't made up it's mind. Also, price action can be a bar or 3 bars indicating a reversal is about to take place. The pic below shows price bouncing on a support level. The lower highs were made of strong thrusts down and weak retracements. The price broke the support for an 800 pip run.
For more on chart patterns, see this link:
https://www.forexpeacearmy.com/fore...ary-japanese-candlesticks-patterns-sheet.html
.
Some of Sive's random tips:
.
Some of these are taken from the FPA school's pages such as this link and halfway down the page. Some are ones I've heard while watching the videos. Please help expand this section.
https://www.forexpeacearmy.com/fore...chapter-10-part-ii-fibonacci-retracement.html
.
1. The major Fibonacci ratios and most reliable levels are 0.382 and 0.618;
.
2. Because of that, they are extremely well-known among traders and market makers. It means that the appearance of a failure breakout, such as Wash and Rinse is very probable there.
.
3. If some level has been broken by price action – then it should be dropped out from further analysis and you have to not take it in consideration.
.
4. If the market totally disrespects some obvious and strong level, say, on weekly or monthly time frame – very often the market returns to it and tests it from the other side after breakout;
.
5. 0.5 level of some long range single up/down candle itself could be a support/resistance level, so as its low/high.
.
6. We can judge via retracement depth about further market moves. If a retracement was shallow (0.382-0.5) then we can expect a significant further move. If a retracement was deep (0.618-1.0), then any up move could be shallower, or even just back to the previous highs.
.
7. Levels could be broken - they are just temporary supports or resistances. How it looks like – you can see on chart #1. They are not “Stand forever” substance. If it was so – there will not be any simpler thing, as just to buy or sell from them. Unfortunately this is not the case.
.
8. Use Fibonacci levels only in combinations with other tools to increase probability to success.
.
9. It’s better to use levels of higher time frames to trade on lower time frames. For instance to enter long on 60-min chart, it’s better use support levels of daily time frame, etc.
.
10. The higher the time frame of the swing – the stronger retracement levels from it.
.
11. If price bounces between daily overbought to oversold, or visa versa, in a bar or two, it will want to go back to the center of those two extremes.
.
12. The weekly pivot is traded 70-80% of the time. The monthly?
.
13. Head and shoulders patterns fail as much as they work. Dinapoli says in his book: "Show me a classical chart pattern and I'll show you a classical chart pattern failure."
.
14. If the market holds above/below the support/resistance level and has not closed below/above it but just insignificantly pierced it (with candle shadows), the more probable that it still valid. So, Close price is your first assistant.
.
15. To not be trapped with stop licking (i.e. Wash and Rinse) you may act in two ways – place your stop-loss order a bit deeper or wait for the appearance of a Wash and Rinse pattern as a confirmation of the level’s strength and further upward/downward market move. After you will see, that the Stop licking pattern completed – you may enter in corresponding direction.
.
16. Wash and Rinse is a fast pattern, so if the market has broken a level (i.e. close below/above it) and holds there for 3 periods (i.e. 3 bars/candles) or more, then probably this level has been erased by market action and not valid anymore; (screen shot needed)
.
17. When price breaks the support level - later it could retest it and this area can act as resistance. The same is true for a resistance level – after breakout, it could act as support if the market will return and retest this area;
.
18. The more often price tests the level – the weaker it becomes;
.
19. The longer some level holds, the stronger could be the move after a true breakout of this level;
.
20. Treat S/R levels as an area or zone, not a hard line, especially on longer time frames, such as weekly and monthly. The longer your time frame – the wider support/resistance area.
.
21. When the butterfly pattern fails, it usually fails in a big way.
.
22. Taken from Sive's daily update 9/11/12 at about minutes 4-7. Weekly shows a new higher high. This indicates an end to the down trend. When this happens, it is common for the market to retrace deeply, at least to the 50% and often even to the 61.8%, of this new swing high because the market momentum is still down. So we expect at this point a retracement down to the 618 to form the ABC and then another thrust up making a new higher high "D" after forming a new higher low "C" which hasn't been made yet on this chart. Since Sive doesn't chase price, he doesn't buy at this swing high "B", he waits for the retracement "C" to buy. Seeing a new HH and HL as a trend changing event is classic trend following theory (and ALL the bankers see this too).
Last edited: