American Stock Exchange

MasterCard - Technical analysis

On the daily chart of the asset, a global sideways corridor of 306–380 is developing, within which the price has approached its lower border. There has not yet been a full-fledged attempt to consolidate below it but the likelihood of this remains quite high. The four-hour chart of the asset shows that if the quotes fix below the support level of 308, it is possible to continue to decline and reach an even stronger level of 280.
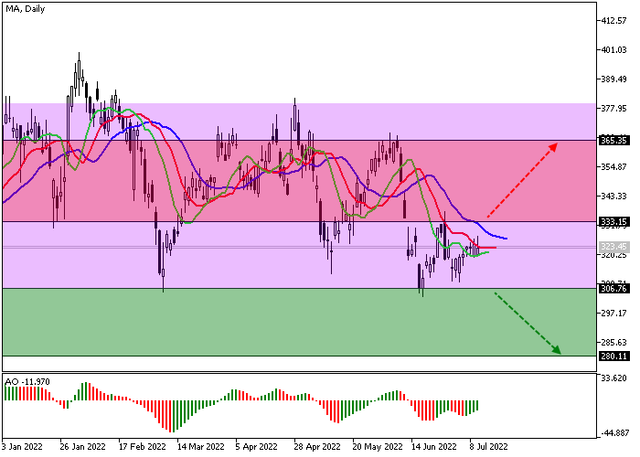
ma.png


It is confirmed by the readings of technical indicators, which, working out a local correction, keep a stable sell signal: fast EMAs on the Alligator indicator are below the signal line, and the AO oscillator histogram forms new bars below the transition level.​
 

Adobe Systems - technical analysis​

On the daily chart of the asset, the formation of a downtrend continues, which may continue after the breakdown of the global year's low at 350. On a four-hour chart, the price forms a local Flag pattern with the boundaries of 360 – 400, which increases the likelihood of a global downward movement after the breakdown of its support line.


Technical indicators reflect a possible continuation of the global decline: indicator Alligator's EMA oscillation range expands downwards, and the histogram of the AO oscillator forms downward bars in the sell zone.​
 
CAC 40 - French stock market continues to decline

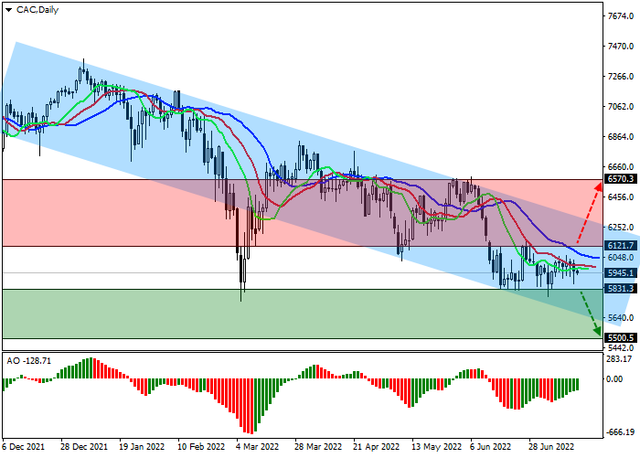
One of the leading indexes of the European economy CAC 40 is trading neutrally around 5960.5 amid the absence of macroeconomic statistics that could affect the dynamics of the instrument, as well as ahead of the start of the active phase of the publication of corporate reports.

Alstom SA, Thales Group SA and Publicis Groupe SA will present their financial results next week. While analysts do not expect positive data from Alstom SA and Publicis Groupe SA, Thales Group SA's earnings forecasts remain optimistic: the company may show revenue of 4.05 billion euros, which exceeds 3.73 billion euros shown a quarter earlier, and earnings per share are likely to be a record 3.66 euros.

cac.png


The quotes of the asset are traded as part of a global downtrend, declining in the local channel. Technical indicators are in a sell signal state: the range of EMA fluctuations on the Alligator indicator is still wide enough and the AO oscillator histogram, trading in the sales area, is forming alternating bars.

Support levels: 5830, 5500 | Resistance levels: 6120, 6570​
 
GBPUSD - The pair may grow.

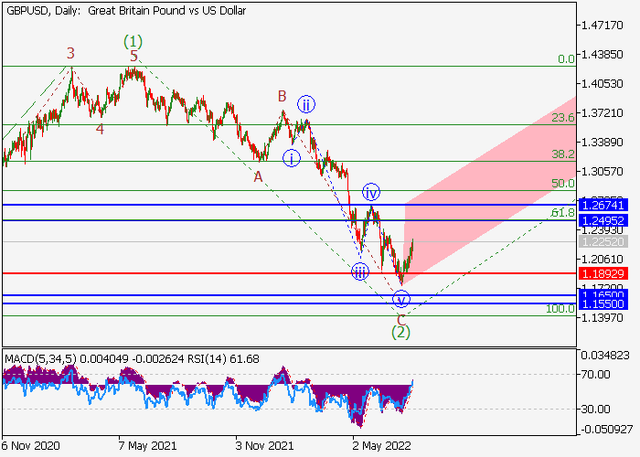
On the daily chart, the first wave of the higher level (1) formed, and a downward correction ended as the second wave (2). Now, the development of the upward third wave (3) has started, within which the first entry wave of the lower level (i) of i of 1 of (3) is developing.

If the assumption is correct, the GBPUSD pair will grow to the levels of 1.2495 – 1.2674. In this scenario, critical stop loss level is 1.1892.

gbpusd.png
 
Back
Top