American Stock Exchange

ebay-forum-1.png


On the daily chart, the price is falling within a narrow downwards channel, gradually approaching the support line. The key support is the channel's lower line, which coincides with the initial 61.8% Fibonacci extension trend level at 41.

On the 4-hour chart of the asset, it is clear that the global decline will continue, and the channel support line is only an initial target. The global downside target is the underlying trend of 100.0% for the Fibonacci expansion, around 29. Technical indicators also confirm the high probability of further decline: fast EMAs on the Alligator indicator are much lower than the signal line, and the AO oscillator histogram is forming downward bars in the sell zone.

ebay.png
 
Visa, technical analysis

The shares of Visa Inc. Class A, the largest American multinational company providing payment transaction services, are corrected at 203.00.

On the daily chart of the asset, a global side channel is developing with the boundaries of 189 - 235, and at the moment, the price has reversed upwards from its support line.

Primary signs of a reversal appeared on the four-hour chart: the price has broken the local resistance around 200.00. Technical indicators also point to a high probability of continued growth: indicator Alligator’s EMA fluctuations range began to actively narrow, fast EMAs are approaching the signal line, and the AO oscillator histogram began to form new rising bars in the sell zone.

v.png
 
cac-forum-1.png


One of the leading indexes of the European economy, CAC 40, is correcting, trading at the level of 6288.0. The French stock market is falling on the back of a recovery of positive dynamics in the bond market, and even positive reports of large components are not able to reverse the negative trend.

The day before, a large energy company Engie SA published its financial results. The company's Q1 2022 revenue rose sharply to 25.6 billion euros, well above the forecast of 14.28 billion euros. Earnings per share increased to 0.62 euros from 0.3995 euros a quarter earlier. In turn, the report of one of the largest European stock exchanges Euronext NV showed an increase in the company's income to 395.7 million euros, which exceeded 370.1 million euros a quarter earlier. At the same time, earnings per share were worse than expected and amounted to 1.35 euros against the expected 1.45 euros.

The French bond market is again showing positive dynamics. Popular 10-year bonds have returned to growth and are trading at a rate of 1.518%, while conservative 20-year treasury bonds have reached a yield of 1.855%, which is slightly behind the peak values at the beginning of the month at 1.945%.

cac.png


The index quotes are traded within the global downtrend, continuing to fall along the resistance line. Technical indicators are holding a local sell signal: the range of EMA fluctuations on the Alligator indicator is still wide enough and the AO oscillator histogram, trading in the sales area, is forming ascending bars.

Support levels: 6065, 5750 | Resistance levels: 6530, 6800​
 
ge-forum-1.png


Global sideways correction in the shares of the American diversified corporation General Electric Co. strengthens, and papers are traded slightly above 75.00.

On the daily chart of the asset, a wide downward channel with dynamic boundaries of 71 - 90 forms, within which the price has reached the support line and renewed the year’s low around 71.

On the four-hour chart, the price is heading upwards and begins to form a Head and shoulders reversal pattern, which target for working out is around the global channel resistance line 90. The readings of technical indicators confirm the high probability of upward dynamics: fast EMAs on the Alligator indicator are actively approaching the signal line, and the AO oscillator histogram is forming new rising bars in the sell zone.

ge.png
 
nq-forum-1.png


Nasdaq 100 quotes show a downtrend, being at around 11970.0. US stocks remain under strong pressure from rising bond yields, which is especially affecting technology stocks.

Since the start of the week, the popular 10-year US Treasury bonds yield has risen 1.34% to hit the levels of autumn 2018 of around 2.824%. Conservative 20-year government bonds rose 0.92% to 3.2094%, while short-term 3-month bonds, which will be auctioned today, rose 2.48%.

The focus today is on the financial results of discount department store chain Ross Stores Inc., which recorded a decline in quarterly revenue to 4.33 billion from 5.02 billion dollars in Q4 2021. In turn, earnings per share fell below 1 dollar for the first time since March 2021, to 0.97 dollars. Against the background of such a weak report, the issuer's capitalization decreased by more than 22%.

NQ.png


Index quotes form a global downward channel, being near the support line. Technical indicators are in a stable sell signal state: the range of EMA fluctuations on the Alligator indicator is expanding towards the decline, and the AO oscillator histogram is trading in the negative area forming new descending bars.

Support levels: 11690, 10500 | Resistance levels: 12580, 14200​
 
bac-forum-1.png


The shares of Bank of America Corp., one of the largest banks and analytical agencies in the US, are trading within a corrective trend around the level of 36.

On the daily chart of the asset, the price moves within the global downwards channel with dynamic boundaries 29 – 38, declining towards the support line, which coincides with the Fibonacci 61.8% retracement level at 30.

On a four-hour chart, it is clear that to continue the global decline, the instrument needs to consolidate below an intermediate correction of 50.0% Fibonacci around 34.00. The readings of technical indicators confirm the probability of this scenario: the range of fluctuations of the EMA on the Alligator indicator expands downwards, and the histogram of the AO oscillator forms downward bars in the sell zone.

bac.png
 
snap-forum-1.png


The shares of Snap Inc., the US company that owns the Snapchat messenger, are moving in a global downtrend around 13.

On the daily chart of the asset, a global downward channel is forming, which emerged from the Triangle pattern, renewing the year's low at 12.8. During yesterday's trading, the instrument formed a downward price gap, making the prospects for upward dynamics practically zero.

On the four-hour chart, it can be seen that although the quotes are near the channel support line, the most likely scenario will be a further decline to the target levels around 4. Technical indicators keep a stable sell signal: indicator Alligator's EMA fluctuations range actively expands downwards, and the histogram of the AO oscillator increases in the sell zone.

snap.png
 
cac40-forum-1.png


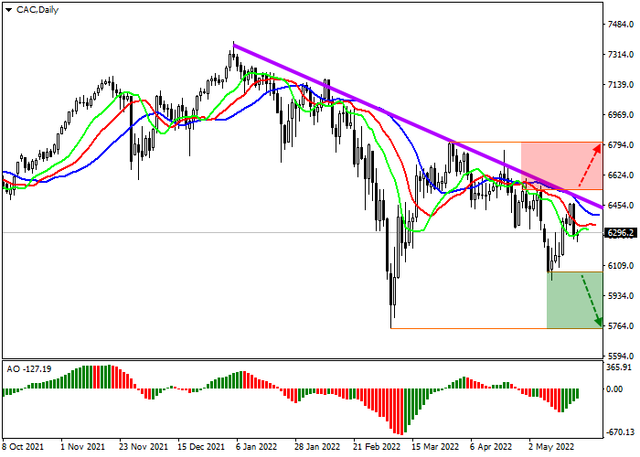
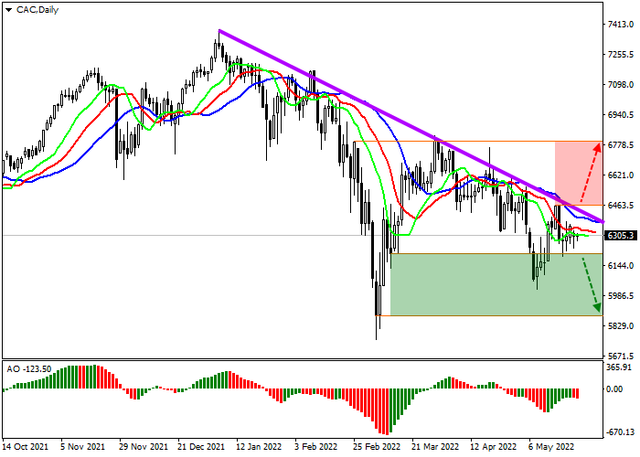
The French stock market continues to trade in a local downtrend against the backdrop of negative macroeconomic statistics and weak financial reports of the components. CAC 40 quotes are currently correcting at 6267.

The French Composite PMI was 106 points in May, down from 108.0 points last month, while Manufacturing PMI fell to 54.5 points from 55.7 points and Services PMI fell to 58.4 points from the April value of 58.9 points.

Additional pressure on the stock index was also provided by reports that the joint venture of the French corporation for the production of missile, aerospace and defense components Safran SA and the American giant in the field of manufacturing technological equipment General Electric Co. postponed the release of a new batch of aircraft engines indefinitely, which led to a fall in the company's shares.

Meanwhile, the domestic bond market continues to trade close to the highs of the year, with the popular 10-year Treasuries yielding around 1.488%, down slightly from 1.666% at the beginning of the month, and the conservative 20-year bonds yield at 1.888% after 1.963% shown in early May.

cac40.png


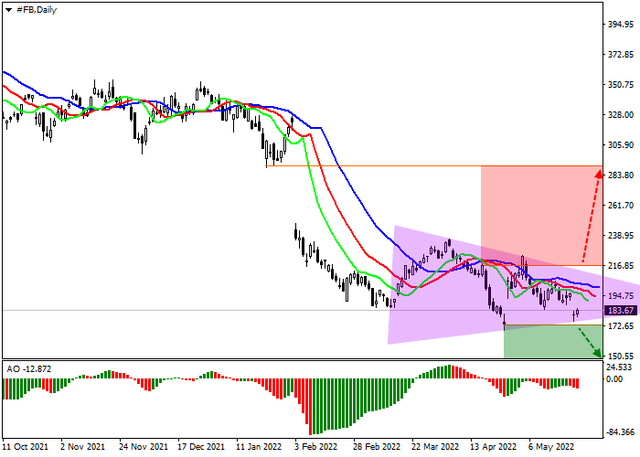
The quotes of the asset are traded as part of a global downtrend, continuing to stay close to the resistance line. Technical indicators continue holding a sell signal: the range of EMA fluctuations on the Alligator indicator is still wide enough and the AO oscillator histogram, trading in the sales area, is forming descending bars.

Support levels: 6200, 5880 | Resistance levels: 6457, 6795​


The shares of Meta Platforms Inc., which owns the world's largest social network Facebook, are trading within a downtrend around 183.

On the daily chart of the asset, a global Triangle pattern is forming with local extremums at 217 and 173, which is a trend continuation pattern, and the breakdown of its lower limit is the most likely scenario now. On a four-hour chart, the trading instrument completes the formation of another downward wave, and after the quotes break the support line at 176, the global decline may continue.

Technical indicators confirm the high probability of negative dynamics reversing downwards: fast EMAs on the Alligator indicator began to move away from the signal line, and the AO oscillator histogram is forming bars with a downward trend in the sell zone.

 
hd-forum-1.png


The shares of The Home Depot Inc., the world's largest home improvement company, are actively declining, trading around 302.

On the daily chart of the asset, a global downtrend is forming, within which the price is holding above the resistance line of the first stage of correction, forming a channel with dynamic boundaries 279–317. On a four-hour chart, it can be seen that the downwards channel is a slowdown stage for the global decline, the continuation of which may lead to a change in trend and the price reaching a local maximum at 339.

Technical indicators began to weaken the sell signal: the range of fluctuations of the EMA on the alligator indicator is actively narrowing, and the histogram of the AO oscillator is forming rising bars, quickly approaching the transition level.

hd.png
 
Back
Top