AUDUSD (long) breakout today - did anybody catch it? Lots of confluence

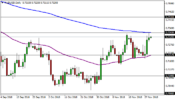
Resistance on the AUD/USD. On the daily chart of the AUD/USD we can see that the pair has reached the 200 day EMA at the 0.7343 level, where it could find a resistance and bounce to the downside. In case of a bearish bounce, the 55 day EMA at the 0.7217 could act as support. On the other hand, if the price breaks below the 55 day EMA, its next support could be the 0.7100 level. There is a slight correction on the AUD/USD and if the pair breaks above the 200 day EMA, then its next resistance could be the 55 week EMA at the 0.7431 level. Another possible scenario is that the pair may stay consolidated between the 55 day EMA and the 200 day EMA without a clear direction.
 

Attachments

  • Blog_ES_112918.png
    Blog_ES_112918.png
    19 KB · Views: 3
The AUDUSD leaves a false breakout above the 200 day EMA at the 0.7345 level. At the momment, the AUDUSD falls to the 0.7336 level and if it continues falling, it may visit again the 55 day EMA at the 0.7231 level, which could act as support.
 
The AUD/USD accelerates its bearish momentum. The AUD/USD leaves a false breakout above the 200 day EMA at the 0.7345 level and drops to the 0.7266 level, but if it continues falling, the 55 day EMA at the 0.7231 level could act as support. A breakdown below the 55 day EMA, its next support could be the 0.7100 level. To the upside, above the 200 day EMA, its next resistance could be the 55 week EMA at the 0.7430 level. Another possible scenario is that the pair may stay consolidated between the 200 day EMA and the 55 day EMA.

Blog_ES_120518.png
 
On the daily chart of the AUD/USD we can see that the pair has pulled back after reaching the 0.7224 zone. The 55 day EMA (purple line) has been acting as a support-resistance zone, but the price of the AUD/USD has broken below that moving average. The round number level at the 0.7100 zone could act as support. Below the 0.7100 level, its next support could be the 0.7000 level, but its most relevant support is at the low around the 0.6800 zone. To the upside, the 200 day EMA (blue line) at the 0.7270 level could act as resistance, followed by the 55 week EMA at the 0.7353 level.

audusd-d1-activtrades-plc.png
 
What's your long term projection on this currency pair? Australian dollar looks strong in long term because favorable demand outlook for commodities.
 
I have been almost always confident in Aussie, but this time can’t be sure. There has been such a devastating weather conditions lately which impact on the general level state of economy in the country and its consequences are to be yet seen. Hope all will end up good for Australia
 
The AUDUSD is really directionless around the 0.7200 level, but it could try to reach the 200 day EMA around the 0.7239 level. To the downside, the 0.7100 level could act as support.
 
The AUDUSD has been dropping steadily during this week from the 0.7100 level to the 0.7000 zone, but it may find some support at current levels. Another possible scenario is that the pair may get stuck between those two levels.
 
The AUDUSD bounce to the upside from the 0.7000 level and it could pull back to the 0.7100, which could act as resistance. Around the 0.7100 level we can also find the 55 day EMA, which could act as resistance.
 
The AUDUSD is stuck between the 0.7100 level as resistance and the 0.7000 level as support. Above the 0.7100 level, its next resistance could be the 200 day EMA around the 0.7215 level. Below the 0.7000 level, its next support could be the 0.6900 level.
 
Back
Top