Chris_447
Followme Representative
- Messages
- 26
Black Swan Event
A Black Swan is an unpredictable event and mostly out of the norm. It usually causes a domino effect (negative) in the market, sometimes even a catastrophe.
In general, a Black Swan event has to fulfil these three conditions:
- it happens unintentionally;
- it creates a significant impact;
- despite being an unintentional event, somehow our human nature instinct tends to drive us to believe that there is a bigger picture behind the event, and this makes it actually explainable and predictable at some level.
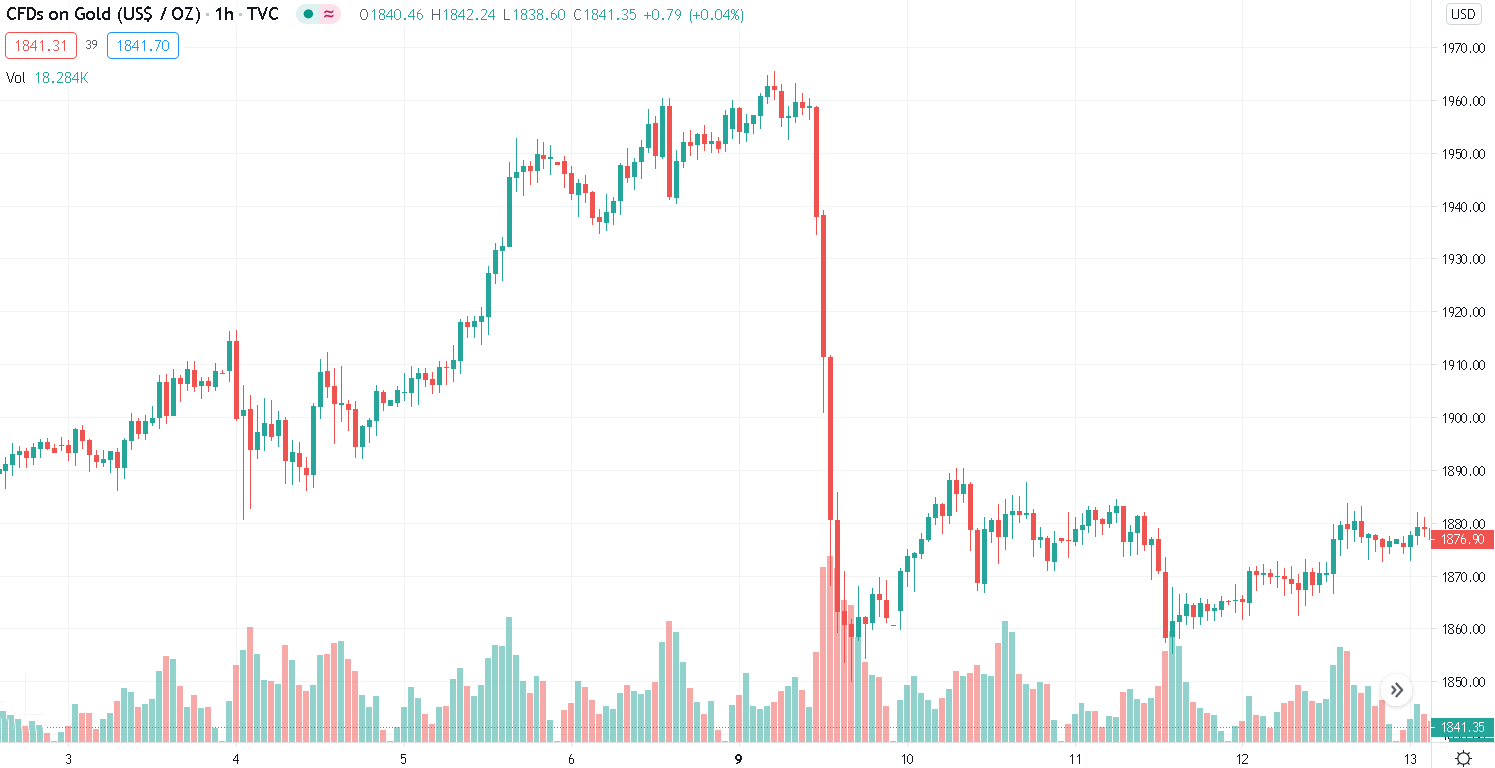
On November 9’s evening (GMT+8), Pfizer Inc. announced that it has produced a vaccine that could stop the coronavirus infection with a 90% effective rate. The announcement initiated a frenzy over the Euro and U.S. dollar in the trading market. This resulted in a substantial surge across the major stocks prices while the gold market suffered a drop of more than a thousand dollars within this short span of time.
This is the perfect opportunity for us to study the black swan event that occurred during this time’s gold trading data. Many accounts’ equity went through a significant change during this period. 17 of them earned more than $10,000 on that night but there were also 34 of them who lost more than $10,000 at the same time. We hope to provide some clarity and inspiration to our users through the analysis of FOLLOWME’s social trading community’s substantial amount of connected accounts.
DATA STATEMENT
Symbol: XAU/USD
Order Time: November 9, 7 p.m. to November 10, 1 a.m.
The actual time of the significant drop in gold price (more than a thousand dollars) was on November 9, 7:40 p.m. (GMT +8) until November 10, at about 1:00 a.m. Considering the trading continuity and the correlation between the single events that occurred within, we will perform the data analysis from November 9, 7 p.m. till November 11, 12:00 a.m. (as the order cycle period).
Overall Data
There were a total of 3,231 real accounts trading gold futures, 62,906 closed orders, a total loss of $1.72 million and 8,744.49 lots. The average closed orders of the real accounts in the community trading gold symbol range from 25,000 to 30,0000. On November 9, the closed orders went up by 60% to 43, 296 and this proves that this type of Black Swan event actually promotes the activeness of the traders.
Based on the types of traders - regardless of individual traders or copy traders, the ratio of the profitable accounts were about 50%, especially the copy traders - with almost 59% of them making a profit.

Based on the data of profitable and loss-making accounts, even though the accounts ratio is 0.5:0.5, yet the average profit amount versus the average loss amount ratio is as high as 1:3.

Data of profitable and loss-making accounts order

Data Analysis of the Gold Price Downtrend
It took about five hours for the precious metal price to rebound from a sharp decline. The table below shows the average opened and closed positions for the orders every hour respectively. Let's take a look at the performance differences across the opened and closed orders.

- 70% of orders were long positions and this indicates that most people do not intend to take advantage of the trend to short the trade during the crash, but rather buy at the bottom and go long.
- For the table above, we can see based on the amount of orders, the transactions were more active during the first two hours of the decline in gold prices, and then gradually decreased.
- The average price of the long positions is relatively close to the short positions, this indicates that the traders' decision on making long and short trades are quite similar.

- Order amount for both opened and closed positions are broadly similar, indicating that most of the transactions are short-term trade.
- Out of the accumulated opened and closed positions during these five hours, the ratio of the long position order in both opened and closed orders were 70.7% and 61.7%. In the case that both total number of opened and closed positions are similar, it can be explained that most of the orders are being held without closing the position.
- There are more profitable orders than lost orders. Even so , the profit and loss ratio are 1:2, this indicates that profitable orders have a short holding period, while lost orders have a longer holding period.

- As shown in the table above, most of the orders are short-term transactions. This further proves that the uncertainty and fear of the market trend dominates the trading psychology, as well as the trader’s mindset and desire to earn quick profit.
First, before and during the decline in gold price, the total order number for both opened and closed positions were 4,869.
60% orders were profitable, with an average profit of $185 and an average profit of 154 points.
The above order includes some long-term orders holding the position for half a year or more than a year. The overall data is slightly better than the orders opened during the decline.
Second, 23,408 orders were closed before the end of the decline, accounting for 82.75% of the orders opened during the decline.
- There were a total of 15,597 long position orders, accounting for 68% of the total orders, a loss of $2,192,305, and an average holding time of 0:16:19.
- 6,507 long position orders were profitable, accounting for 41.7% of the total long position orders, total profit of $328,274, and an average profit of 30 points.
- 9,033 orders were lost orders, accounting for 58.3% of long position order, loss of 2,520,579, and average loss of -118 points.
- Based on the average profit and loss ratio of 1:4, the transactions made during the huge decline in gold price were unfavorable. While there is a 41.7% chance of gaining 30-point profit, there is also a 58.3% chance of making a 118-point loss.
- 7,451 of the total in this category were short position orders, accounting for 32% with a total profit of $275,373 and an average holding time of 0:13:15.
- 5,859 were profitable orders, accounting for 78.6% of the total short position orders. The total profit made was $354,446 at an average profit of 56-point. On the other hand, 1,548 were loss-making orders, accounting for 21.4% of the total short orders with a total loss of $79,122 and an average loss of 35-point.
- 4,037 orders were opened during the decline and closed after the decline. At the time of writing, there are still 763 outstanding orders.
- Out of the total closed orders, 86% were long positions and 63% of them made a profit. 91% of the profitable orders were long positions, with an average opening price of $1,866.4, an average profit of $87 and 94 profit points.
- Based on the average opening price, most of the orders were opened during the end of the decline. As for the average profit points, most of the orders were closed during the first half of the rebound wave.
- 37% orders were lost orders, 78% of which were long position orders, with an average opening price of 1,889.51, an average loss of -$326, and an average loss of 223 points.
- It is noticeable from the average opening price that most of these orders were opened before the decline. For the average loss point, it can be seen that most of these orders were closed when the gold market trend stopped falling.
Out of the 62,906 closed orders from Nov 9, 2020 (7:00 a.m.) to Nov 11, 2020 (12:00 a.m.), a total of 19,802 orders had a stop-loss setting put in place, accounting for 31% of the total orders.
The long position orders took up 57% with the short position orders made up the rest with an average loss of $11 or 7-points loss.
In terms of profit and loss, the profitable orders were 53%, with an average 49-point profit,
The loss-making orders were 47% out of the total with an average loss of 69-point. Compared with the average loss of the total loss-making orders, this was lower than the latter by 34-point, confirming that the stop-loss setting put in place has indeed reduced the loss-making amount to a certain extent.
Chris,
FOLLOWME