Forexwatchman
Sergeant
- Messages
- 198
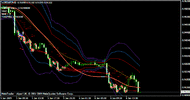
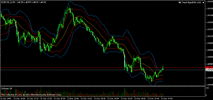
So there is a debate going on in my own trading world regarding the effectiveness of both of these indicators, and I thought it would be a good thing to have on here for debate as well. The question is: Are Bollinger Bands better due to their more sensitive nature in relation to volatility, or are envelopes (a.k.a. Standard Deviations of a Moving Average) more effective because of there consistency? I personally use the envelopes due to the advice of Andrei Pehar, who once said during a live webinar that he heard first hand from experts that Bollinger Bands are only used to set prices on Futures and are never used in currency trading by the big dogs. But he's only one opinion, what's yours?
")