Sive Morten
Special Consultant to the FPA
- Messages
- 18,659
Good morning,
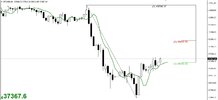
BTC now is treated as 2nd quality risky asset, which explains its significant collapse on the deteriorating of the market sentiment. We suggest that the reaching of 26K area is just a question of time.
BTC now is treated as 2nd quality risky asset, which explains its significant collapse on the deteriorating of the market sentiment. We suggest that the reaching of 26K area is just a question of time.