Triantus Shango
Sergeant Major
- Messages
- 1,371
some people have been asking me how i scalp the e/j. so i figured there are probably more people who might be curious about another trader's setup and perhaps it might help or give some insights to some. first of all, if you find the following complicated it's because it's hard to put into words. but if you look at the attached charts, you will see it's quite simple in fact.
one more thing: on some charts at the very bottom of the screen i have an indicator that looks like the MACD--i am just testing it for now, so that's why i don't mention it in the explanations below. so think of the charts as having only 2 non-overlay indicators: MACD and DPO.
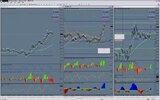
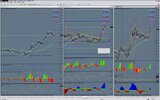
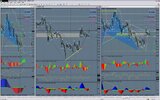
you will find 4 screenshots attached: 2 screenshots show a desktop with, from left to right, M1, M5 (always with bollinger bands), M15: in one screenshot, M15 has no bollinger bands but has the 3 lines from bill williams' alligator indicator, and in the other, M15 has bollinger bands overlaid and no alligator.
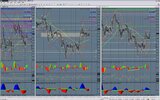
and the 2 other screenshots, also from left to right, show H4, M30, H1--one screenshots shows charts without bollinger bands, and the other screenshot shows the same time frames (TFs) but with bollinger bands.
ok, now that that is clear, let's begin.
---
first, i know, we should keep it simple, but let's not make the mistake of making it too simple. so if you feel the following is too complicated, let me just say that it is in the middle: not too simple and not too complicated. go too simple, and you'll probably never see some opportunities. similarly, make it too complicated, like i used to, and you won't see jack either with all the squiggly lines blinding you to the price action.
now, on some charts you will see fibonacci retrace and extension lines, which makes the chart somewhat harder to read. i'm used to it. but of course, after identifying the key levels you can delete the fib retrace/extension structures and mark the k-areas and agreements areas with a rectangle--that's what those grey blocks you see on some charts mean.
so… i use 2 sets of charts: 1 with no bollinger bands (BBs), and the other one with BBs. both sets include M1, M5, M15, M30, H1, H4. daily, weekly, monthly are not shown here but the same principles apply.
overlay indicators:
- bollinger bands (17 periods, overlay standard deviation 1, 2, and 3) on M5 always , but when trading M1/M5/M15 i usually don't find it necessary to use BBs on M1 and M15; i might sometimes look at M15/M30/H1/H4 with BBs to check how many standard deviations the price is at, especially if price has been 3 standard deviations away from the mean on M5 for a while (more on this later);
- bill williams fractals and alligator indicators (default values) on M1/M15 and above--not on M5 and no alligator on charts with BBs;
- 100 and 200 MAs: sometimes 'linear weighted' gives a better indication of SPPT/RSST than 'simple', so i mix it up: on 1 set of charts i use SMA and on the other i use LW, that is to say, for example, set1/H4 with SMA and set2/H4 with LW;
- MACD Predictor only on H1 and higher but not on charts that have BBs.
non-overlay indicators:
- MACD (dinapoli settings) to identify divergences;
- DPO (7 periods, 0 shift, adjusting the shift will smooth out the indicator) to identify OS/OB and potential directional turns (DPO also shows divergences, so sometimes a divergent underlying directional change might be underway and not appear yet on MACD but appear on DPO; some people might prefer Slow Stochastic to DPO BUT at times Slow Stochastic will cross the mid line at 50 and go all the way to the edge of the OB zone, sometimes even into it, when DPO will clearly show that it can't cross over its mid line at 0.0, which means we are not OB at all and in fact market is struggling to go higher; thus, the Slow Stochastic might give the wrong impression here and lead you to reach the wrong conclusion).
i am not using the 3x3, 7x5, and 25x5 DMA (displaced MA) anymore.
i also use fibonacci retrace levels and harmonic patterns such as AB=BD, 3-drives, gartley 222s, butterflies and variations thereof such as bats and crabs, which means i also use fibonacci extensions.
and also, candle shapes and patterns are relevant in some cases even if no patterns are apparent on MACD or DPO.
intraday strategy:
whenever SPPT/RSST is mentioned, it is implied that harmonic patterns and fibonacci retracements and extensions are also taken into consideration, which means, for example, that if it so happens that a major MA is right at the current price level (+/- 10 or 15 pips), and DPO is coming out from OB/OS, i will also look at the fib levels and potential harmonic patterns, if any. and so, for example, if price is also reaching a 61.8% node and/or a K-area with or without an agreement as well, then the chances are pretty good that we have a SPPT/RSST area that will hold and a decent trade opportunity. it's hard to put into words, but i think you can imagine and get the picture. (read the books if you don't know what K-area = confluence area, harmonic patterns, bollinger bands mean.)
now, let's take a look at the different steps i go through to decide whether or not to initiate a trade and in which direction:
1- identify SPPT/RSST working from monthly time frame down to shorter TFs using a combination of previous highs/lows (the highest and the lowest of course), fibonacci retrace levels, OB/OS levels, fractals location, and price location relative to the former and MAs and/or alligator (which is just a bunch of sensitive MAs);
2- determine the weekly range and the previous day's range; this gives us the theoretical highest RSST and lowest SPPT;
3- determine whether the price is ranging or trending by using the BBs;
4- if ranging, make sure that the range is wide enough to make it possible to scalp on M1/M5/M15; use the BBs and the difference between previous highs and lows to see how wide the range is; if wide enough, then:
4.1. on M1/M5/M15 use DPO to buy/sell when indicator comes out of extreme lows/highs; MACD should also be coming back towards the 0 line from a low/high and should cross the 0 line and turn after making a new top/low which is where you can exit the trade or when DPO starts turning after reaching the other extreme;
4.2. if price is below/above both 100/200 MA and alligator and keeps bumping into them but unable to cross them, watch if price seems to gradually rise/drop; usually this is the early sign that market will stop ranging and start producing more trend-like, more strongly directional moves;
4.3. if price is between the 100 and 200 MAs, and that range is wide enough, you may buy/sell as price ping-pongs between the MAs until the range becomes too narrow;
4.4. on M1: the key to know when price will turn is DPO; it has to come out from an extreme low/high, i.e. OB/OS; also, if not coming out from OB/OS, check if price seems to consistently bounce off a little from one or more MAs or alligator, thereby indicating some sort of SPPT/RSST and enter a trade in the direction away from the MAs but remember: close the trade quickly; you make money from making 10 trades or more each 10 to 20 pips in profit.
4.5. correlate with what M5/M15 is showing you; obviously, the wider the range, the more useful M5/M15, and vice versa;
5- if trending, start by looking at daily, H4, H1, M30:
5.1. the trend is about to start:
5.1.1. first, do not assume that the initial move is going to be the trend; very often the market moves one way, establishes a 2nd or 3rd top/bottom, only to reverse and start trending in earnest;
5.1.2. if (5.1.1) already occurred when you are ready to trade, then:
5.1.2.1. if we have a harmonic pattern on M30/H1/H4/daily, then trade it accordingly; ideally MACD and DPO should confirm;
5.1.2.2. if no harmonic patterns, determine price position relative to probable SPPT/RSST and relative to MAs and alligator and fractals and BBs AND look for possible divergences on MACD and DPO to decide whether to buy or sell on M30/H1/H4; you can now choose to let the trend unfold and manage the trade from M30/H1/H4 only OR monitor the trade from both M1/M5/M15 and M30/H1/H4 to also grab significant pullbacks within the trend.
5.1.2.3. on M30, use fractals and alligator cross-overs (i mean price crossing over the MAs/alligator) and DPO and MACD patterns as signals; on H1/H4 use 100/200 MAs cross-overs or bounces off the 100/200 MAs, alligator cross-overs with confirmation from fractals and MACD/DPO patterns; of course, since we are talking about the start of a trend, the charts with the BBs should clearly confirm that as well, such as price coming out of the so-called squeeze, expanding bands and price walking between band 1 and 2;
5.2. the trend has already started:
5.2.1. wait for a pullback to a fib level and if not, then watch if trend resumes after hitting the alligator or the 100/200 MA to enter BUT this does not mean you have to wait until price actually touches those MAs because sometimes it doesn't and sometimes it slices through only to turn around; if DPO and/or MACD are aligned in the direction of the trend at that point, you have good confirmation; if not, then the pullback might continue and you might have entered somewhat early; or worst case scenario, we have a full-fledged reversal about to hit all the stops;
5.2.2. if no clear pullback, drop down to M1/M5/M15 and scalp without forgetting the day's trend direction, which means that your contra-trend scalps must be very short-lived; the reason for this is that we don't know where the trend will end, only probabilities; so let's imagine you joined the trend at a point when it is really close to ending, and since you don't know that until it happens, the shorter TFs will show you clearly the trend coming to exhaustion when it happens; of course, higher TFs such as M30 will also show candles pulling away from BB standard deviation 3 and 2; so as price bounces off the bottom/top, you can profit, and then profit again when it rebounces and starts retracing;
6- finally, watch the MACDPredictor and the stop grabber (SG) pattern as explained by sive; but basically, watch for when price is looking like it wants to cross the MACDPredictor, but then pulls back leaving a long shadow/wick in its wake on the other side of the MACDPredictor; this pattern combined with the other ones, gives you a good idea of the direction the market is taking or about to take IN THE VERY SHORT TERM.
anyhow, it's kind of hard to explain how to combine all these tools together but that's all that's needed. very simple and the same patterns repeat and are clearly visible most of the time. one of the key to doing this well is to correlate between M1/M5/M15 and M30/H1/H4. in very slow markets with low volatility, you can ignore M1. actually you can always ignore M1 if you want, but then you shouldn't try to scalp only 5 or 10 pips at a time because the higher time frames obviously don't give enough of a fine grained resolution for precision scalping.
Bollinger Bands--how to use them in this context:
BBs are useful especially after a trending move has started because on M1/M5 you will have pullbacks and you might want to reverse your trade BUT it might just turn out to be a very tiny pullback (no more than 5 to 10 pips, for ex.) even though you might have got all the right signals from MACD and DPO etc. the BBs let you see at what standard deviation the price is and let you gauge the progress of the trending move.
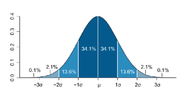
so, for example, we know from probability theory that if the probability distribution of the probability of an event happening is a normal distribution (cf. attached graph, then if the standard deviation of a particular data point in the sample (in this case that would be price) is high, such as 3 for example, then we know we are dealing with an event that is not as frequent as those event who are closer to the mean, which means we can reasonably expect that such an event will be short lived, that is to say, it will not stay for very long 3 standard deviations away from the mean, which is the mid bollinger band.
another way of saying this, according to wikipedia, is as follows: 'the probability of seeing a normally-distributed value that is far (i.e. more than a few standard deviations) from the mean drops off extremely rapidly.'
now, since we know that the forex market can be characterized as mostly in range mode more than trend mode, then when we have a trend that pushes the price to 3 standard deviations, we know that that is not a frequent event and that the market will want to revert to the mean and range again, to go back to its usual state. therefore, any time the price is between the 2nd and 3rd standard deviation, or even better, pushing on the 3rd standard deviation to the point that it even goes beyond the 3rd bollinger band, then we know from the normal distribution that the probability attached to such an event is low, and therefore we know that a reversion to the mean or at least a pullback to standard deviation 2 and 1 is probably imminent. furthermore, if in some exceptional case the price stays at standard deviation 3 for much longer than usual, then we know that it will snap back even more spectacularly than usual. so when this happens on H1 or H4 or daily, then this means that on M1/M5/M15 you should see a nice contra move, and especially so when the price is also walking the 3rd standard deviation band on M5. it's an extreme behavior and it usually snaps back and you can make some good pips but you got to be quick.
and so on. the key really is to learn how to mix and match the different tools and therefore views of the market they give you in such a way as not to oversimplify and not obfuscate what's on screen and you'll be fine. so good luck to you.
references:
the FPA school: Forex Military School | Complete Forex Education by a Pro Banker - Forex Peace Army Forum
'trade what you see', by larry pesavento and leslie jouflas
'trading with dinapoli levels', by joe dinapoli
'bollinger on bollinger bands', by john bollinger
one more thing: on some charts at the very bottom of the screen i have an indicator that looks like the MACD--i am just testing it for now, so that's why i don't mention it in the explanations below. so think of the charts as having only 2 non-overlay indicators: MACD and DPO.
you will find 4 screenshots attached: 2 screenshots show a desktop with, from left to right, M1, M5 (always with bollinger bands), M15: in one screenshot, M15 has no bollinger bands but has the 3 lines from bill williams' alligator indicator, and in the other, M15 has bollinger bands overlaid and no alligator.
and the 2 other screenshots, also from left to right, show H4, M30, H1--one screenshots shows charts without bollinger bands, and the other screenshot shows the same time frames (TFs) but with bollinger bands.
ok, now that that is clear, let's begin.
---
first, i know, we should keep it simple, but let's not make the mistake of making it too simple. so if you feel the following is too complicated, let me just say that it is in the middle: not too simple and not too complicated. go too simple, and you'll probably never see some opportunities. similarly, make it too complicated, like i used to, and you won't see jack either with all the squiggly lines blinding you to the price action.
now, on some charts you will see fibonacci retrace and extension lines, which makes the chart somewhat harder to read. i'm used to it. but of course, after identifying the key levels you can delete the fib retrace/extension structures and mark the k-areas and agreements areas with a rectangle--that's what those grey blocks you see on some charts mean.
so… i use 2 sets of charts: 1 with no bollinger bands (BBs), and the other one with BBs. both sets include M1, M5, M15, M30, H1, H4. daily, weekly, monthly are not shown here but the same principles apply.
overlay indicators:
- bollinger bands (17 periods, overlay standard deviation 1, 2, and 3) on M5 always , but when trading M1/M5/M15 i usually don't find it necessary to use BBs on M1 and M15; i might sometimes look at M15/M30/H1/H4 with BBs to check how many standard deviations the price is at, especially if price has been 3 standard deviations away from the mean on M5 for a while (more on this later);
- bill williams fractals and alligator indicators (default values) on M1/M15 and above--not on M5 and no alligator on charts with BBs;
- 100 and 200 MAs: sometimes 'linear weighted' gives a better indication of SPPT/RSST than 'simple', so i mix it up: on 1 set of charts i use SMA and on the other i use LW, that is to say, for example, set1/H4 with SMA and set2/H4 with LW;
- MACD Predictor only on H1 and higher but not on charts that have BBs.
non-overlay indicators:
- MACD (dinapoli settings) to identify divergences;
- DPO (7 periods, 0 shift, adjusting the shift will smooth out the indicator) to identify OS/OB and potential directional turns (DPO also shows divergences, so sometimes a divergent underlying directional change might be underway and not appear yet on MACD but appear on DPO; some people might prefer Slow Stochastic to DPO BUT at times Slow Stochastic will cross the mid line at 50 and go all the way to the edge of the OB zone, sometimes even into it, when DPO will clearly show that it can't cross over its mid line at 0.0, which means we are not OB at all and in fact market is struggling to go higher; thus, the Slow Stochastic might give the wrong impression here and lead you to reach the wrong conclusion).
i am not using the 3x3, 7x5, and 25x5 DMA (displaced MA) anymore.
i also use fibonacci retrace levels and harmonic patterns such as AB=BD, 3-drives, gartley 222s, butterflies and variations thereof such as bats and crabs, which means i also use fibonacci extensions.
and also, candle shapes and patterns are relevant in some cases even if no patterns are apparent on MACD or DPO.
intraday strategy:
whenever SPPT/RSST is mentioned, it is implied that harmonic patterns and fibonacci retracements and extensions are also taken into consideration, which means, for example, that if it so happens that a major MA is right at the current price level (+/- 10 or 15 pips), and DPO is coming out from OB/OS, i will also look at the fib levels and potential harmonic patterns, if any. and so, for example, if price is also reaching a 61.8% node and/or a K-area with or without an agreement as well, then the chances are pretty good that we have a SPPT/RSST area that will hold and a decent trade opportunity. it's hard to put into words, but i think you can imagine and get the picture. (read the books if you don't know what K-area = confluence area, harmonic patterns, bollinger bands mean.)
now, let's take a look at the different steps i go through to decide whether or not to initiate a trade and in which direction:
1- identify SPPT/RSST working from monthly time frame down to shorter TFs using a combination of previous highs/lows (the highest and the lowest of course), fibonacci retrace levels, OB/OS levels, fractals location, and price location relative to the former and MAs and/or alligator (which is just a bunch of sensitive MAs);
2- determine the weekly range and the previous day's range; this gives us the theoretical highest RSST and lowest SPPT;
3- determine whether the price is ranging or trending by using the BBs;
4- if ranging, make sure that the range is wide enough to make it possible to scalp on M1/M5/M15; use the BBs and the difference between previous highs and lows to see how wide the range is; if wide enough, then:
4.1. on M1/M5/M15 use DPO to buy/sell when indicator comes out of extreme lows/highs; MACD should also be coming back towards the 0 line from a low/high and should cross the 0 line and turn after making a new top/low which is where you can exit the trade or when DPO starts turning after reaching the other extreme;
4.2. if price is below/above both 100/200 MA and alligator and keeps bumping into them but unable to cross them, watch if price seems to gradually rise/drop; usually this is the early sign that market will stop ranging and start producing more trend-like, more strongly directional moves;
4.3. if price is between the 100 and 200 MAs, and that range is wide enough, you may buy/sell as price ping-pongs between the MAs until the range becomes too narrow;
4.4. on M1: the key to know when price will turn is DPO; it has to come out from an extreme low/high, i.e. OB/OS; also, if not coming out from OB/OS, check if price seems to consistently bounce off a little from one or more MAs or alligator, thereby indicating some sort of SPPT/RSST and enter a trade in the direction away from the MAs but remember: close the trade quickly; you make money from making 10 trades or more each 10 to 20 pips in profit.
4.5. correlate with what M5/M15 is showing you; obviously, the wider the range, the more useful M5/M15, and vice versa;
5- if trending, start by looking at daily, H4, H1, M30:
5.1. the trend is about to start:
5.1.1. first, do not assume that the initial move is going to be the trend; very often the market moves one way, establishes a 2nd or 3rd top/bottom, only to reverse and start trending in earnest;
5.1.2. if (5.1.1) already occurred when you are ready to trade, then:
5.1.2.1. if we have a harmonic pattern on M30/H1/H4/daily, then trade it accordingly; ideally MACD and DPO should confirm;
5.1.2.2. if no harmonic patterns, determine price position relative to probable SPPT/RSST and relative to MAs and alligator and fractals and BBs AND look for possible divergences on MACD and DPO to decide whether to buy or sell on M30/H1/H4; you can now choose to let the trend unfold and manage the trade from M30/H1/H4 only OR monitor the trade from both M1/M5/M15 and M30/H1/H4 to also grab significant pullbacks within the trend.
5.1.2.3. on M30, use fractals and alligator cross-overs (i mean price crossing over the MAs/alligator) and DPO and MACD patterns as signals; on H1/H4 use 100/200 MAs cross-overs or bounces off the 100/200 MAs, alligator cross-overs with confirmation from fractals and MACD/DPO patterns; of course, since we are talking about the start of a trend, the charts with the BBs should clearly confirm that as well, such as price coming out of the so-called squeeze, expanding bands and price walking between band 1 and 2;
5.2. the trend has already started:
5.2.1. wait for a pullback to a fib level and if not, then watch if trend resumes after hitting the alligator or the 100/200 MA to enter BUT this does not mean you have to wait until price actually touches those MAs because sometimes it doesn't and sometimes it slices through only to turn around; if DPO and/or MACD are aligned in the direction of the trend at that point, you have good confirmation; if not, then the pullback might continue and you might have entered somewhat early; or worst case scenario, we have a full-fledged reversal about to hit all the stops;
5.2.2. if no clear pullback, drop down to M1/M5/M15 and scalp without forgetting the day's trend direction, which means that your contra-trend scalps must be very short-lived; the reason for this is that we don't know where the trend will end, only probabilities; so let's imagine you joined the trend at a point when it is really close to ending, and since you don't know that until it happens, the shorter TFs will show you clearly the trend coming to exhaustion when it happens; of course, higher TFs such as M30 will also show candles pulling away from BB standard deviation 3 and 2; so as price bounces off the bottom/top, you can profit, and then profit again when it rebounces and starts retracing;
6- finally, watch the MACDPredictor and the stop grabber (SG) pattern as explained by sive; but basically, watch for when price is looking like it wants to cross the MACDPredictor, but then pulls back leaving a long shadow/wick in its wake on the other side of the MACDPredictor; this pattern combined with the other ones, gives you a good idea of the direction the market is taking or about to take IN THE VERY SHORT TERM.
anyhow, it's kind of hard to explain how to combine all these tools together but that's all that's needed. very simple and the same patterns repeat and are clearly visible most of the time. one of the key to doing this well is to correlate between M1/M5/M15 and M30/H1/H4. in very slow markets with low volatility, you can ignore M1. actually you can always ignore M1 if you want, but then you shouldn't try to scalp only 5 or 10 pips at a time because the higher time frames obviously don't give enough of a fine grained resolution for precision scalping.
Bollinger Bands--how to use them in this context:
BBs are useful especially after a trending move has started because on M1/M5 you will have pullbacks and you might want to reverse your trade BUT it might just turn out to be a very tiny pullback (no more than 5 to 10 pips, for ex.) even though you might have got all the right signals from MACD and DPO etc. the BBs let you see at what standard deviation the price is and let you gauge the progress of the trending move.
so, for example, we know from probability theory that if the probability distribution of the probability of an event happening is a normal distribution (cf. attached graph, then if the standard deviation of a particular data point in the sample (in this case that would be price) is high, such as 3 for example, then we know we are dealing with an event that is not as frequent as those event who are closer to the mean, which means we can reasonably expect that such an event will be short lived, that is to say, it will not stay for very long 3 standard deviations away from the mean, which is the mid bollinger band.
another way of saying this, according to wikipedia, is as follows: 'the probability of seeing a normally-distributed value that is far (i.e. more than a few standard deviations) from the mean drops off extremely rapidly.'
now, since we know that the forex market can be characterized as mostly in range mode more than trend mode, then when we have a trend that pushes the price to 3 standard deviations, we know that that is not a frequent event and that the market will want to revert to the mean and range again, to go back to its usual state. therefore, any time the price is between the 2nd and 3rd standard deviation, or even better, pushing on the 3rd standard deviation to the point that it even goes beyond the 3rd bollinger band, then we know from the normal distribution that the probability attached to such an event is low, and therefore we know that a reversion to the mean or at least a pullback to standard deviation 2 and 1 is probably imminent. furthermore, if in some exceptional case the price stays at standard deviation 3 for much longer than usual, then we know that it will snap back even more spectacularly than usual. so when this happens on H1 or H4 or daily, then this means that on M1/M5/M15 you should see a nice contra move, and especially so when the price is also walking the 3rd standard deviation band on M5. it's an extreme behavior and it usually snaps back and you can make some good pips but you got to be quick.
and so on. the key really is to learn how to mix and match the different tools and therefore views of the market they give you in such a way as not to oversimplify and not obfuscate what's on screen and you'll be fine. so good luck to you.
references:
the FPA school: Forex Military School | Complete Forex Education by a Pro Banker - Forex Peace Army Forum
'trade what you see', by larry pesavento and leslie jouflas
'trading with dinapoli levels', by joe dinapoli
'bollinger on bollinger bands', by john bollinger
Attachments
Last edited: