Crude Oil by Solid ECN


news-oil-1.jpg

On the daily chart, the upward wave C forms, within which the first wave 1 of (1) of C developed, and a downward correction develops as the second wave 2 of (1) of C. Now, the wave of the lower level a of 2 is developing, within which the correctional wave (ii) of a and the wave (iii) of a has ended.

If the assumption is correct, after the end of the local correction (iv) of the price will fall to the levels of $82.3 - $67. In this scenario, critical stop loss level is $118.28.

oil.png
 
crude oil-forum.png


Benchmark Brent Crude Oil prices are correcting downwards, trading just above $100 a barrel.
The escalation of the military conflict on the territory of Ukraine, which has become the cause of unprecedented anti-Russian sanctions, causes investors to fear that there will be a shortage of supply on the market due to the refusal of some countries to import Russian energy resources. However, OPEC Secretary General Mohammed Barkindo acknowledged that the European Union has little to replace the oil it imports from Russia, and because of the sanctions, the world market may face the loss of about 7M barrels of Russian oil per day.

The pressure on the market comes from unprecedented measures to release reserve reserves of their oil in 120M barrels by countries participating in the International Energy Agency, such as the United States, Japan, and South Korea, to stabilize market prices. Also, to the release by the IEA countries of 120M barrels, 60M barrels will fall on the main member of the agency, the United States, which will supply an additional 120M barrels of its reserves to the market independently. Japan has already released 15M barrels, and South Korea is preparing to increase its supply by 7.23M barrels.

The market has another reason. It is no secret that the largest positions are formed on the stock exchange in double positions called "spread." There is a historical situation when the index of the ratio of the US dollar to a basket of world currencies, USD Index, and Brent Crude Oil cost the same. Quotes of both the dollar index and oil are around 100, which creates the possibility of working on expanding the difference in these prices in both directions at once. In other words, both positions are being formed on the rise in oil/fall in the dollar index and the fall in oil/rise in the dollar index. In any case, the amount of money in this position is already huge, which is evident from the volatility, and, therefore, this will lead to serious price fluctuations soon.

oil.png


On the global chart, the price continues to trade within the formation of the global Triangle pattern. Technical indicators reversed and gave a sell signal: the range of fluctuations of the Alligator EMA began to expand downwards, and the histogram of the AO oscillator moved into the sell zone.

Resistance levels: 103.44, 118.07 | Support levels: 96.20, 81.44​
 
Crude Oil, "black gold" resumed growth

Yesterday, Brent Crude Oil prices were actively growing, trying to consolidate above the psychological level of 100 dollars per barrel, and today the instrument managed to reach $104.

Investors are waiting for the publication of data from the US Department of Energy on the dynamics of oil inventories for the week of April 8. A similar report released yesterday by the American Petroleum Institute (API) reflected a sharp increase of 7.757M barrels after an increase of only 1.08M barrels over the past period, which put some pressure on the energy carrier's quotes and kept quotes from more active upward dynamics. Demand for "black gold" remains quite high as global economies recover from the coronavirus pandemic and against the backdrop of the developing crisis in Eastern Europe, which has forced many countries to look for alternative sources of supply and replenish their stocks. Also, investors are reacting positively to easing several sanitary restrictions in China, which adheres to a "zero tolerance" policy for the coronavirus.

Additional support for prices was provided by new statements by OPEC+ Secretary General Mohammed Barkindo, who stressed that the organization currently does not have the opportunity to replace Russian oil for the EU completely. The cartel also warned politicians against imposing a full embargo on supplies, noting that in this case, the market would lose 7M barrels of energy and warning of serious consequences for the global economy. Meanwhile, Russian Energy Minister Nikolai Shulginov predicted an increase in energy prices to the region of 80–150 dollars per barrel and the readiness of the authorities to sell fuel to friendly countries in any price range.

Recall that the foreign ministers of the EU countries on April 11 could not agree on a pan-European embargo on importing Russian oil and gas, while the US authorities imposed a ban on supplies last month, and the UK plans to do so by the end of the year.

oil-1.png


On the daily chart, Bollinger bands are moderately declining: the price range is narrowing, reflecting the ambiguous nature of trading in the short term. The MACD reversed upwards, forming a poor buy signal (the histogram is above the signal line). Stochastic shows a more active growth, accelerating after a sharp rise in the instrument yesterday.

Resistance levels: 106, 109, 112, 115.5 | Support levels: 102.8, 100, 96.5, 93.34

oil-2.png
 

oil link.png

Futures for WTI Crude Oil showed a downward trend during the Asian session, shedding 0.74% in value, and are currently trading in the 103.3 area. Investors open short positions on the instrument, reacting to the negative statistics on the excessive growth of stocks of raw materials in the US against the backdrop of a reduction in global consumption.

According to the US Energy Information Administration (EIA), energy stocks rose by 9.382M barrels last week, although analysts had forecast an increase in 863K barrels. The sharp move is partly due to a sudden decline in US refining capacity utilization, which has also caused gasoline and distillate inventories to shrink, and inventories are on the rise due to the release of "black gold" from the country's national strategic reserves. It is worth noting that initially, this statistic was ignored by traders, and on Wednesday, the asset strengthened, but now you can notice the delayed impact of the news and the decline in energy quotations.

However, the market situation remains tense due to possible disruptions to global supplies. Investors are watching the development of the military conflict in Ukraine and sanctions against the Russian economy, including possible restrictions on the transportation of hydrocarbons. The US and UK authorities have already abandoned Russian fuel, but the EU has so far refrained from an embargo on oil and gas imports. On Wednesday, the International Energy Agency warned that the market would miss about 3M barrels of oil per day since May due to prohibitive measures. Major global trading houses also plan to cut fuel purchases from Russian state-owned companies. In particular, one of the largest oil traders in the world, the Swiss-Dutch company Vitol Group, intends to stop trading in oil and oil products from Russia until the end of 2022.

A temporary decrease in demand for "black gold" in China due to anti-COVID restrictions smooths out problems with the supply of raw materials globally, but as demand recovers, quotes will grow. WTI Crude Oil above 100 dollars per barrel is a sound long-term target.

oil-1.png

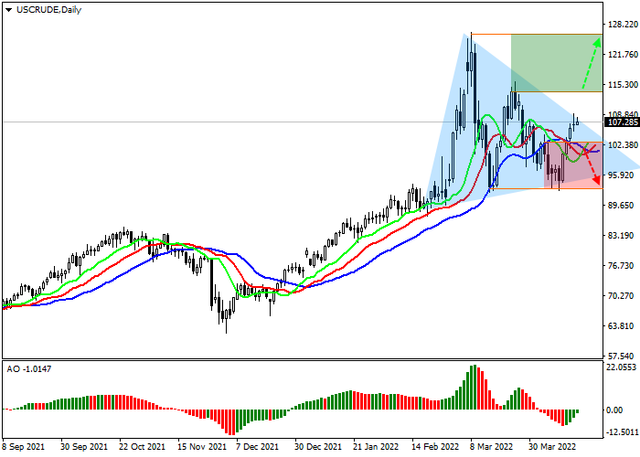
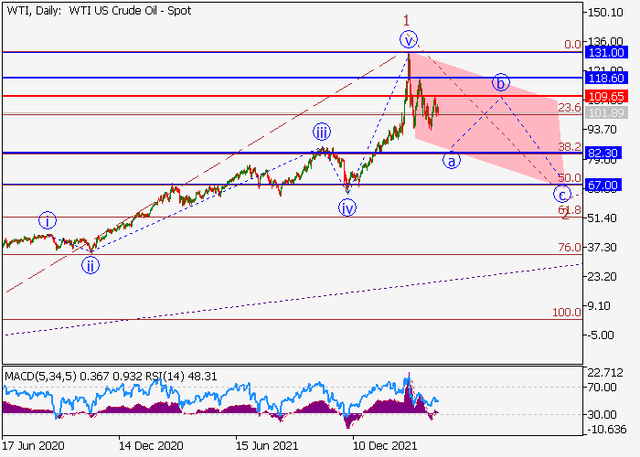
The long-term trend is upward, and its key support is 95. Last week, the "bears" unsuccessfully tried to reverse the trend, but as a result, the rate is approaching the resistance of 105.75, in case of a breakout of which, the next growth target will be 117.5.

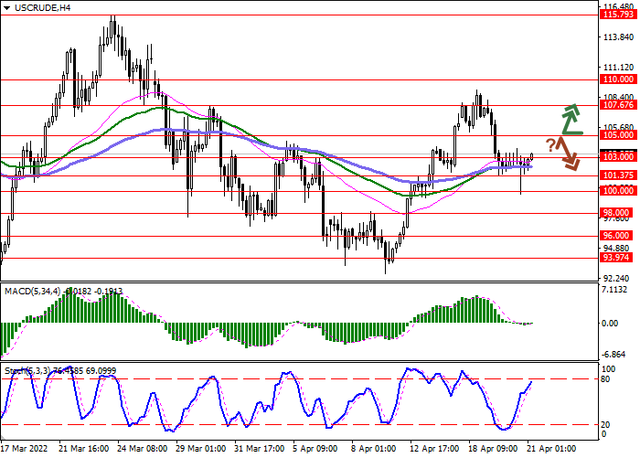
The medium-term trend is downwards. This week there was a price correction to the area of key resistance 103.71–102.76. As long as sellers hold this area, short positions can be considered with the target at the current week's low. If the key resistance is broken, the trend will reverse upwards, and zone 2 (113.21 - 112.26) will become the target for long positions.

Resistance levels: 105.75, 117.5 | Support levels: 95, 85

oil-2.png
 
oil link.png

Benchmark Brent Crude Oil continues its uptrend, trading just above 110 dollars per barrel.

The day before, Russian President Vladimir Putin, as part of a meeting with members of the government, instructed to submit a project for reorienting oil and gas supplies from Europe to Asia by June 1 of this year. For the market, this means that Russia does not intend to wait for a long time for a decision from the EU authorities on its readiness to continue cooperation and plans to consider Africa, Asia and Latin America as alternative markets. The head of the Russian state also instructed to accelerate the implementation of infrastructure projects, including pipelines, in order to redirect the supply of resources to new consumers. It is quite natural that after such statements, oil quotes again began to rise sharply.

In the meantime, the European Union plans to introduce a phased ban on Russian oil, so that Germany and other countries have time to find alternative suppliers and provide transport infrastructure for the delivery of raw materials. At the moment, the transition period is determined to be at least a month long. It is planned to submit the idea of a complete embargo on Russian fuel for consideration by all EU members after the second round of elections in France, which will be held on April 24. At the moment, Germany receives 34% of the total oil from the Russian Federation, and the European Union receives 25%.

Statistics on oil reserves from the Energy Information Administration of the US Department of Energy (EIA) and the American Petroleum Institute (API) this week were unexpected. According to the API, inventories rose by 7.757 million barrels, while the EIA reported an increase to 9.382 million barrels, the highest level since March 2021.

oil.png


On the global chart, the price continues to trade as part of the formation of the global Triangle pattern. Technical indicators are ready to give a new sell signal: the fast Alligator indicator EMAs crossed each other, and the histogram of the AO oscillator is forming ascending bars.

Support levels: 103.65, 95.17 | Resistance levels: 118.1, 131.2​
 
Crude Oil, "black gold" consolidated above $110

During the Asian session, Brent Crude Oil prices show ambiguous trading dynamics, consolidating near the level of 111.00 and renewing local highs of March 28.

The fears of a sharp reduction in market supply if the EU expands sanctions and imposes a full or partial embargo on Russian energy supplies as the military conflict over Ukraine escalates, support the prices. The approved fifth package of sanctions did not include a complete ban on importing "black gold" but outlined restrictions on the purchase of coal and some other raw materials. Nevertheless, Europe is already announcing new measures that may also affect oil flows. The US and the UK had previously announced a complete cessation of imports from Russia, which significantly impacted the dynamics of prices in commodity markets.

Also, there is an unstable situation in production at the El Feel field, located in the west of Libya. Amid protests against incumbent Prime Minister Abdul Hamid Dbeib, the state-owned National Oil Corp. announced the suspension of production, and two ports were forced to stop working, as a result of which the shipment of 1M barrels of crude oil was blocked and production of about 65K barrels per day was stopped.

At the beginning of the week, statistics from China moderately support the prices. Thus, the country's Q1 GDP rose by 1.3% and 4.8%, with preliminary estimates of 0.6% and 4.4%. At the same time, the pace of industrial production again slowed down from 7.5% to 5.0%, which was only 0.5% stronger than analysts' forecasts. China is one of the largest importers of oil and oil products, and the slowdown in its economy is extremely painful for the overall level of demand.
oil-1.png


Bollinger bands are trying to reverse upwards on the daily chart: the price range is expanding, barely keeping with the surge of the "bullish" sentiment. The MACD indicator grows, keeping a poor buy signal (the histogram is above the signal line). Stochastic remains in an upward direction but is close to its highs, reflecting that the instrument may become overbought in the ultra-short term.

Resistance levels: 112, 115.5, 118.32, 121 | Support levels: 109, 106, 102.8, 100​

oil-2.png
 
oil-forum-1.png


The price of North American Crude Oil is rising and is currently at $106.4.

The quotes of the asset returned to an uptrend after the increase in geopolitical tensions in the world and the introduction of economic sanctions against Russia, as well as against the backdrop of concerns about a reduction in the supply of "black gold". Last week, the International Energy Agency noted that approximately 3 million barrels of Russian oil per day may become unavailable from May due to sanctions or due to a voluntary decision by buyer countries. In addition, the pressure on the rate is exerted by the unstable situation in the west of Libya. The day before, the National Oil Corporation announced the suspension of production at the El Sharara field due to force majeure, which also threatens to increase the shortage of energy resources in the market, and after the closure of two ports, the shipment of 1 million barrels of crude oil was blocked and production of about 65 thousand barrels of oil per day was stopped.

The day before, Nabila Massrali, EU spokesperson for Foreign Affairs of the High Representative Josep Borrell, said that negotiations on a "nuclear deal" with Iran were suspended, since the parties still had unfinished questions, but she stressed that the agreements were in the final phase.

Investor demand for oil contracts remains stable. According to the US Commodity Futures Trading Commission (CFTC), the number of net speculative positions last week amounted to 304.8 thousand, which is slightly lower than 308.6 thousand a week earlier.

oil-1.png


After an attempt to overcome the resistance line, the price returned and remained inside the Triangle pattern; however, the prospect of overcoming the pattern's resistance line is still quite high. Technical indicators confirm this by issuing an updated signal to start buying: the range of EMA fluctuations on the Alligator indicator started expanding in the direction of growth, and the histogram of the AO oscillator is still trading in the sales zone without forming descending bars.

Support levels: 102.65, 93.14 | Resistance levels: 113.76, 126.38​
 
1.png


During the Asian session, WTI Crude Oil prices show multidirectional dynamics, holding close to $103 per barrel.

Yesterday, EU representatives reaffirmed their intention to phase out the import of Russian energy resources, which increased the likelihood of new prohibitive measures being included in the sixth sanctions package. According to the Secretary of State of the Ministry of Foreign Affairs of France, Clément Beaune, there are currently active discussions on the embargo with partners from the EU, the US, the UK, and Japan. Meanwhile, shipments of Russian oil by sea have already fallen by 25% (3.12M barrels per day). Also, traders evaluate the dynamics of industrial growth rates globally and, in particular, in China, one of the largest importers of petroleum products.

The instrument was supported yesterday by an unexpectedly sharp reduction in US oil reserves. Thus, according to the US Energy Information Administration (EIA), for the week of April 15, the indicator fell by 8.02M barrels after an increase of 9.382M barrels over the previous period. However, analysts expected the positive dynamics to continue at 2.417M barrels. At the same time, US strategic reserves decreased by 4.7M barrels, while production slightly accelerated to 11.9M barrels. Inventories of gasoline fell by 800K barrels, significantly lower than the expected value of 1.2M barrels.

oil-1.png


Bollinger bands are moving flat on the daily chart: the price range remains practically unchanged, reflecting the ambiguous nature of trading in the short term. The MACD indicator reversed upwards but keeps its previous sell signal (the histogram is below the signal line). Stochastic practically did not react to the appearance of ambiguous trading dynamics on Wednesday and still signals in favor of developing a downtrend in the nearest time intervals.

Resistance levels: 103, 105, 107.67, 110 | Support levels: 101.37, 100, 98, 96

oil-2.png
 
oil-1.png


On the daily chart, the upward wave C develops, within which the first wave 1 of (1) of C forms. Now, the third wave of the lower level iii of 1 has developed, and a local correction is ending to form as the fourth wave iv of 1, within which the wave (e) of iv is developing.

If the assumption is correct, after the end of the correction the price will grow to the levels of 139.64 - 155. In this scenario, critical stop loss level is 97.73.

oil.png
 
oil-1.png


On the daily chart, the upward wave C forms, within which the first wave 1 of (1) of C developed, and a downward correction forms as the second wave 2 of (1) of C. Now, the wave of the lower level a of 2 is developing, within which the correctional wave (iv) of a has ended, and the development of the fifth wave (v) of a has started.

If the assumption is correct, the price will fall to the levels of 82.3 - 67. In this scenario, critical stop loss level is 109.65.

oil.png
 
Back
Top