Cryptocurrencies Market Update ➡️ Solid ECN

btcusd.jpg

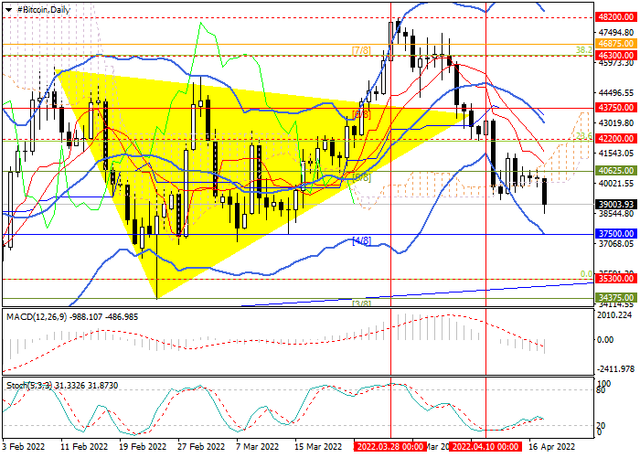
The BTCUSD pair was actively declining last week and by its end reached the 42200 mark (Fibo retracement 23.6%), which it is actively testing at the moment.

The general pressure on the cryptocurrency sector was exerted by the comments of US Fed officials, indicating an acceleration of monetary policy tightening. In particular, a sharper increase in rates is expected (by 0.50%) and a rapid reduction in the regulator's balance sheet (by 95B dollars monthly). These measures are aimed at reducing the rate of inflation and should support the exchange rate of the US currency. A number of experts, for example, Galaxy Digital founder Michael Novogratz, believe that the cryptocurrency sector will be under pressure for the entire period of active actions of the US Fed, at least until the end of the year, but as soon as the economic situation stabilizes, we can expect a new serious growth of digital assets.

An additional pressure factor was the ban on the provision of cryptocurrency services to individuals and legal entities from Russia and Belarus, including deposits and maintenance of cryptocurrency wallets. Earlier, experts believed that economic sanctions caused by the Ukrainian crisis would force large Russian capital to enter the crypto market, but there are fewer opportunities for this.

btc.png


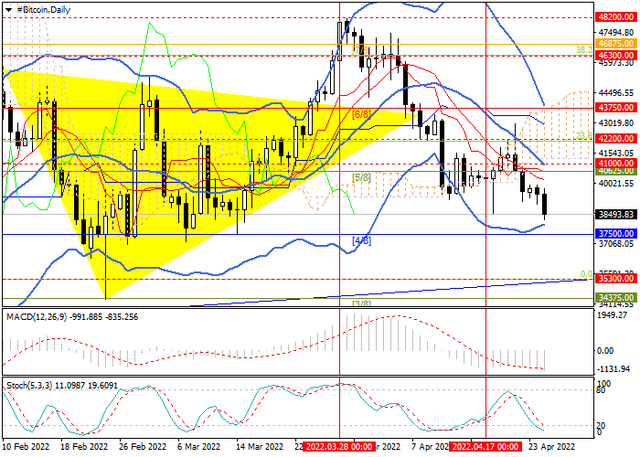
Technically, if the price is consolidated below the 42200 mark (Fibo retracement of 23.6%), the decline in the digital asset will be able to continue to the levels of 40000, 37500 (Murray [4/8]). The key for the "bulls" is the level of 43750 (Murray [6/8]). Its breakout will give the prospect of resuming growth in the area of 46300 (Fibo retracement of 38.2%), 48200 (the area of March highs). Technical indicators do not give a single signal: the Bollinger Bands are directed horizontally, the MACD histogram is preparing to move into the negative zone and form a sell signal, but the Stochastic can leave the oversold zone and form a buy signal.

Resistance levels: 43750, 46300, 48200 | Support levels: 42200, 40000, 37500​
 
eth-forum.png

The ETHUSD pair started the week lower as part of the general market trend and fell below 3000. Experts continue to link the general weakening of the market with investors' reaction to the upcoming serious tightening of the US Federal Reserve's monetary policy. Investors fear that the US economy will react with a slowdown to a sharp increase in interest rates or even start a recession. Yesterday, in this background, the yield of 10-year bonds reached a three-year high of around 2.78%, which led to a decrease in risky assets, including cryptocurrencies. According to several representatives of the cryptocurrency community, the digital asset sector will remain under pressure as long as the regulator continues to tighten monetary policy, which may take a long time. However, after stabilizing the economic situation, serious growth will resume.

As for Ethereum itself, the developers continue to prepare for the transition to the Proof-of-Stake (PoS) algorithm and the launch of the Ethereum 2.0 network. On Monday, the developers tested the merger of the two networks, the so-called "shadow fork," which was successful but had several minor problems. The next stage of the test is scheduled for April 22. After it, the developers will probably be able to determine the launch date of the Ethereum 2.0 network more accurately, as one of the leading experts, Tim Beiko, hinted at. Ethereum founder Vitalik Buterin previously assumed that the transition to the new system would take place before July of this year.

eth.png


Technically the price is trading around 2950 (Murrey [6/8], Fibonacci retracement 23.6%). Consolidation below this level allows a decline to 2656.75 (Murrey [1/8]) and 2500.00 (Murrey [0/8]). The key "bullish" level is 3281.25 (Murrey [5/8], Fibonacci retracement 38.2%, the middle line of Bollinger bands). Its breakdown allows growth to 3595 (Murrey [7/8], Fibonacci correction 50.0%), 3900.00 (Murrey [+1/8], Fibonacci correction 61.8%). The indicators do not give a single signal: Bollinger bands and Stochastic are horizontal, and the MACD histogram is preparing to move into the negative zone and form a sell signal.

Resistance levels: 3281.25, 3595, 3900 | Support levels: 2950, 2656.75, 2500.​
 
xrp-forum-link.png

Ripple continues to trade within a wide descending channel. At the end of last month, quotes tested its upper limit around 0.8930, after which they began to decline, which continues to this day.

The day before, the price tested the level of 0.6836 (Murray [2/8]), fixing below which will give the prospect of further decline to the levels of 0.6348 (Murray [1/8]), 0.5859 (Murray [0/8]) and 0.5371 (Murray [-1/8]). The key level for the "bulls" is seen at 0.7810 (Murray [4/8], Fibonacci retracement 23.6%). If this level is broken out, as well as the center line of Bollinger Bands, the quotes may try to leave the descending channel and return to 0.8930 (Fibonacci retracement 38.2%).

xrp.png


Technical indicators don't provide a clear signal: Bollinger Bands are reversing downwards, MACD is increasing in the negative zone, and Stochastic has entered the oversold zone, which does not exclude the corrective growth. In general, a continuation of the decline in the long-term downtrend in the near future seems more likely.

Resistance levels: 0.7810, 0.8930, 0.9277 | Support levels: 0.6836, 0.6348, 0.5859, 0.5371.​
 

ada link.png

This week, the ADAUSD pair declined as part of the general market trend and dropped to the 0.913 area. The cryptocurrency sector remains under pressure in anticipation of the US Federal Reserve's sharp tightening of monetary policy amid strong inflation. According to the latest March data, this figure increased to 8.5%, which increases the likelihood of a rate hike at the next meeting of the US regulator immediately by 0.50%.

Yesterday, the asset managed to win back part of the losses after the comments of the founder of Cardano, Charles Hoskinson. Speaking on his YouTube channel, he announced the imminent Vasil hardfock, which should take place in June and lead to a significant increase in network performance due to the launch of the data pipeline function. The solution will optimize the network for the needs of the growing volume of applications in the DeFi market.

ada.png


Technically, the crypto asset price continues to trade within a long-term downtrend. The key for the "bears" is 0.9277 (Murrey [3/8]), fixing below which will allow quotes to rush to 0.8300 (Murrey [1/8]), 0.7812 (Murrey [0/8]). The continuation of the downtrend is signaled by the downward reversal of Bollinger bands and the transition of the MACD histogram into the negative zone. The exit of Stochastic from the oversold zone may mean a correction to the area of 1.1000 (the middle line of Bollinger bands), but this is unlikely to lead to a reversal of the downtrend.

Resistance levels: 0.9765, 1.1 | Support levels: 0.9277, 0.83, 0.7812
 
1.png


This week, the BTCUSD pair is declining within the framework of a four-week downtrend. The quotes of "digital gold" have dropped to the area of 39000 and are likely to continue negative dynamics in the near future. Pressure on the asset is exerted by two main factors: the expectation of further tightening of monetary policy by the US Fed and the traditional profit-taking by investors during the holidays.

Experts believe that the officials of the American regulator will continue to sharply increase the interest rate (by 0.50% or more) in order to prevent the growth of inflation. These measures will undoubtedly contribute to strengthening the position of the USD, but will put pressure on alternative assets, including cryptocurrencies, which may persist until the situation in the US economy stabilizes.

It should also be noted that over the weekend, short-term support for prices was provided by the nomination by US President Joe Biden of Michael Barr for the post of chief responsible for large banks at the US Fed. Since 2015, Barr has worked as a consultant for Ripple Labs, so he is well acquainted with the crypto industry. The appearance of another supporter of cryptocurrencies among the officials of the American regulator may contribute to the adoption of digital assets by American government structures. However, long-term pressure factors are currently seen as strong enough to ensure further price declines.

btcusd.png


Technically, the price continues to be within a wide ascending channel and is now tending to its lower limit. The nearest reduction targets may be 37500 (Murray [4/8]) and 35300 (Fibo retracement of 0.0%). The key for the "bulls" is 42200 (Fibo retracement of 23.6%), the breakout of which will allow the instrument to strengthen up to the levels of 43750 (Murray [6/8]), 46300 (Fibo retracement of 38.2%). Technical indicators signal the continuation of the downward trend: the Bollinger Bands and the Stochastic are reversing downwards, the MACD histogram is increasing in the negative zone.

Resistance levels: 42200, 43750, 46300 | Support levels: 37500, 35300​
 
Last edited:
eth-1-1.png


Last week, the ETH/USD pair entered the main sideways range of 3125–2950 (Murray [4/8], Fibonacci retracement 23.6%), where it is currently trading. The breakdown of its lower border will give the prospect of further decline to the levels of 2656.25 (Murray [1/8]) and 2500 (Murray [0/8]). The key “bullish” zone is 3220–3281.25 (the middle line of the Bollinger Bands, Fibonacci retracement 38.2%), consolidation of the price above which will allow the cryptocurrency to continue its upward dynamics up to the level of 3590 (Fibonacci retracement 50.0%, Murray [7/ 8]), however, a resumption of decline remains most likely soon.

Technical indicators confirm the continuation of the downward trend: Bollinger bands are turning downwards, the MACD histogram is increasing in the negative zone, and the Stochastic reverses upwards, which may mean the development of an upward correction, but its potential is seen as limited.

eth.png


Resistance levels: 3220, 3281.25, 3437.5, 3590 | Support levels: 2950, 2656.25, 2500​
 
ada-1.png


The ADAUSD pair continues to move within the long-term downtrend.

Last week, the price corrected down and entered the main range of 0.9765–0.9277 (Murrey [4/8]–[3/8]), and consolidation below its lower border will give the prospect of further downward dynamics of quotations to 0.8300 (Murrey [1/8 ]), 0.7800 (Murrey [0/8]). The key "bullish" level is 1.0253 (Murrey [5/8], the middle line of Bollinger bands). If it breaks up, the token may rise to 1.1230 (Murrey [7/8]) and 1.1718 (Murrey [8/8]).

ada.png


In general, the downward trend in the ADAUSD pair continues, which confirms the downward reversal of Bollinger bands and the increase in the MACD histogram in the negative zone. At the same time, the upward reversal of Stochastic does not rule out an upward correction, but its potential looks limited.

Resistance levels: 1.0253, 1.1230, 1.1718 | Support levels: 0.9277, 0.8300, 0.7812​
 
crypto-1.png


This week, the cryptocurrency market made a moderate attempt to grow, but it was not crowned with significant success. BTC is currently trading around 40600.00 (+0.8%), ETH is at 3000.00 (-1.5%), USDT is around 1.0002 (+0.01%), BNB is moving around 410.00 (+0.8%), while USDC is in the 0.9998 area (+0.01%). By the end of the week, the total market capitalization decreased to 1.885T dollars, and the share of BTC was 41.06%.

The cryptocurrency sector remains under pressure due to the expected tightening of the monetary policy of the US Federal Reserve. A sharp reduction in the regulator's balance sheet and an increase in rates should support the position of the US currency against alternative assets, including digital ones. This prospect has already led to institutional investors' partial withdrawal of capital from crypto assets. According to CoinShares, an active withdrawal of funds has been going on for the second week, and since the beginning of this month, capital outflow from BTC has amounted to $196M. A similar picture is observed in other leading cryptocurrencies – ETH, ADA, and SOL. The withdrawal of funds by major players will likely continue soon, which will put pressure on the entire sector. Despite long-term factors, leading digital assets have stabilized this week, helped by the nomination of Michael Barr, who previously served on the advisory board of Ripple Labs Inc., to the post of chief officer for large banks at the US Federal Reserve. The official was a member of it from 2015 to 2017 and dealt with the issues of reducing the cost of money transfers for citizens of developing countries. Barr's confirmation is unlikely to help Ripple in its lawsuit against the Securities and Exchange Commission (SEC), but it could speed up the adoption of cryptocurrencies by the US government.

As for XRP, the token became an underdog among the sector leaders during the week, as it came under pressure from court news. The court refused to grant Ripple's motions to exclude from the case the report of Dr. Albert Metz, proving that Ripple Lab Inc. could influence the price of XRP tokens through news and public announcements. This decision significantly weakens the company's position in the dispute with the regulator. Among other cryptocurrency news, it is worth noting a serious increase in the number of validators in the Ethereum Beacon Chain test network. Since the beginning of March, their number has increased by 50K and now stands at about 350K. At the same time, 11.6M ETH has already been blocked in the network itself. The dynamics are explained by the expectation of the imminent final transition of Ethereum from the Proof-of-Work (PoW) algorithm to the Proof-of-Stake (PoS) algorithm. Cryptocurrency exchange Coinbase has begun testing a platform for trading NFT tokens on the Ethereum blockchain. Soon, it is planned to add support for NFT on other blockchains. Clients will be able to trade and store NFTs and pay for them with a credit card. The management of the FTX cryptocurrency trading platform and The Goldman Sachs Group Inc. held talks on close cooperation. Goldman Sachs could provide financial support to FTX if the latter goes public and provide traditional banking services to the exchange's clients. Experts note that in this way The Goldman Sachs Group Inc. is trying to strengthen its position in the cryptocurrency market.

Next week, quotes of most digital assets may continue to decline or consolidate.​
 
btc-2.png


Last week, the BTCUSD pair had an ambiguous trend: the quotes rose to the 42950 area but then lost all the gains and fell to 38500, where they are now being traded.

The cryptocurrency sector is under pressure from a likely sharp change in monetary policy parameters by the US Federal Reserve at its next meeting in May. Last Thursday, the head of the US regulator, Jerome Powell, announced the need to increase the interest rate by 50 basis points to slow down the growth of record inflation. The “hawkish” policy of the authorities will strengthen the dollar's position relative to other assets, including cryptocurrencies. Against this background, there is an outflow of funds from major players in the market. ETH, ADA, and SOL suffered the most, but BTC is the leader in capital loss. According to the analytical company CoinShares, the active withdrawal of funds from the first cryptocurrency has been going on for the second week, and since the beginning of this month, “digital gold” has lost 196M dollars of investor funds.

btc-1.png


The price is decreasing, approaching 37500 (Murrey [4/8]), repeatedly but unsuccessfully tested in late February and early March. Consolidation below it allows further fall to 35300 (Murrey [3/8], the lower border of the ascending channel). The key "bullish" level is 41000 (the middle line of Bollinger bands), which breakout allows growth to 43750 (Murrey [6/8]) and 46300 (Fibonacci correction 38.2%).

Technical indicators signal the continuation of the downward trend: Bollinger bands and Stochastic reverse downwards, while the MACD histogram increases in the negative zone.

Resistance levels: 41000, 43750, 46300 | Support levels: 37500, 35300.​
 
usdjpy-2.png


The US dollar is developing flat trading dynamics in tandem with the yen during the Asian session, consolidating near 128. The development of the uptrend stopped last week, when USDJPY made new record highs, and the market plunged into a correction.

Meanwhile, demand for the US currency is increasing in anticipation of a more aggressive approach to tightening monetary policy parameters by the US Federal Reserve, pushing buyers to open new deals, while the Bank of Japan is only cautious about the risks of rising inflation in the country. The latter, however, does not frighten Japanese investors at all, who are accustomed to the deflationary characteristics of the national economy. The Bank of Japan is likely to keep its rate unchanged at -0.10% at its meeting on Thursday and refrain from major adjustments in its forecasts for further actions, as rising commodity prices force it to focus on maintaining the economic recovery after the coronavirus pandemic. Thus, in a broader sense, the Japanese yen is currently experiencing a "bullish" pullback after a consistent decline due to the regulator's ultra-loose monetary policy.

Macroeconomic statistics from Japan, released the day before, turned out to be restrainedly optimistic: the Coincident Index in February rose from 96.3 to 96.8 points, which turned out to be better than the negative forecasts of analysts for a decline to 95.5 points. The Leading Economic Index for the same period fell from 101.2 to 100.0 points, while the market expected 100.9 points. The Unemployment Rate in the country in March also corrected down from 2.7% to 2.6%.

usdjpy-4.png


Bollinger Bands on the daily chart show a steady increase. The price range is narrowing, reflecting the emergence of ambiguous dynamics of trading in the short term. MACD is going down having formed a new sell signal (located below the signal line). Stochastic maintains a confident downtrend, being approximately in the center of its area.

Technical indicators do not contradict the development of the correctional decline in the short and/or ultra-short term.

Resistance levels: 128.62, 129.39, 130, 131 | Support levels: 127.5, 127, 126.3, 125.6

usdjpy-1.png
 
Back
Top