Daily Market Analysis By FXOpen

FXOpen Trader

Private, 1st Class
Messages
31
Dear Forum Members!

Here you can find Daily Market Analysis of Forex, Cryptocurrency, Indexes, Metals, Oil and others.

We hope that this information will be helpful for your trading.

Best Regards
FXOpen Team
 
AUD/USD and NZD/USD Eye Key Upside Break
aud.jpg


AUD/USD is attempting a recovery wave above the 0.6750 resistance. NZD/USD is also eyeing a key upside break above the 0.6140 resistance.

Important Takeaways for AUD/USD and NZD/USD

  • The Aussie Dollar started a fresh decline below the 0.6800 support zone against the US Dollar.
  • There is a key bearish trend line forming with resistance near 0.6750 on the hourly chart of AUD/USD.
  • NZD/USD also started a major decline from the 0.6200 resistance zone.
  • There is a major bearish trend line forming with resistance near 0.6135 on the hourly chart of NZD/USD.

AUD/USD Technical Analysis

The Aussie Dollar attempted a fresh increase above the 0.6800 and 0.6810 levels against the US Dollar. However, the AUD/USD pair failed to continue higher above 0.6800 and started another decline.

There was a move below the 0.6750 and 0.6720 support levels. There was a close below the 0.6750 level and the 50 hourly simple moving average. The pair traded as low as 0.6681 and is currently correcting losses.

AUD/USD Hourly Chart
audx.jpg


There was a move above the 0.6725 resistance level. The pair climbed above the 50% Fib retracement level of the downward move from the 0.6803 swing high to 0.6681 low.

On the upside, the AUD/USD pair is facing resistance near the 0.6750 level. It is near the 61.8% Fib retracement level of the downward move from the 0.6803 swing high to 0.6681 low. There is also a key bearish trend line forming with resistance near 0.6750 on the hourly chart of AUD/USD.

The next major resistance is near the 0.6800 level. A close above the 0.6800 level could start a steady increase in the near term. The next major resistance could be 0.6880.

On the downside, an initial support is near the 0.6725 level. The next support could be the 0.6700 level. The main support is near the 0.6680 level. If there is a downside break below the 0.6680 support, the pair could extend its decline towards the 0.6650 level.

Read Full on FXOpen Company Blog...
 
GBP/USD Eyes Recovery While USD/CAD Is Sliding
gbp.jpg


GBP/USD could gain pace if it clears the 1.1900 resistance zone. USD/CAD is sliding and could extend losses below the 1.3000 level.

Important Takeaways for GBP/USD and USD/CAD

  • The British Pound is attempting an upside correction from the 1.1800 support zone.
  • There is a key bearish trend line forming with resistance near 1.1900 on the hourly chart of GBP/USD.
  • USD/CAD started a fresh decline from the 1.3220 resistance zone.
  • There was a break below a connecting bullish trend line with support near 1.3070 on the hourly chart.

GBP/USD Technical Analysis

After facing sellers near 1.2055, the British Pound started a fresh decline against the US Dollar. GBP/USD declined heavily below the 1.2000 support zone.

There was a move below the 1.1900 support zone and the 50 hourly simple moving average. The pair traded as low as 1.1761 and is currently correcting higher. There was a clear move above the 1.1850 resistance zone.

GBP/USD Hourly Chart
gbpx.jpg


The pair climbed above the 50% Fib retracement level of the downward move from the 1.1967 swing high to 1.1761 low. An immediate resistance is near the 1.1900 level.

There is also a key bearish trend line forming with resistance near 1.1900 on the hourly chart of GBP/USD. The next key resistance is near the 1.1920 level. It is near the 76.4% Fib retracement level of the downward move from the 1.1967 swing high to 1.1761 low.

If there is an upside break above the 1.1920 zone, the pair could rise towards 1.2000. The next key resistance could be 1.2050, above which the pair could gain strength.

On the downside, an initial support is near the 1.1860 area. The first major support is near the 1.1840 level. If there is a break below 1.1840, the pair could extend its decline. The next key support is near the 1.1760 level. Any more losses might call for a test of the 1.1700 support.

Read Full on FXOpen Company Blog...
 
Gold begins to move upwards, but 1-year low still lingering
gold.jpg


Gold has been struggling to maintain the values that it reached during the spring of 2022 over recent months, and by the middle of July it had reached a 1-year low.

Whereas the prices in May had reached $1,980 per ounce, Gold had dropped to $1,700 by July 14.

Today, however, a slight upturn in the value of Gold has begun to make itself evident, and this morning during the Asian trading session, Gold had risen to $1,720 per ounce.

Admittedly, this is still a low value compared to any time during the past twelve months, but the factors which are now beginning to influence the value of gold away from its two-month long decline to the low value reached at the end of last week.

This morning, Gold rose to $1,717 per ounce, which some are attributing to a weakness in the US Dollar. Ordinarily commodities and stores of value such as Gold would not be so influenced by the currency market, but the US Dollar's value is intrinsic to the value of Gold because Gold is valued in US Dollars and bought and settled in US Dollars.

Another US Dollar-related factor which could be contributing to the slight rise in the value of Gold is that the US Federal Reserve Bank intervened to cool down market expectations of a 1.0% rate hike on Friday, which in turn helped the Gold Price to defend the yearly low that it reached on Thursday.

Talk of interest rate increases in the United States are enough to blunt enthusiasm, especially when considering that there have already been a few this year, and that The Index of Consumer Expectations declined to its lowest level since May 1980 at 47.3. These very low figures were released alongside a 0.20% contraction by the US Industrial Production for June to favor Gold buyers or traders of the US Dollar against Gold.

There are talks of a 1% interest rate rise at the next Federal Reserve meeting, and that is a clear indicator that inflation is still a major concern for policymakers in the United States, just as it is in Europe.

The difference is that commodity prices are affected by these economic decisions which involve the US Dollar.

FXOpen Blog
 
British Pound begins to rise, but still faces challenges
gbp.jpg


The British Pound has been subjected to an onslaught of challenges recently.

These challenges have not been short term ones, either.

Over the past two years, there have been factors which have had an overreaching effect on the economic circumstances of most Western nations, including government-enforced lockdowns, which were the first in a series of policies which have had a domino effect.

In the United Kingdom, adherence to lockdowns was enforced in a different way to those in many other nations. Instead of policing the movements of people, the British government introduced a furlough scheme which effectively paid people to stay at home.

This has cost the country's coffers a fortune, and along with a £400 billion borrowing program led by Chancellor of the Exchequer (finance minister) Rishi Sunak, it all has to be paid back by a nation whose productivity was adversely affected for over two years.

The inflation and cost of living crisis that ensued has added further woes to the economic situation and the Pound has languished.

Now, however, it has begun to rise again as the forecast for the Consumer Price Index (CPI) will be released today and it is anticipated to be an almost unbelievable 9.1% year-on-year according to a Bloomberg survey. The Bank of England will meet 4th August to decide on how much to hike rates.

This is certainly not good reading for conservative investors, and really shows the extent of the inflation problem.

The anomaly is the US Dollar's strength. The US Dollar remains very strong against all majors, the British Pound being no exception, especially given that the United States is in equally dire straits in terms of inflation which is at a 40 year high.

Productivity in the United States is quite good, however, whereas in the United Kingdom there are still many large organizations which are still not operating at anything like full capacity.

Perhaps another important factor to consider is that the British Prime Minister resigned amid a myriad of chaotic circumstances at the time when the economy is teetering, with many fingers aiming the blame directly at the incumbent government for the state of the nation's finances.

Therefore, the GBP/USD remains in a downtrend like many other markets as overall US Dollar strength continues.

FXOpen Blog
 
BTCUSD and XRPUSD Technical Analysis – 19th JULY 2022
btc.jpg


BTCUSD: Triple Bottom Pattern Above $19640

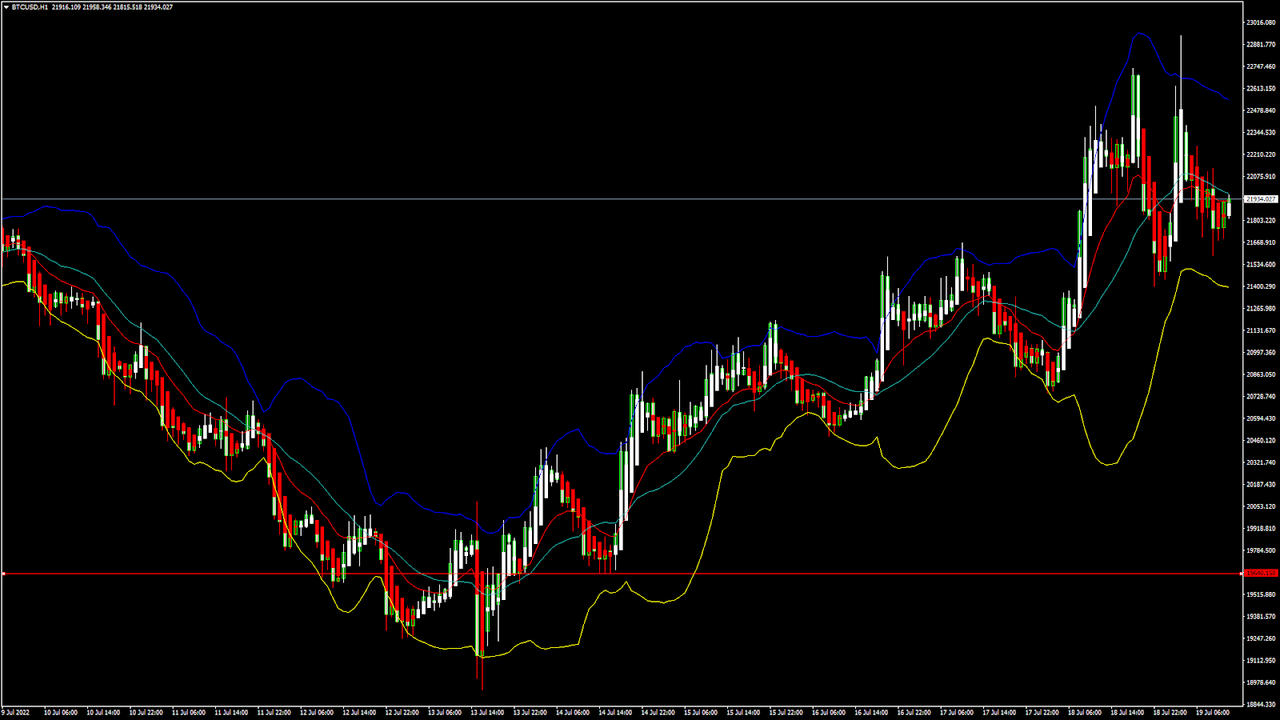
Bitcoin was unable to sustain its bearish momentum and after touching a low of 18991 on 13th July started to correct upwards breaching the $22000 handle on 18th July.

We can see a continued appreciation in the price of bitcoin as global investor sentiments have improved leading to buying action seen in the markets at levels above $19000.

The price of bitcoin is poised to clear the resistance zone located at $23000 after which we will see a continuous upsurge in the levels of BTCUSD.

We can clearly see a triple-bottom pattern above the $19640 handle which is a bullish reversal pattern because it signifies the end of a downtrend and a shift towards an uptrend.

Bitcoin touched an intraday high of 22937 in the Asian trading session and an intraday low of 21588 in the European trading session today.

Both the STOCH and Williams percent range are indicating overbought levels which means that in the immediate short term, a decline in the prices is expected.

The relative strength index is at 50 indicating a neutral demand for bitcoin at the current market levels.

Bitcoin is now moving above its 100 hourly simple moving average and 200 hourly simple moving averages.

Some of the major technical indicators are giving a buy signal, which means that in the immediate short term, we are expecting targets of 22000 and 23000.

The average true range is indicating less market volatility with a bullish momentum.

  • Bitcoin: bullish reversal seen above $19640
  • The Williams percent range is indicating an overbought level
  • The price is now trading just above its pivot level of $21805
  • Most of the moving averages are giving a buy market signal

Bitcoin: Bullish Reversal Seen Above $19640
btx.png


The price of Bitcoin continues to appreciate above the $21000 handle, and we are now testing the important resistance level of $23000 in the European trading session.

The global sentiments continue to improve leading to broad-based buying by the medium-term investors.

We can see the formation of a rising trend channel and are facing the immediate targets of $22000 and $22700.

Bitcoin’s bearish bias was invalidated above $19000, and we can see a correction wave that is stronger than the previous one.

We can see the formation of a bullish ABCD pattern in the hourly time frame which indicates that we are heading towards the $25000 level.

The immediate short-term outlook for bitcoin is bullish; the medium-term outlook has turned neutral; and the long-term outlook remains neutral under present market conditions.

Bitcoin’s support zone is located at $20500, and the prices continue to remain above this level for the continuation of the bullish phase of the markets.

The price of BTCUSD is now facing its classic resistance level of 21868 and Fibonacci resistance level of 21963 after which the path towards 22000 will get cleared.

In the last 24hrs, BTCUSD has declined by 1.73% by 385$ and has a 24hr trading volume of USD 45.154 billion. We can see an increase of 39.50% in the trading volume as compared to yesterday, which is due to the buying seen by the medium-term investors.

The Week Ahead

The price of bitcoin is moving in a bullish momentum, and the immediate targets are $22500 and $23500.

The daily RSI is printing at 53 which means that the medium range demand continues to remain neutral.

We can see the continuation of the recovery mode in bitcoin with the prices touching the $23000 and $24000 levels next week.

The price of BTCUSD will need to remain above the important support level of $20000 this week.

The weekly outlook is projected at $23500 with a consolidation zone of $22500.

Technical Indicators:

The average directional change (14 days): at 25.10 indicating a buy

The ultimate oscillator: at 59.03 indicating a buy

The rate of price change: at 8.61 indicating a buy

The commodity channel index(14days): at 136 indicating a buy

Read Full on FXOpen Company Blog...
 
EUR/USD Starts Recovery While USD/CHF Dips Below Support
eur.jpg


EUR/USD started a recovery wave above the 1.0200 level. USD/CHF is declining and broke a key support near the 0.9750 zone.

Important Takeaways for EUR/USD and USD/CHF

  • The Euro started a decent recovery wave above the 1.0150 zone against the US Dollar.
  • There is a key bullish trend line forming with support near 1.0225 on the hourly chart of EUR/USD.
  • USD/CHF started a fresh decline after it failed to clear the 0.9880 resistance zone.
  • There is a major bearish trend line forming with resistance near 0.9720 on the hourly chart.

EUR/USD Technical Analysis

This past week, the Euro gained pace below the 1.0100 support against the US Dollar. The EUR/USD pair even spiked below the parity level and traded as low as 0.9952 on FXOpen.

Recently, there was a recovery wave above the 1.0000 and 1.0100 resistance levels. The pair climbed above the 1.0150 level and the 50 hourly simple moving average. The pair traded as high as 1.0268 and is currently showing positive signs.

EUR/USD Hourly Chart
eurx.jpg


There was a minor drop and a test of the 23.6% Fib retracement level of the upward move from the 1.0119 swing low to 1.0268 high.

An immediate resistance is near the 1.0255 level. The next major resistance is near the 1.0270 level. A clear move above the 1.0270 resistance zone could set the pace for a larger increase towards 1.0350. The next major resistance is near the 1.0450 zone.

On the downside, an immediate support is near the 1.0230 level. There is also a key bullish trend line forming with support near 1.0225 on the hourly chart of EUR/USD.

The next major support is near the 1.0200 level. It is near the 50% Fib retracement level of the upward move from the 1.0119 swing low to 1.0268 high. A downside break below the 1.0200 support could start another decline.

Read Full on FXOpen Company Blog...
 
Big Tech stock languishes, whilst UK inflation rampages
bts.jpg


This week started off with very big moves among the Big Tech stocks on North America's markets, a dynamic which has continued throughout the week so far.

On Monday, Apple stock fell more than 2% in its worst trading session in almost three weeks after Bloomberg revealed the company’s plans to slow hiring and spending to cope with a potential economic downturn. Yesterday, Meta (previously Facebook) was in the news, with its CEO Mark Zuckerberg stating quite ruthlessly that the company will simply tell all of its employees that it 'does not need' to simply go home.

There are now some commentators who consider that the big tech stocks listed on New York's prominent exchanges have even further to fall.

Apple stock has decreased in value by a remarkable 17% during the course of 2022, and other large software giants and internet stalwarts such as Microsoft and Google (Alphabet) having fallen in value over a sustained period of time.

A point of interest with this otherwise gloomy outlook is that the declining nature of Apple stock is having a bearing on the total value of all big tech stocks.

The spread between the prospective earnings multiples of the S&P 500 Information Technology Sector and the benchmark S&P 500 started this year at the highest it had been since 2004, which is encouraging, and shows that perhaps a few of the giants which have been struggling to keep the value of their shares up have affected the entire outlook for big tech when in reality there are firms doing well.

Overall, however, the differential between the downturn in big tech stock values in New York and other stocks on prominent exchanges elsewhere is interesting.

London's FTSE 100, largely consisting of less tech-focused stocks and more on long-established, age-old blue chip companies in mining, manufacturing, pharmaceuticals, finance, consumer retail and engineering industries, has been stable despite the United Kingdom's economic situation having reached a milestone inflation level which is now at its highest in 40 years.

It is apparent that many investors in the United Kingdom are looking for inflation-busting opportunities, and are taking a cautious approach, especially given that many London listed stocks are valued in Pounds and Pence, and at a time during which the governmental changes are creating uncertainty.

FXOpen Blog
 
ETHUSD and LTCUSD Technical Analysis – 21st JULY, 2022
eth.jpg


ETHUSD: Hanging Man Pattern Below $1627

Ethereum was unable to sustain its bullish momentum and after touching a high of 1627 on 19th July started to decline against the US dollar coming down below the $1500 handle in the European trading session today.

We can see that ETH is losing ground against the US dollar and no major uptrend formation was seen.

The prices touched an intraday low of $1466 and an intraday high of $1565 in the Asian trading session today.

We can clearly see a hanging man pattern below the $1627 handle which is a bearish pattern and signifies the end of a bullish phase and the start of a bearish phase in the markets.

ETH is now trading just above its pivot levels of 1485 and moving into a mildly bearish channel. The price of ETHUSD is now testing its classic support level of 1450 and Fibonacci support level of 1476 after which the path towards 1300 will get cleared.

The relative strength index is at 39 indicating a weak market and the continuation of the downtrend in the markets.

We can see the progression of a bearish trendline formation from $1627 to $1488 which indicates that we are heading towards $1436.

Both the commodity channel index and Williams percent range are indicating a neutral market.

All of the technical indicators are giving a strong sell market signal.

Most of the moving averages are giving a sell signal, and we are now looking at the levels of $1400 to $1350 in the short-term range.

ETH is now trading above both its 100 hourly simple and exponential moving averages.

  • Ether: bearish reversal seen below the $1627 mark
  • Short-term range appears to be mildly bearish
  • ETH continues to remain above $1400
  • The average true range is indicating less market volatility

Ether: Bearish Reversal Seen Below $1627
etx.png


ETHUSD is now moving into a mildly bearish channel with the prices trading below the $1500 handle in the European trading session today.

We have also detected the formation of MA20 and MA50 crossover patterns located at 1529 and 1545 in the hourly time frame indicating that the price is likely to descend below.

We can see that the prices of Ethereum are slowly preparing for moving into a consolidation channel above the $1400 handle.

We can also see the formation of three black crows patterns in the 15-minute time frame indicating the bearish nature of the markets.

In the 2-hour time frame, the super trend indicator is giving bearish reversal signals.

The key support levels to watch are $1385 and $1335, and the prices of ETHUSD need to remain above these levels for any potential bullish reversal in the markets.

ETH has decreased by 2.79% with a price change of 42$ in the past 24hrs and has a trading volume of 23.086 billion USD.

We can see an increase of 2.31% in the total trading volume in the last 24 hrs. which appears to be normal.

The Week Ahead

We can see that ETH failed to clear the resistance zone located at $1650, and with the continued bearish reversal, we are now heading towards the $1400 level.

The prices of Ethereum are preparing to enter into a consolidation phase below the $1500 level and we can see some range-bounded movements between the $1400 and $1500 levels this week.

The immediate short-term outlook for Ether has turned mildly bearish; the medium-term outlook has turned neutral; and the long-term outlook for Ether is neutral in present market conditions.

The price of ETHUSD will need to remain above the important support level of $1400 this week.

The weekly outlook is projected at $1550 with a consolidation zone of $1400.

Technical Indicators:

STOCH (9,6): at 22.50 indicating a sell

The moving averages convergence divergence (12,26): at -17.75 indicating a sell

The rate of price change: at -3.93 indicating a sell

The ultimate oscillator: at 46.50 indicating a sell

Read Full on FXOpen Company Blog...
 
Gold Price and Crude Oil Price Aim Fresh Increase
gold.jpg


Gold price started a major decline below the $1,725 support zone. Crude oil price is attempting a fresh increase from the $88.80 support zone.

Important Takeaways for Gold and Oil

  • Gold price struggled above $1,740 and declined against the US Dollar.
  • Recently, there was a break above a key bearish trend line with resistance near $1,705 on the hourly chart of gold.
  • Crude oil price started a downside correction from the $100 and $101 resistance levels.
  • There was a break below a major bullish trend line with support near $98.95 on the hourly chart of XTI/USD.

Gold Price Technical Analysis

Gold price struggled to gain pace above the $1,750 resistance zone against the US Dollar. The price started a fresh decline and traded below the $1,725 pivot level.

There was a clear move below the $1,712 support zone and the 50 hourly simple moving average. The price even traded below the $1,700 level and formed a low near $1,680 on FXOpen. It is now correcting losses above the $1,695 level.

Gold Price Hourly Chart
goldx.jpg


There was a break above a key bearish trend line with resistance near $1,705 on the hourly chart of gold. The price even climbed above the $1,712 level but struggled to clear $1,720.

A high is formed near $1,720 and the price is now consolidating gains. On the downside, an initial support is near the $1,710 level. It is near the 23.6% Fib retracement level of the upward move from the $1,680 swing low to $1,720 high.

The next major support is near the $1,700 level or the 50% Fib retracement level of the upward move from the $1,680 swing low to $1,720 high, below which there is a risk of a larger decline. In the stated case, the price could decline sharply towards the $1,680 support zone.

On the upside, the price is facing resistance near the $1,720 level. A clear upside break above the $1,720 resistance could send the price towards $1,735. The main resistance is now forming near the $1,750 level. A close above the $1,750 level could open the doors for a steady increase towards $1,780.

Read Full on FXOpen Company Blog...
 
Back
Top