Daily Market Analysis By FXOpen

Crypto winter giving way to Crypto spring? Bitcoin suddenly wakes up
btc.jpg


The long, drawn-out period which has lasted several months in which Bitcoin, previously as volatile as a piece of magnesium ribbon over a naked flame, has been utterly stagnant.

The days of $60,000 values and cliffhanger tweets by influencers suddenly crashing and inflating the value of the world's most valuable cryptocurrency seem a distant memory.

If 2021 was the year of the Bitcoin-related rollercoaster ride, 2022 has been a year of absolute hibernation, representing a contrast so great that it is hard to imagine that it is the same investment vehicle.

The doldrums which have existed for a few months now have been dubbed 'crypto winter' by analysts and journalists, a term used to depict the low values and lack of market movement which has overshadowed the previous enthuaiasm for Bitcoin trading.

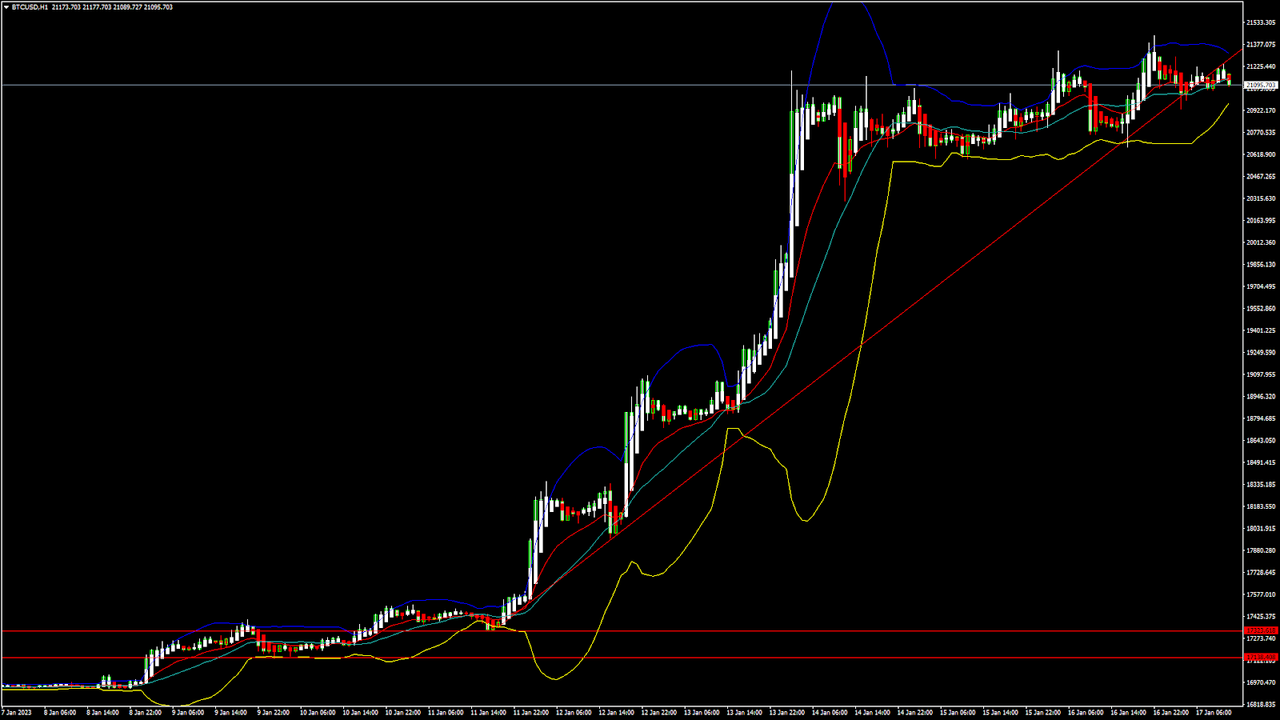
Today, however, during the Asian session, Bitcoin suddenly rose in value by a substantial amount, to $21,382 by 2.25am UK time.

On Thursday last week, Bitcoin was languishing at $18,880 therefore the rise over just 3 working days has been over $2,000.

As the price of Bitcoin headed toward the $20,000 mark at the beginning of this week, the total cryptocurrency market capitalization figure began to approach £1 trillion.

This is the first time that Bitcoin has passed the $20,000 mark since before the collapse of cryptocurrency exchange FTX in November.

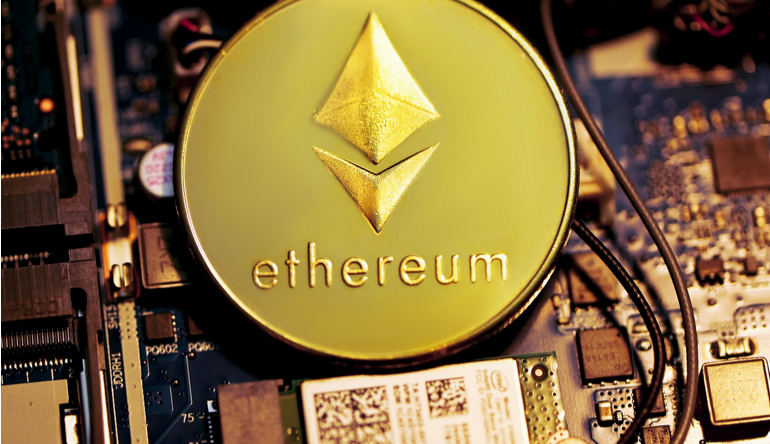
Last week, cryptocurrencies began to rise in value, with Ethereum, the world's second most popular cryptocurrency, having also increased its capitalization leading to a speculation among some analysts that the crypto winter may be over and some degree of resurgence is beginning.

Of course, these small increases are a far cry from the huge surges in value experienced in 2021, but they are significant when considering the totally flat values that have been in place for a few months.

Crypto-denominated stocks are also on the up, largely due to the sudden bullish approach to cryptocurrencies that has come about, and some pundits are considering that the lingering issue of continued inflation among centrally issued currencies and centralized economies dogged by recessions and rising costs are waking up the prices of cryptocurrencies as people look toward another year of high costs and depreciating fiat currencies and search for alternatives.

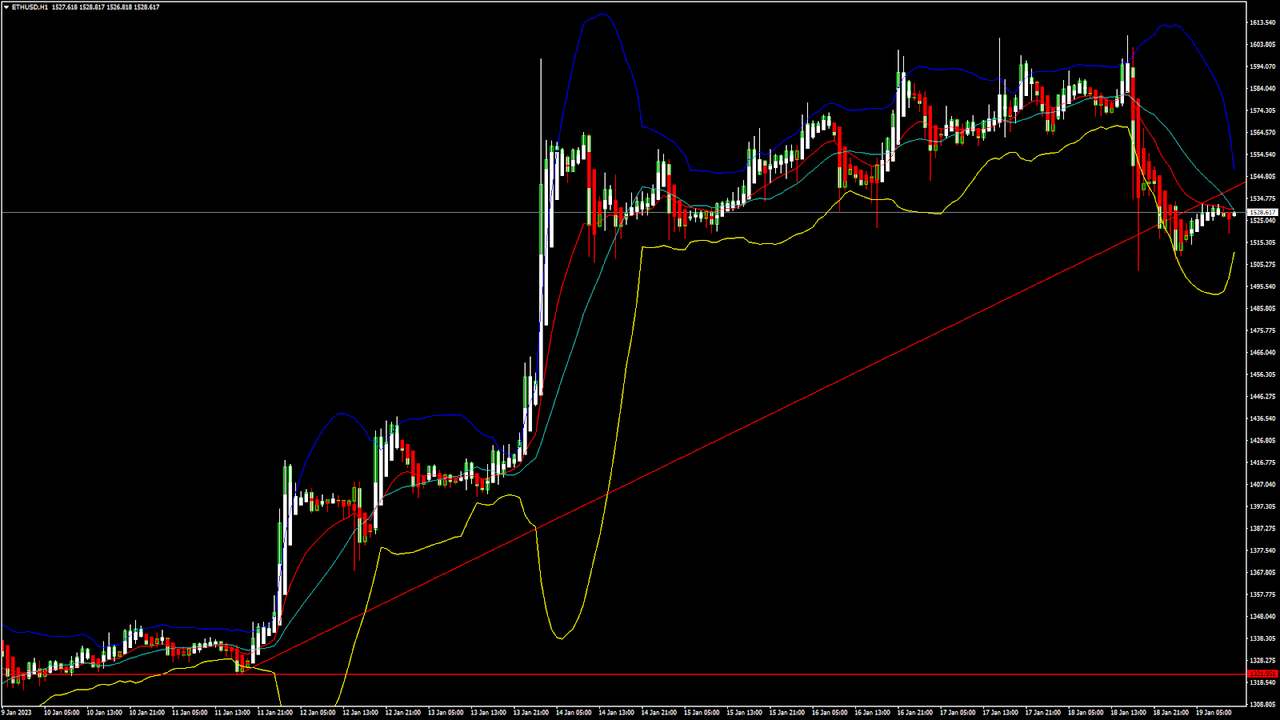
These opinions all amount to guesswork, however, but what is for sure is that there is a definitive sudden interest in cryptocurrencies once again and that is clearly demonstrated by looking at the chart patterns this morning.

VIEW FULL ANALYSIS VISIT - FXOpen Blog...

Disclaimer: This Forecast represents FXOpen Companies opinion only, it should not be construed as an offer, invitation or recommendation in respect to FXOpen Companies products and services or as Financial Advice.
 
FTSE 100 still at highest levels in 5 years despite this morning's drop
ftse-100.jpg


The performance of the 100 most prestigious companies listed on the London Stock Exchange has made for exciting viewing over recent days, with the FTSE 100 index that tracks them having rocketed in value.

Last week, the FTSE 100 index raced to its highest point in over three years, with some analysts across the City of London having begun to wonder whether it may reach 8,000 points.

Yesterday, the rally continued, and the FTSE 100 reached its highest position in five years, which is a remarkable milestone, as the trading day ended at a very high 7,856.

This morning, the trading bonanza came to an abrupt end, as a sudden drop took place at 9.00am during the London trading session, signaling a break in the FTSE 100 index's almost unstoppable rally.

However, even after such a drop, the FTSE 100 was still standing at 7,845 points which is still its highest point in five years apart from yesterday's peak.

The sudden drop was quickly reversed, and by 9.30am there was a slight movement upwards once again, which by 9.45am resulted in a climb back to 7,849 points.

Now it is hard to tell whether this upward movement will continue and cancel out this morning's drop entirely, or whether this is the end of the massive rally experienced by the FTSE 100 index over recent weeks.

Interestingly, in this age of high technology in which internet giants such as Amazon and Google dominate the world's corporate stage, NASDAQ has been hit badly with weakening overall stock values as the US tech stocks and electric vehicle manufacturers' poor performance has had an impact.

Meanwhile the FTSE 100 which tracks traditional firms such as airlines, mining companies, banks, pharmaceuticals, retail giants, supermarkets and healthcare firms among others, is booming.

All this with a backdrop of a weak economy in the United Kingdom and high inflation compared to greater production output and lower inflation in the United States.

For the moment, it certainly appears that there is life in 'low tech' and that London's trading floor is a hive of activity.

VIEW FULL ANALYSIS VISIT - FXOpen Blog...

Disclaimer: This Forecast represents FXOpen Companies opinion only, it should not be construed as an offer, invitation or recommendation in respect to FXOpen Companies products and services or as Financial Advice.
 
BTCUSD and XRPUSD Technical Analysis – 17th JAN 2023
btc.png


BTCUSD: Three Inside Up Pattern Above $17323

Bitcoin continues its bullish momentum from last week and after touching a low of $17323 on 11th Jan, the price started to correct upwards against the US Dollar and is now ranging above the $21000 handle in the European trading session today.

We can see an upwards rally in the BTCUSD which managed to touch the level of $21390 on 16th Jan.

We can clearly see a three inside up pattern above the $17323 handle which is a bullish reversal pattern because it signifies the end of a downtrend and a shift towards an uptrend.

Bitcoin touched an intraday high of 21288 and an intraday low of 20952 in the Asian trading session today.

The price of bitcoin is ranging near a new record high of 1 month.

The ichimoku is indicating a bullish crossover with tenkan and kijun in the 30-minute time frame.

Both the STOCH and Williams percent range are indicating overbought levels which means that in the immediate short term, a decline in the prices is expected.

The resistance of the channel is broken in the 15-minute time frame indicating bullish trends.

The relative strength index is at 72.09 indicating a very strong demand for bitcoin, and the continuation of the buying pressure in the markets.

Bitcoin is now moving above its 100 hourly simple moving average and above its 100 hourly exponential moving averages.

Most of the major technical indicators are giving a buy signal, which means that in the immediate short term, we are expecting targets of 22000 and 23500.

The average true range is indicating less market volatility with a strong bullish momentum.

  • Bitcoin: bullish continuation seen above $17323
  • The STOCHRSI is indicating an OVERSOLD level
  • The price is now trading just below its pivot level of $21167
  • The short term range is strongly bullish

Bitcoin: Bullish Continuation Seen Above $17323
btcx.png


The price of Bitcoin witnessed a rally after crossing the $18000 levels, and now we can see some market consolidation above the $21000 levels.

After the consolidation phase is over, we are expecting upside moves in the range of $22000 to $24000 levels.

There is an ascending channel forming with the current support at $17379 which is a 14-3 day raw stochastic at 20%.

We can see the formation of a bullish trend reversal pattern with the adaptive moving average AMA20 in the 15-minute time frame.

The immediate short-term outlook for bitcoin is strongly bullish, the medium-term outlook has turned bullish, and the long-term outlook remains neutral under present market conditions.

Bitcoin’s support zone is located at $18865 which is a 50% retracement from a 4-week high/low and at $19892 which is a 14-3 day raw stochastic at 70%.

The price of BTCUSD is now facing its classic resistance level of 21263 and Fibonacci resistance level of 21320 after which the path towards 22000 will get cleared.

In the last 24hrs BTCUSD has increased by 1.28% by 266.18$ and has a 24hr trading volume of USD 22.330 billion. We can see a decrease of 4.90% in the trading volume compared to yesterday, which appears to be normal.

The Week Ahead

Bitcoin’s price rocketed higher recently and moved to a 2-month high crossing the $21000 levels. We are now looking for the next upwards move towards the $22000 and $24000 levels.

The daily RSI is printing at 86.91 which indicates a very STRONG demand for bitcoin and the continuation of the bullish phase present in the markets in the short-term range.

We can see the formation of a bullish trend line from $17323 towards the $21324 level.

The price of BTCUSD is now facing its resistance zone located at $21466 which is a 13-week high and $22981 which is a 3-10 day MACD oscillator stalls.

The weekly outlook is projected at $23000 with a consolidation zone of $22000.

Technical Indicators:

The MACD (12,26): is at 689.90 indicating a BUY

The commodity channel index, CCI (14): is at 86.32 indicating a BUY

The rate of price change, ROC: is at 1.60 indicating a BUY

Bull/bear power (13): is at 593.30 indicating a BUY

VIEW FULL ANALYSIS VISIT - FXOpen Blog...

Disclaimer: This Forecast represents FXOpen Companies opinion only, it should not be construed as an offer, invitation or recommendation in respect to FXOpen Companies products and services or as Financial Advice.
 
EUR/USD Could Correct Lower While USD/JPY Starts Fresh Increase
eur.jpg


EUR/USD is correcting lower and trading below 1.0820. USD/JPY could gain bullish momentum if there is a clear move above the 130.80 resistance.

Important Takeaways for EUR/USD and USD/JPY

  • The Euro started a downside correction from the 1.0870 resistance zone.
  • There was a break below a key bullish trend line with support near 1.0800 on the hourly chart of EUR/USD.
  • USD/JPY is attempting a fresh increase above the 130.00 support zone.
  • There was a break above a major bearish trend line with resistance near 129.20 on the hourly chart.

EUR/USD Technical Analysis

This past week, the Euro found support near the 1.0700 zone against the US Dollar. The EUR/USD pair started a steady upward move above the 1.0750 and 1.0800 resistance levels.

There was a clear increase above the 1.0820 resistance zone and the 50 hourly simple moving average. The pair even climbed towards the 1.0850 resistance zone. A high was formed near 1.0874 on FXOpen and the pair is now correcting gains.

EUR/USD Hourly Chart
eurx.jpg


There was a move below the 1.0820 support zone. The bears pushed the pair below the 50% Fib retracement level of the upward move from the 1.0730 swing low to 1.0874 high.

Besides, there was a break below a key bullish trend line with support near 1.0800 on the hourly chart of EUR/USD. The pair is now showing bearish signs near 1.0785.

It is consolidating near the 61.8% Fib retracement level of the upward move from the 1.0730 swing low to 1.0874 high. An initial support on the downside is near the 1.0775 level. The first major support is near the 1.0750 level.

The main support sits near the 1.0720 zone, below which the pair could start a major decline. In the stated case, the pair might dive towards the 1.0650 support zone.

On the upside, an immediate resistance is near the 1.0820 level. The next major resistance is near the 1.0850 level. An upside break above 1.0850 could set the pace for another increase. In the stated case, the pair might visit 1.0920. Any more gains might send the pair towards 1.0980.

VIEW FULL ANALYSIS VISIT - FXOpen Blog...

Disclaimer: This Forecast represents FXOpen Companies opinion only, it should not be construed as an offer, invitation or recommendation in respect to FXOpen Companies products and services or as Financial Advice.
 
The Davos dampener: Markets stagnant on WEF discussions
img-002.png


The annual World Economic Forum conference is well under way this week, and as can perhaps be expected, the debates taking place at the event, which is being held in its usual location of Davos, Switzerland, are having an effect on the global markets.

The World Economic Forum, often referred to by its acronym WEF, is well known to polarize opinions.

There are some who view it as a meeting of the global elite, who convene to discuss the planned agendas which in some cases are viewed as anti-business or anti-free market by dissenters, and there are those who consider it an important platform to address global matters on how the business world interacts with overall society and nature.

For this reason, the discussions taking place at the annual WEF conference are being reported widely by global media and having an effect on the markets.

It is common for high profile celebrities who attend the WEF annual conference to voice their opinions on fashionable issues such as the environment, or distribution of wealth, and on that subject, it was reported yesterday that approximately 200 members of the super-rich global elite, one of which was Disney heiress Abigail Disney, explained that they are calling on governments around the world to “tax us, the ultra rich, now” in order to help billions of people struggling with cost of living crisis.

This self-inflicted attempt to remove wealth from the coffers of some of the highest generators of income in the world is a way of clearly reinforcing a widely held opinion that the WEF conference is attended by many very wealthy individuals whose viewpoint favors removing their own and other peoples' wealth and distributing it, giving rise to a perception that it has socialist overtones.

On the agenda for discussion was the slow economic growth in western markets, and the ongoing geopolitical discourse between the Western nations and Russia and China.

On the subject of China's economy, it has grown just 3% in the past year, marking 2022 as the slowest growth for the Chinese economy in many years. Citi Group's chief executive Jane Fraser told a panel at the WEF annual meeting today that it is a positive step that China's economy is reopening.

The draconian lockdowns have paralized China's economy in the eyes of the outside world, however real economic data from inside China is very hard to obtain.

One interesting discussion, as reported today by the Financial Times, is that Gita Gopinath, deputy managing director of the IMF, signalled that the fund would upgrade its economic forecasts. Instead of predicting a “tougher” 2023, she now expected an “improvement” in the second half of the year and into 2024.

US business leaders hailed the Joe Biden administration’s Inflation Reduction Act — a $369bn bid to stimulate green investments in America’s economy.

Overall, whilst there has been a backdrop of harsh economic circumstances across many markets over the last year, the annual discussions at Davos often put the dampener on the markets until the conference is over. Let's hope it is business as usual after that.

VIEW FULL ANALYSIS VISIT - FXOpen Blog...

Disclaimer: This Forecast represents FXOpen Companies opinion only, it should not be construed as an offer, invitation or recommendation in respect to FXOpen Companies products and services or as Financial Advice.
 
ETHUSD and LTCUSD Technical Analysis – 19th JAN, 2023
eth.png


ETHUSD: Double Bottom Pattern Above $1321

Ethereum was unable to sustain its bearish momentum and after touching a low of 1321 on 11th Jan, the price started to correct upwards against the US dollar crossing the $1600 handle on 18th Jan.

The prices are ranging near horizontal support in the daily time frame indicating bullish trends.

We can clearly see a double bottom pattern above the $1321 handle which is a bullish pattern and signifies the end of a bearish phase and the start of a bullish phase in the markets.

ETH is now trading just below its pivot level of 1540 and moving in a mildly bullish channel. The price of ETHUSD is now testing its classic resistance level of 1575 and Fibonacci resistance level of 1639 after which the path towards 1700 will get cleared.

We have also seen the formation of a bullish harami pattern in the 15-minute time frame.

The relative strength index is at 72.46 indicating a STRONG demand for Ether and the continuation of the buying pressure in the markets.

Both the STOCH and average directional index are indicating an overbought market, which means that the prices are expected to decline in the short-term range.

Most of the technical indicators are giving a STRONG BUY market signal.

Most of the moving averages are giving a STRONG BUY signal at the current market levels of $1528.

ETH is now trading above both the 100 hourly simple and 100 hourly exponential moving averages.

  • Ether: bullish reversal seen above the $1321 mark
  • The short-term range appears to be mildly bullish
  • ETH continues to remain above the $1500 level
  • The average true range is indicating HIGH market volatility

Ether: Bullish Reversal Seen Above $1321
etx.png


ETHUSD continues to trade higher against the US dollar and bitcoin. The price of Ethereum remains supported above the $1500 level and now we are testing the break of the $1600 handle.

We can see the formation of a bullish price crossover pattern with the adaptive moving average AMA20 in the daily time frame.

We have also detected a bullish Doji star pattern in the 1-hour time frame.

ETHUSD touched an intraday low of 1507 in the Asian Trading session and an intraday high of 1531 in the European trading session today.

The STOCHRSI is indicating a NEUTRAL level.

The key support levels to watch are $1432 which is a 38.2% Retracement from a 4-week high, and $1446 at which the price crosses 9-Day Moving Average.

ETH has decreased by 3.18% with a price change of 50.14$ in the past 24hrs and has a trading volume of 10.105 billion USD.

We can see an Increase 33.87% in the total trading volume in the last 24 hrs which appears to be normal.

The Week Ahead

ETH has already made a successful attempt at crossing the $1600 level and the next targets are located at $1700 and $1800 in the medium-term.

At present, the price is moving in a consolidation channel above the $1500 level.

We can see the formation of a bullish ascending channel from $1321 towards the $1542 level.

The immediate short-term outlook for Ether has turned mildly bullish, the medium-term outlook has turned bullish, and the long-term outlook for Ether is neutral under present market conditions.

The resistance zone is located at $1588 which is a pivot point 1st resistance point and at $1618 which is a 3-10 day MACD oscillator stalls.

The weekly outlook is projected at $1700 with a consolidation zone of $1650.

Technical Indicators:

The relative strength index, RSI (14): is at 72.46 indicating a BUY

The moving average convergence divergence, MACD (12,26): is at 79.85 indicating a BUY

The ultimate oscillator: is at 60.41 indicating a BUY

The rate of price change, ROC: is at 22.11 indicating a BUY

VIEW FULL ANALYSIS VISIT - FXOpen Blog...

Disclaimer: This Forecast represents FXOpen Companies opinion only, it should not be construed as an offer, invitation or recommendation in respect to FXOpen Companies products and services or as Financial Advice.
 
AUD/USD and NZD/USD At Risk of Additional Losses
aud.jpg


AUD/USD declined below the 0.7000 and 0.6950 support levels. NZD/USD also declined towards 0.6365 and is currently attempting a recovery wave.

Important Takeaways for AUD/USD and NZD/USD

  • The Aussie Dollar started a fresh decline from well above the 0.7000 level against the US Dollar.
  • There was a break below a key bullish trend line with support near 0.6960 on the hourly chart of AUD/USD.
  • NZD/USD declined heavily below the 0.6450 support zone and tested 0.6365.
  • There was a break below a major bullish trend line with support near 0.6405 on the hourly chart of NZD/USD.

AUD/USD Technical Analysis

The Aussie Dollar started a fresh decline from the 0.7065 zone against the US Dollar. The AUD/USD pair remained in a bearish zone below the 0.7000 level.

There was a clear move below the 0.6950 support and the 50 hourly simple moving average. Besides, there was a break below a key bullish trend line with support near 0.6960 on the hourly chart of AUD/USD.

AUD/USD Hourly Chart
audx.jpg


The pair traded as low as 0.6871 FXOpen and is currently correcting higher. It surpassed the 23.6% Fib retracement level of the downward move from the 0.7063 swing high to 0.6871 low.

On the upside, the AUD/USD pair is facing resistance near the 0.6940 level and the 50 hourly simple moving average. The next major resistance is near the 0.6970 level. It is near the 50% Fib retracement level of the downward move from the 0.7063 swing high to 0.6871 low.

A close above the 0.6970 level could start another steady increase in the near term. The next major resistance could be 0.7040.

On the downside, an initial support is near the 0.6890 level. The next support could be the 0.6870 level. If there is a downside break below the 0.6870 support, the pair could extend its decline towards the 0.6820 level. Any more losses might send the pair towards the 0.6750 support.

VIEW FULL ANALYSIS VISIT - FXOpen Blog...

Disclaimer: This Forecast represents FXOpen Companies opinion only, it should not be construed as an offer, invitation or recommendation in respect to FXOpen Companies products and services or as Financial Advice.
 
Watch FXOpen's January 16 - 20 Weekly Market Wrap Video

In this video, FXOpen UK COO Gary Thomson sums up the week’s happenings and discusses the most significant news reports.

  • The Davos dampener: Markets stagnant on WEF discussions
  • China stock market outlook
  • The probability of a reversal of the dollar index is growing
  • Crypto winter giving way to Crypto spring? Bitcoin suddenly wakes up

Watch our short and informative video, and stay updated with FXOpen.


FXOpen YouTube


Disclaimer: This forecast represents FXOpen Companies opinion only, it should not be construed as an offer, invitation or recommendation in respect to FXOpen Companies products and services or as financial advice.
 
GBP/USD Rallies Above 1.2400, USD/CAD Could Extend Losses
gbp.jpg


GBP/USD started a major increase and traded above 1.2400. USD/CAD is declining and might even trade below the 1.3350 support.

Important Takeaways for GBP/USD and USD/CAD

  • The British Pound was able to move above the 1.2300 and 1.2350 resistance levels.
  • There was a break above a key contracting triangle with resistance near 1.2380 on the hourly chart of GBP/USD.
  • USD/CAD declined below the 1.3450 and 1.3400 support levels.
  • It traded below a major bullish trend line with support near 1.3382 on the hourly chart.

GBP/USD Technical Analysis

After forming a base above the 1.2100, the British Pound started a steady increase against the US Dollar. GBP/USD gained pace for a move above the 1.2250 and 1.2300 resistance levels.

There was a move above the 1.2350 resistance and the 50 hourly simple moving average. The pair even moved above the 1.2400 level and traded as high as 1.2447 on FXOpen. During the increase, there was a break above a key contracting triangle with resistance near 1.2380 on the hourly chart of GBP/USD.

GBP/USD Hourly Chart
gbpx.jpg


It is now correcting gains and trading near the 1.2440 level. However, it is trading well above 1.2350 and the 50 hourly simple moving average.

On the downside, an initial support is near the 1.2240 area. It is near the 23.6% Fib retracement level of the upward move from the 1.2335 swing low to 1.2447 high.

The next major support is near the 1.2400 level or the 50% Fib retracement level of the upward move from the 1.2335 swing low to 1.2447 high. If there is a break below 1.2390, the pair could extend its decline.

The next key support is near the 1.2320 level. Any more losses might call for a test of the 1.2250 support. An immediate resistance is near the 1.2450 level.

The next resistance is near the 1.2500 level. If there is an upside break above the 1.2500 zone, the pair could rise towards 1.2620. The next key resistance could be 1.2750.

VIEW FULL ANALYSIS VISIT - FXOpen Blog...

Disclaimer: This Forecast represents FXOpen Companies opinion only, it should not be construed as an offer, invitation or recommendation in respect to FXOpen Companies products and services or as Financial Advice.
 
Monday morning blues as EY forecast worse UK recession than expected
img003.png


For almost two years, there have been constant looming thoughts that the United Kingdom's economy may face a long, drawn out recession.

During 2021, a time when the interest rates were rising at levels not seen in the past five decades across Europe and North America, there were reports casting a dark shadow over the future of the economy in many Western countries, often stating that it the circumstances at the time may lead to the worst recession in hundreds of years.

Lockdowns which caused low productivity among large companies whilst causing many smaller businesses to go out of business, a global supply chain disruption, and energy price increases which in some cases rocketed by several hundred percent due to geopolitical instability ae some of the reasons which have cast doubt in the minds of many, as costs for individuals and businesses soar whilst double-digit inflation causes earnings to depreciate.

The much-discussed forthcoming recession has not yet arrived, however. Yes, there is a severe cost of living crisis, and belts across Europe and the United Kingdom are very much tightened until their last buckle-hole, but still there is not an actual recession.

This has caused many analysts to consider the possibility that when it comes, it will be severe. Now, global consultancy Ernst & Young (EY) has begun to show its grave concern that a major recession which is worse than predicted, is on the horizon.

Reduced government support, higher taxes and an overall worsening outlook have all led the firm’s analysts to conclude that the next three years could be worse than they anticipated three months ago.

EY's prediction includes a forecast that the United Kingdom's gross domestic product could drop by 0.7% this year, but may increase again in the following years.

A year is a long time, however, and given the market volatility which has taken place over the past two years, looking at a very extensive recession which could last a whole year before any improvement is experienced is a big consideration.

It may be only one report, but EY is a large enough consultancy for the markets to take notice of. This morning the British Pound declined against the Euro and by 8.00am in the London trading session, it was trading in the low 1.14 range, a slight downturn after it rose to almost 1.15 late last week.

By contrast, the Pound remains stable against the US Dollar, therefore showing robustness despite the gloomy outlook.

It is worth noting that the FTSE 100 index is booming and has been doing so for a few weeks now, giving rise to the notion that despite the gloomy economic outlook, British blue chip stocks are extremely popular and the traditional companies making up the FTSE 100 index are performing strongly overall, compared to the tech stock carnage that has taken place on the NASDAQ exchange in the United States over the past few weeks.

It appears that whilst the US economy is doing overall better than the British economy, the big money is still sitting in the British low-tech and old school stocks whilst investors turn their back on volatile and depreciating US tech stocks.

VIEW FULL ANALYSIS VISIT - FXOpen Blog...

Disclaimer: This Forecast represents FXOpen Companies opinion only, it should not be construed as an offer, invitation or recommendation in respect to FXOpen Companies products and services or as Financial Advice.
 
Back
Top