Daily Market Analysis By FXOpen

EUR/USD and EUR/JPY At Risk of Fresh Decline
eur.png


EUR/USD is facing resistance near the 1.0880 zone. EUR/JPY is also facing hurdles and remains at a risk of a downward move below 141.00.

Important Takeaways for EUR/USD and EUR/JPY

  • The Euro started a fresh increase from the 1.0800 zone.
  • There is a key bearish trend line forming with resistance near 1.0895 on the hourly chart.
  • EUR/JPY started a steady increase after it found support near the 140.75.
  • There is a connecting bearish trend line forming with resistance near 141.65 on the hourly chart.

EUR/USD Technical Analysis

The Euro formed a base above the 1.0800 zone and started a decent increase against the US Dollar. The EUR/USD pair was able to clear the 1.0820 and 1.0840 resistance levels.

There was a clear move above the 1.0850 level and the 50 hourly simple moving average. The pair even climbed above the 50% Fib retracement level of the downward move from the 1.0913 swing high to 1.0802 low (formed on FXOpen).

EUR/USD Hourly Chart
eurx.jpg


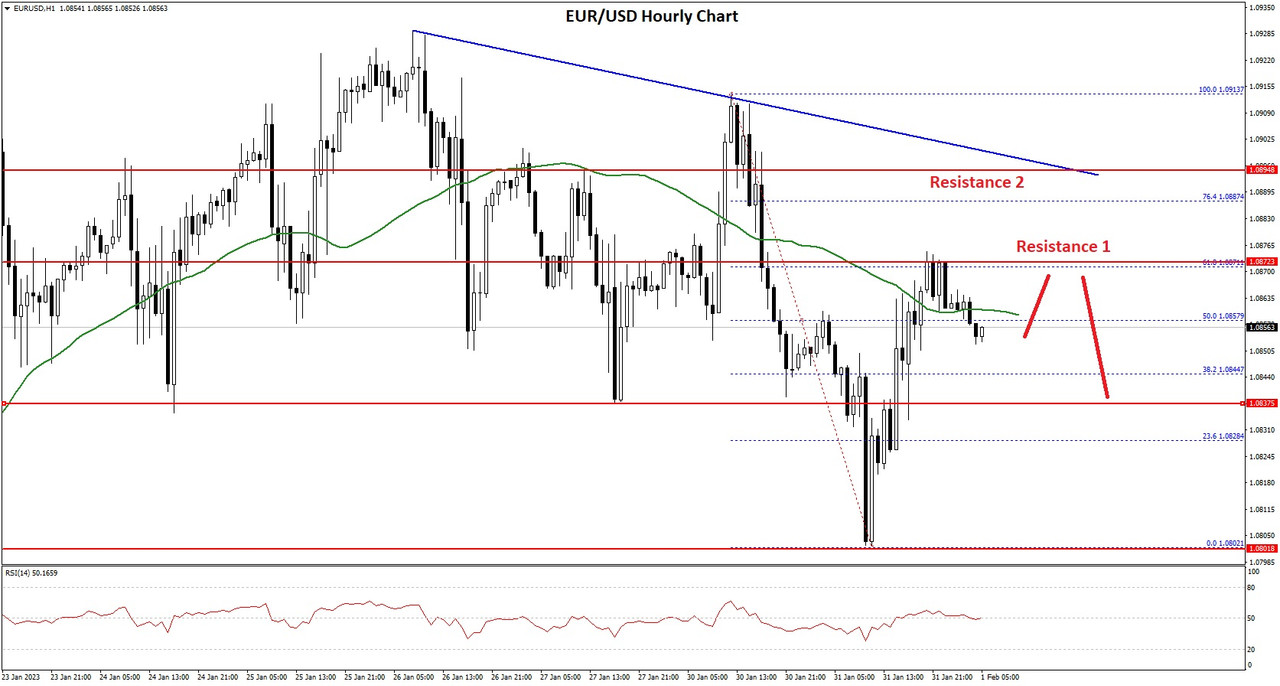
However, the pair struggled to stay above the 1.0865 level and the 50 hourly simple moving average. It failed to clear the 61.8% Fib retracement level of the downward move from the 1.0913 swing high to 1.0802 low.

On the downside, the pair might find support near the 1.0840 level. The next major support sits near the 1.0825 level, below which the pair could even test the 1.0800 support zone.

If there is a downside break below the 1.0800 support, the pair might accelerate lower in the coming sessions. In the stated case, it could even test 1.0725. On the upside, an immediate resistance is near the 1.0870 level. There is also a key bearish trend line forming with resistance near 1.0895 on the hourly chart.

The next major resistance is near the 1.0920 level. A clear move above the 1.0920 resistance might send the price towards 1.0950. If the bulls remain in action, the pair could visit the 1.1050 resistance zone in the near term.

VIEW FULL ANALYSIS VISIT - FXOpen Blog...

Disclaimer: This Forecast represents FXOpen Companies opinion only, it should not be construed as an offer, invitation or recommendation in respect to FXOpen Companies products and services or as Financial Advice.
 
Yup! If price goes up or down, it will reach that so-and-so level.... nothing definite but trade what you see in front of you and from what latest economic news are telling us on probability of that particular currency.
 
USD down slightly ahead of Fed announcement as interest rates look toward 15 year high
usdx.png


Today, the Federal Reserve bank in the United States is set to make an announcement regarding another potential interest rate increase, which would represent the latest in a long string of such actions over the past year.

Should this proceed, it may dampen the enthusiasm of investors, and therefore have a negative effect on the US economy overall.

However, the US Dollar has remained strong, and when looking at this morning's chart analysts across the world are predicting that the interest rates in the United States may once again be increased.

As a result, it would perhaps be very understandable to consider the possibility that the US Dollar, which has been has been very strong this year against other major currencies, could perhaps decrease in value rapidly.

The reality is quite different and the US Dollar has only made a very slight dip against some of its major peers.

The British Pound was up to the high 1.23 range against the US Dollar early this morning during the London trading session.

This is because a number of central banks around the world are set to increase interest rates, and during the course of this week it is widely estimated that the combination of central banks in many key nations with developed financial markets economies may increase interest rates to highest levels since the financial crisis, stoking anxiety among some investors that this month’s bond market rally underestimates evidence of persistent inflation.

At the end of the 2000s, when the global financial crisis hit and major financial institutions with long heritages began to collapse - notably the high profile and catastrophic demise of Lehman Brothers, and subsequent other disasters such as the bankruptcy of Bear Stearns - the world's oldest investment bank - and nationalization of many large banks such as Barclays, HSBC and Lloyds due to their over-exposure to secured and unsecured credit, as well as the aggressive takeover attempt by Royal Bank of Scotland which resulted in it having to be bailed out by the British taxpayer, the interest rates were at around 5% in the United Kingdom, the Eurozone and the United States.

Since then, they have been incredibly low across the 2010s, and only in 2021 did they begin to rise again. It is looking likely that they will be up to the 5% mark again.

Of course, it is still a far cry from the 15% interest rates that were commonplace in the United Kingdom and some other key markets during the early 1990s, which is perhaps remarkable considering the geopolitical circumstances of the past three years, but 5% is a massive increment over the less than 1% many consumers have been used to for many years until 2021.

VIEW FULL ANALYSIS VISIT - FXOpen Blog...

Disclaimer: This Forecast represents FXOpen Companies opinion only, it should not be construed as an offer, invitation or recommendation in respect to FXOpen Companies products and services or as Financial Advice.
 
ETHUSD and LTCUSD Technical Analysis – 02nd FEB, 2023
eth.png


ETHUSD: Three White Soldiers Pattern Above $1535

Ethereum was unable to sustain its bearish momentum and after touching a low of 1535 on 30th Jan, the price started to correct upwards against the US dollar crossing the $1650 handle today in the Asian trading session.

After touching a high of $1694 the prices have retracted due to profit taking by the medium-term investors.

We have seen a bullish opening of the markets this week.

We can clearly see a three white soldiers pattern above the $1535 handle which is a bullish pattern and signifies the end of a bearish phase and the start of a bullish phase in the markets.

ETH is now trading just below its pivot level of 1665 and moving into a strong bullish channel. The price of ETHUSD is now testing its classic resistance level of 1668 and Fibonacci resistance level of 1673 after which the path towards 1700 will get cleared.

We have also seen the formation of a Bullish engulfing line in the weekly time frame.

The price of Ethereum is ranging near the support of the channel in the 15-minute time frame indicating a bullish scenario.

The relative strength index is at 68.86 indicating a strong demand for Ether and the continuation of the buying pressure in the markets.

The Williams percent range is indicating an overbought market, which means that the price is expected to decline in the short-term range.

Most of the technical indicators are giving a strong buy market signal.

Most of the moving averages are giving a strong buy signal at the current market level of $1666.

ETH is now trading above both the 100 hourly simple and 100 hourly exponential moving averages.

  • Ether: bullish reversal seen above the $1535 mark
  • Short-term range appears to be strongly bullish
  • ETH continues to remain above the $1650 level
  • The average true range is indicating less market volatility

Ether: Bullish Reversal Seen Above $1535
etx.png


ETHUSD continues to trade higher against the US dollar and bitcoin. The price of Ethereum remains supported above the $1600 level and now we are testing the break of the $1700 handle.

We can see the formation of a B=bullish price crossover pattern with adaptive moving average AMA20 in the weekly time frame.

The momentum indicator is back over zero in the daily time frame indicating bullish trends.

We have also detected the formation of a bullish harami pattern in the 4-hour time frame.

ETHUSD touched an intraday low of 1633 and an intradayhHigh of 1694 in the Asian trading session today.

The STOCHRSI is indicating an oversold level, which indicates that the prices will continue to rise in the medium-term range.

The key support levels to watch are $1594 which is a 14-3 day raw stochastic at 50%, and $1637 at which the price crosses 9-day moving average stalls.

ETH has increased by 5.88% with a price change of 92.60$ in the past 24hrs and has a trading volume of 9.958 billion USD.

We can see an increase of 60.00% in the total trading volume in the last 24 hrs which is due to heavy buying seen at lower levels.

The Week Ahead

ETH has already made a failed attempt to cross the $1700 level by touching $1694 today. Now we are expecting a retest of the $1700 breach after which the next targets are located at $1800 and $1900 levels.

At present, the prices are moving in a consolidation channel above the $1650 level.

We can see the formation of a bullish ascending channel from $1535 towards the $1684 level.

The immediate short-term outlook for Ether has turned strongly bullish, the medium-term outlook has turned bullish, and the long-term outlook for Ether is neutral in present market conditions.

The resistance zone is located at $1701 which is the pivot point 2nd resistance level and at $1868 which is a 14-day RSI at 80%.

The weekly outlook is projected at $1800 with a consolidation zone of $1750.

Technical Indicators:

The relative strength index, RSI (14): is at 68.86 indicating a BUY

The moving average convergence divergence, MACD (12,26): is at 21.75 indicating a BUY

The average directional index: is at 23.83 indicating a BUY

The rate of price change: is at 22.11 indicating a BUY

VIEW FULL ANALYSIS VISIT - FXOpen Blog...

Disclaimer: This Forecast represents FXOpen Companies opinion only, it should not be construed as an offer, invitation or recommendation in respect to FXOpen Companies products and services or as Financial Advice.
 
AUD/USD and NZD/USD Signals Downside Extension
aud.png


AUD/USD is correcting gains from the 0.7150 resistance zone. NZD/USD is also declining and reaching an important support at 0.6450.

Important Takeaways for AUD/USD and NZD/USD

  • The Aussie Dollar started a fresh decline from the 0.7150 resistance against the US Dollar.
  • There was a break below a key bullish trend line with support near 0.7080 on the hourly chart of AUD/USD.
  • NZD/USD also started a downside correction after it failed to clear 0.6540.
  • There is a connecting bullish trend line forming with support near 0.6440 on the hourly chart of NZD/USD.

AUD/USD Technical Analysis

The Aussie Dollar gained pace above the 0.7100 resistance zone against the US Dollar. The AUD/USD pair even spiked above the 0.7150 level before the bears appeared.

The pair traded as high as 0.7157 on FXOpen and started a fresh downside correction. There was a clear move below the 0.7120 and 0.7100 support levels. The pair declined below the 50% Fib retracement level of the upward move from the 0.6983 swing low to 0.7157 high.

AUD/USD Hourly Chart
audx.jpg


Besides, there was a break below a key bullish trend line with support near 0.7080 on the hourly chart of AUD/USD. The pair is now trading below 0.7080 and the 50 hourly simple moving average.

On the downside, an initial support is near the 0.7050 level. It is near the 61.8% Fib retracement level of the upward move from the 0.6983 swing low to 0.7157 high. The next support could be the 0.7000 level. If there is a downside break below the 0.7000 support, the pair could extend its decline towards the 0.6940 level.

On the upside, the AUD/USD pair is facing resistance near the 0.7080 level. The next major resistance is near the 0.7100 level.

A close above the 0.7100 level could start another steady increase in the near term. The next major resistance could be 0.7150.

VIEW FULL ANALYSIS VISIT - FXOpen Blog...

Disclaimer: This Forecast represents FXOpen Companies opinion only, it should not be construed as an offer, invitation or recommendation in respect to FXOpen Companies products and services or as Financial Advice.
 
Watch FXOpen's January 30 - February 3 Weekly Market Wrap Video

In this video, FXOpen UK COO Gary Thomson sums up the week’s happenings and discusses the most significant news reports.

  • What CHATGPT means for investors
  • Brent Crude Oil price takes a bashing overnight
  • Markets focus on Bitcoin as volatility takes it to 5-month high
  • The reaction of financial markets to the decision of the Fed

Watch our short and informative video, and stay updated with FXOpen.


FXOpen YouTube


Disclaimer: This forecast represents FXOpen Companies opinion only, it should not be construed as an offer, invitation or recommendation in respect to FXOpen Companies products and services or as financial advice.

#fxopen #fxopenyoutube #fxopenuk #weeklyvideo
 
GBP/USD Drops Sharply While EUR/GBP Gains Momentum
gbp.png


GBP/USD started a fresh decline below the 1.2200 support zone. EUR/GBP is rising and trading above the 0.8920 support zone.

Important Takeaways for GBP/USD and EUR/GBP

  • The British Pound started a fresh decline from the 1.2400 resistance against the US Dollar.
  • There is a key bearish trend line forming with resistance near 1.2120 on the hourly chart of GBP/USD.
  • EUR/GBP started a steady increase above the 0.8900 and 0.8920 levels.
  • There is a major bullish trend line forming with support near 0.8945 on the hourly chart.

GBP/USD Technical Analysis

The British Pound started a major decline from well above the 1.2350 level against the US Dollar. The GBP/USD pair gained pace below the 1.2300 level to move into a bearish zone.

There was a clear move below the 1.2200 level and the 50 hourly simple moving average. The bears even pumped the price below the 1.2120 level and a low is formed near 1.2031 on FXOpen. It is now consolidating losses and trading below the 1.2100 level.

GBP/USD Hourly Chart
gbpx.jpg


On the upside, an initial resistance is near the 1.2100 level. The first major resistance is near the 1.2120 level. It is close to the 23.6% Fib retracement level of the downward move from the 1.2400 swing high to 1.2031 low.

There is also a key bearish trend line forming with resistance near 1.2120 on the hourly chart of GBP/USD. A clear move above the 1.2120 level could spark a decent increase.

The next major resistance sits near the 1.2215 level or the 50% Fib retracement level of the downward move from the 1.2400 swing high to 1.2031 low. Any more gains might send the pair towards the 1.2250 resistance zone.

On the downside, an initial support is near the 1.2030 level. The next major support is near the 1.2000 level. Any more losses could lead the pair towards the 1.1920 support zone.

VIEW FULL ANALYSIS VISIT - FXOpen Blog...

Disclaimer: This Forecast represents FXOpen Companies opinion only, it should not be construed as an offer, invitation or recommendation in respect to FXOpen Companies products and services or as Financial Advice.
 
British Pound hits the deck as Western markets raise interest rates
gbp.png


At the end of last week, the much anticipated action from many central banks across the Western world took place, and interest rates were increased once again.

There were many forecasts during the advent of the interest rate rises which largely focused on the United States Federal Reserve Bank's anticipated rate rise, however the European Central Bank and the Bank of England both conducted interest rate increases at the same time.

In the United Kingdom, which has been reported to have the least investable provincial economy in Europe, placing it alongside Greece, the effect has been the greatest.

The British Pound dipped to its lowest point against the US Dollar in over a month, and is currently trading at 1.21.

This has ended the steady climb in the value of the British Pound which has taken place over the past few weeks, as it hauled itself out of oblivion after many months of declining values during the summer of 2022, ending in November.

Interest rates in the United Kingdom were raised to 4%, which is not far off the 5% that was predicted by many investment banks in the summer of 2022, whose analysts predicted that by January 2023, interest in the UK would rise to approximately 5% which appeared a grave prediction given their very low position back then which was under 2%.

Now, at 4%, there is grave concern, and even before this level had been reached, mortgage lenders across the United Kingdom had been removing mortgage products from the market to avoid borrowers being unable to service monthly payments should the interest rates increase to these levels.

Whilst it may sound alarmist, 4% is nowhere near the 15% interest that was demanded back in 1991 and 1992, but back then borrowing was quite low, and even though that period was considered to be very much a period of austerity, it was recoverable quite quickly.

Today, borrowing is at a much higher level and mortgage lenders are often exposed to individual borrowings exceeding £500,000 whereas in the early 1990s it was between £10,000 and £20,000. At the end of the 1990s, the average property price rocketed and more than doubled in just one year, and has been rising ever since, but salaries have not kept up with this, hence greater exposure to debt.

When interest rates were less than 1%, this was not a problem, but now with increasing rates, the cash strapped are finding themselves lumbered with unserviceable repayments.

London remains a global powerhouse and has its own economy which is still flourishing as it is an influential capital which conducts global business at top level, however the rest of the country is a very different matter.

Just two weeks ago, the Institute for Public Policy Research, a well recognized think tank, noted that outside London, especially the north of England is fiscally barren. The report stated that only Geece has lower levels of public and private investment in a ranking of Organisation for Economic Co-operation and Development (OECD) countries, and that if it was not for London, the UK would be alongside Greece in its economic performance.

A very grave set of statistics, which perhaps show why the British Pound showed the biggest decline of any major currency over the past few days despite all of Europe and the United States also having conducted interest rate rises.

VIEW FULL ANALYSIS VISIT - FXOpen Blog...

Disclaimer: This Forecast represents FXOpen Companies opinion only, it should not be construed as an offer, invitation or recommendation in respect to FXOpen Companies products and services or as Financial Advice.
 
After a long decline, Tesla leads the charge as EV stocks are back in vogue
img-091.png


The past few months have demonstrated that, like most extremely high profile phases and fads, the euphoria surrounding the world’s sudden focus on electric vehicles after over 120 years of celebrating the internal combustion engine faded, and with that, down went the massively inflated stock prices of some of their manufacturers.

Tesla was the disrupting influence that suddenly appeared from Silicon Valley just over 10 years ago with a roadster based on the Lotus Elise which very few people can remember, before suddenly heading onto the streets with its first ever sedan, the Model S, which in 2014 took the world by storm largely because it looked and drove like a normal luxury car, but was fully electric.

Before this, there had been some electric car prototypes by mainstream car manufacturers, and one or two that had gone to market, only to be met with derision and criticism, and were largely viewed as extremely unfashionable examples of social awkwardness on wheels.

Tesla changed all that, and since then has changed quite a lot of other aspects of how technology firms do business - it is the first publicly listed company to become a cryptocurrency whale for example, and did so without any concern or objection from shareholders or the exchange it is listed on.

This year, however, the extreme faddishness which has surrounded electric vehicles to the extent that almost every mainstream manufacturer has spent the past three years rallying to introduce new electric models when they had no intention of doing so prior to the Tesla era, and marketing campaigns everywhere from the internet to billboards are depicting the very latest electric car from almost everywhere across the globe, has faded.

Tesla stock, listed on the NASDAQ exchange, has been depreciating like a 1970s Lancia after a winter in Manchester, and some newcomers to the electric vehicle market, set up as new companies over the past few years and which only produce electric vehicles, have been following the declining trend that Tesla has experienced.

Perhaps it was inevitable, as some of them, total newcomers to the automotive industry and without a credible product, had raised billions of dollars via Special Purchase Acquisition Company (SPAC) listings on NASDAQ, meaning that they could bypass the usual levels of due diligence required to list on a public exchange and simply raise billions without, in some cases, even delivering a single product.

In this arena of newcomers to the auto industry, Tesla remains the stalwart and its stock has started to rebound.

Tesla stock was up a considerable 4.78% at the close of the US trading session yesterday, and some of the less well known electric vehicle producers are also experiencing a resurgence in values.

Currently analysts are looking at Rivian, the electric truck manufacturer, North American luxury electric car brand Lucid and Polestar, Volvo’s performance electric car division.

Tesla stock has been rising from the doldrums over the past month, and is a remarkable 62% higher than it was 30 days ago, showing that whilst the world has got used to Tesla models now that they are no longer a novelty and are utterly ubiquitous, and even have been subject to some degree of criticism for being bland or less of a quality product than the established luxury brands, there is still a degree of interest in Elon Musk and his forward thinking ideology.

Unlike other car brands which tend to toe the conservative line, Tesla is the product of Elon Musk, who is well known for edge-of-the-seat commercial decisions and for the public not knowing what he will do next!

VIEW FULL ANALYSIS VISIT - FXOpen Blog...

Disclaimer: This Forecast represents FXOpen Companies opinion only, it should not be construed as an offer, invitation or recommendation in respect to FXOpen Companies products and services or as Financial Advice.
 
BTCUSD and XRPUSD Technical Analysis – 07th FEB 2023
btc.png


BTCUSD – Bullish Harami Pattern Above $22658

Bitcoin continues its bullish momentum from last week and after touching a low of $22658 on 07th Feb, the prices started to correct upwards against the US Dollar and are now ranging above the $23000 handle in the European trading session today.

The price is back over the Pivot point in the daily timeframe indicating bullish trends.

We can clearly see a bullish Harami pattern above the $22658 handle which is a bullish reversal pattern because it signifies the end of a downtrend and a shift towards an uptrend.

Bitcoin touched an intraday low of 22658 in the Asian trading session and an intraday high of 23037 in the European trading session today.

The momentum indicator is back over zero in the 4-hourly timeframe indicating a bullish scenario.

The MACD indicator is giving a bullish divergence signal in the 1-hourly timeframe.

Both the STOCH and STOCHRSI are indicating overbought levels which means that in the immediate short-term a decline in the prices is expected.

The RSI indicator is back over 50 in both the 30-minutes and 1-hourly timeframe indicating bullish trends.

Relative strength index is at 58.15 indicating a strong demand for Bitcoin, and the continuation of the buying pressure in the markets.

Bitcoin is now moving below its 100 hourly Simple Moving average and below its 100 hourly Exponential Moving averages.

Most of the major technical indicators are giving a BUY signal, which means that in the immediate shor-term we are expecting targets of 23500 and 24500.

Average true range is indicating less market volatility with a mild bullish momentum.

  • Bitcoin bullish continuation seen above $22658.
  • The Williams percent range is indicating an overbought level.
  • The price is now trading just above its Pivot levels of $22887.
  • Short-term range is mild bullish.

Bitcoin Bullish Continuation Seen Above $22658
btcx.png


The prices of Bitcoin witnessed a downwards correction after crossing the $24000 levels. Now the markets are ranging into a consolidation channel above the $22500 handle.

After the consolidation phase is over, we are expecting upside moves in the range of $23500 to $24500 levels.

We can see the formation of a bullish price crossover pattern with the Adaptive Moving average AMA20 in both the 30-minutes and 1-hourly timeframes.

The immediate short-term outlook for Bitcoin is mild bullish, medium-term outlook has turned as bullish, and the long-term outlook remains neutral under present market conditions.

Bitcoin support zone is located at $22342 which is a 14-3 Day Raw Stochastic at 50% and at $22581 which is a 3-10 Day MACD Oscillator Stalls.

The price of BTCUSD is now facing its classic resistance levels of 23053 and Fibonacci resistance levels of 23352 after which the path towards 23500 will get cleared.

In the last 24hrs BTCUSD has increased by 0.84% by 190.97$ and has a 24hr trading volume of USD 24.800 Billion. We can see an increase of 13.07% in the trading volume as compared to yesterday, which appears to be normal.

The Week Ahead

Bitcoin has reached its highest levels this month at $24209 which was last seen on 20th Aug, 2022. We are now looking to cross the $25000 levels this month.

Daily RSI is printing at 62.55 which indicates a very strong demand for Bitcoin and the continuation of the bullish phase present in the markets in the short-term range.

We can see the formation of a bullish trendline from $22658 towards the $24118 levels.

The prices of BTCUSD are now facing its resistance zone located at $23406 which is a 14-Day RSI at 70% and at $23594 at which the price crosses 9-Day Moving Average Stalls.

Weekly outlook is projected at $25000 with a consolidation zone of $24000.

Technical Indicators:

Moving Averages Convergence Divergence (12,26): It is at 2.60 indicating a BUY.

Ultimate Oscillator: It is at 57.18 indicating a BUY.

Rate of Price Change: It is at 0.226 indicating a BUY.

Bull/Bear Power (13): It is at 175.73 indicating a BUY.

VIEW FULL ANALYSIS VISIT - FXOpen Blog...

Disclaimer: This Forecast represents FXOpen Companies opinion only, it should not be construed as an offer, invitation or recommendation in respect to FXOpen Companies products and services or as Financial Advice.
 
Back
Top