FXOpen Trader
Private, 1st Class
- Messages
- 31
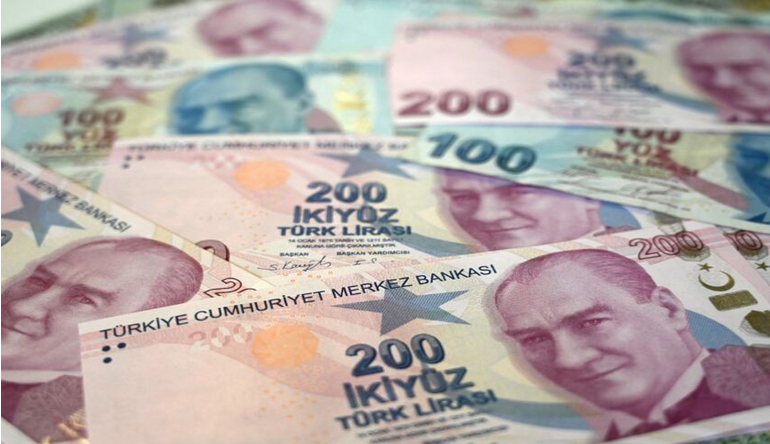
Turkish Lira crisis lingers with sustained record low against USD
The Turkish economy is a highly diversified one.
Its industry base is by far the most developed in the Middle East, almost resembling European nations with its highly advanced telecommunications, tourism, vehicle manufacturing, computer science, fintech, clothing and consumer white goods sectors.
It’s an industrious society and has been improving tremendously over the years in its modernity.
The main obstacle faced by Turkish businesses and households in recent times has been directly connected to the country’s clearly diversified but somehow troubled economy.
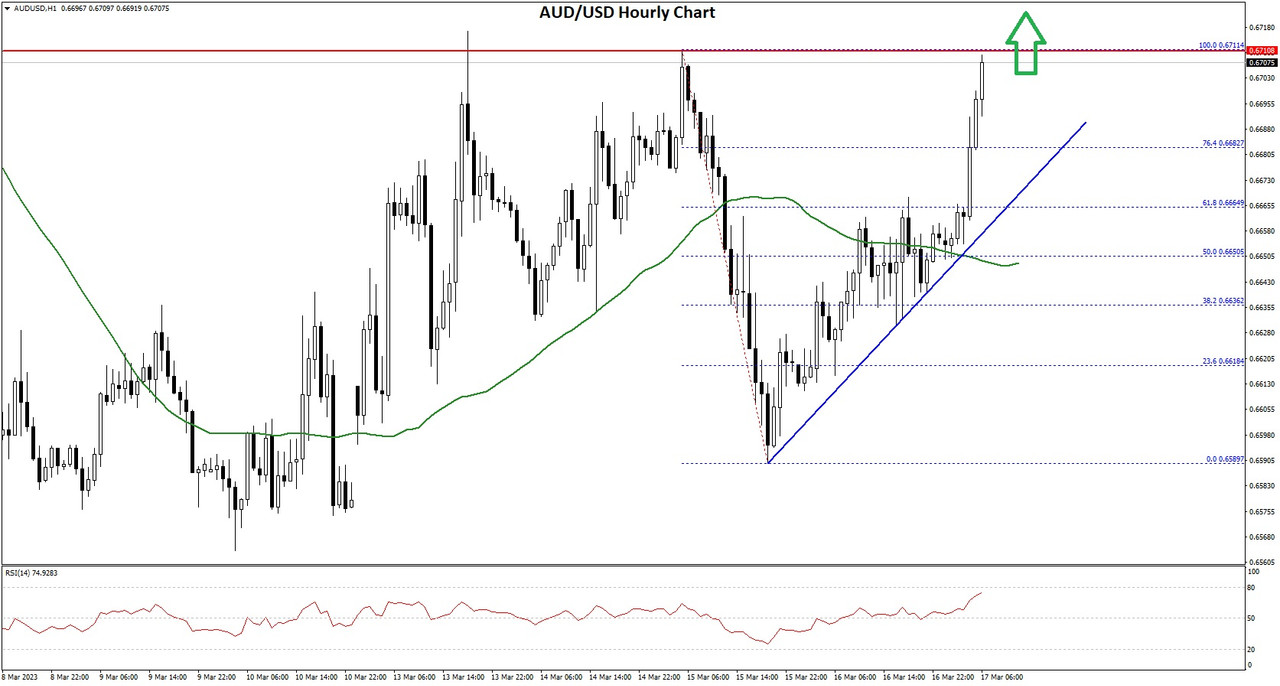
Over the past two days, the Turkish Lira has plummeted even further to the extent that it is now at an all-time low against the US Dollar and other major currencies.
Today, the Turkish Lira is trading at 18.97 against the US Dollar, a value far lower than any time in history.
Presidential and parliamentary elections scheduled for May 14 are adding to uncertainty, although they are still some two months away. Overall, there is a concern over the possible continuation of current President Tayyip Erdogan's controversial policies which have led to a rapidly depreciating currency and an eye-watering 70% inflation figure, or if monetary policy could perhaps revert to orthodoxy as promised by the opposition should the opposition become elected.
Added to the long-existing fiscal malaise in Turkey, global economists are now looking at the economic impact of the disastrous earthquakes that hit Turkey last month.
The depreciation to new record lows has occurred despite the recent deposit of $5 billion into the Turkish central bank by the Saudi Fund for Development, which was cited at the time to be "a demonstration of the Kingdom of Saudi Arabia’s commitment to supporting Turkey’s efforts to strengthen its economy’.
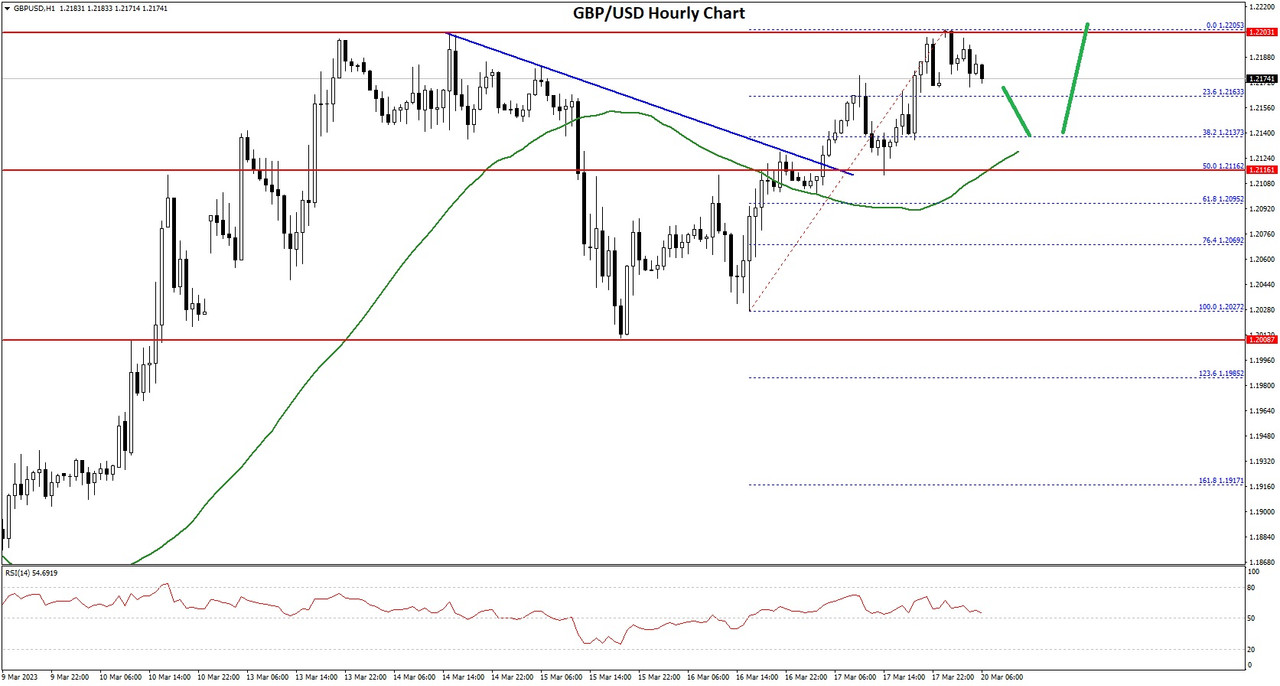
Rather astonishingly, The Turkish Lira has depreciated over the past five years against the British Pound by a staggering 300%, demonstrating that its instability has dented the Turkish economy, but has encouraged British tourists to visit the country even more than they already do - and Turkey is one of the most popular vacation destinations for British tourists.
Also, on the subject of tourism, Turkey has welcomed tens of thousands of tourists from Russia over the past year, as its neutrality has been a boon for business.
Whilst it is good that the tourist industry is booming, the depreciation of revenues from tourist business remains a hard metric to swallow in that 70% inflation has done a lot to wipe out a large proportion of revenue.
Turkey's workforce continues to be industrious and is not showing signs of giving up, so it is an economic region to watch closely.
VIEW FULL ANALYSIS VISIT - FXOpen Blog...
Disclaimer: This Forecast represents FXOpen Companies opinion only, it should not be construed as an offer, invitation or recommendation in respect to FXOpen Companies products and services or as Financial Advice.
The Turkish economy is a highly diversified one.
Its industry base is by far the most developed in the Middle East, almost resembling European nations with its highly advanced telecommunications, tourism, vehicle manufacturing, computer science, fintech, clothing and consumer white goods sectors.
It’s an industrious society and has been improving tremendously over the years in its modernity.
The main obstacle faced by Turkish businesses and households in recent times has been directly connected to the country’s clearly diversified but somehow troubled economy.
Over the past two days, the Turkish Lira has plummeted even further to the extent that it is now at an all-time low against the US Dollar and other major currencies.
Today, the Turkish Lira is trading at 18.97 against the US Dollar, a value far lower than any time in history.
Presidential and parliamentary elections scheduled for May 14 are adding to uncertainty, although they are still some two months away. Overall, there is a concern over the possible continuation of current President Tayyip Erdogan's controversial policies which have led to a rapidly depreciating currency and an eye-watering 70% inflation figure, or if monetary policy could perhaps revert to orthodoxy as promised by the opposition should the opposition become elected.
Added to the long-existing fiscal malaise in Turkey, global economists are now looking at the economic impact of the disastrous earthquakes that hit Turkey last month.
The depreciation to new record lows has occurred despite the recent deposit of $5 billion into the Turkish central bank by the Saudi Fund for Development, which was cited at the time to be "a demonstration of the Kingdom of Saudi Arabia’s commitment to supporting Turkey’s efforts to strengthen its economy’.
Rather astonishingly, The Turkish Lira has depreciated over the past five years against the British Pound by a staggering 300%, demonstrating that its instability has dented the Turkish economy, but has encouraged British tourists to visit the country even more than they already do - and Turkey is one of the most popular vacation destinations for British tourists.
Also, on the subject of tourism, Turkey has welcomed tens of thousands of tourists from Russia over the past year, as its neutrality has been a boon for business.
Whilst it is good that the tourist industry is booming, the depreciation of revenues from tourist business remains a hard metric to swallow in that 70% inflation has done a lot to wipe out a large proportion of revenue.
Turkey's workforce continues to be industrious and is not showing signs of giving up, so it is an economic region to watch closely.
VIEW FULL ANALYSIS VISIT - FXOpen Blog...
Disclaimer: This Forecast represents FXOpen Companies opinion only, it should not be construed as an offer, invitation or recommendation in respect to FXOpen Companies products and services or as Financial Advice.