FXOpen Trader
Private, 1st Class
- Messages
- 31
BTCUSD and XRPUSD Technical Analysis – 13th SEP 2022

BTCUSD: Inverted Hammer Pattern Above $19025
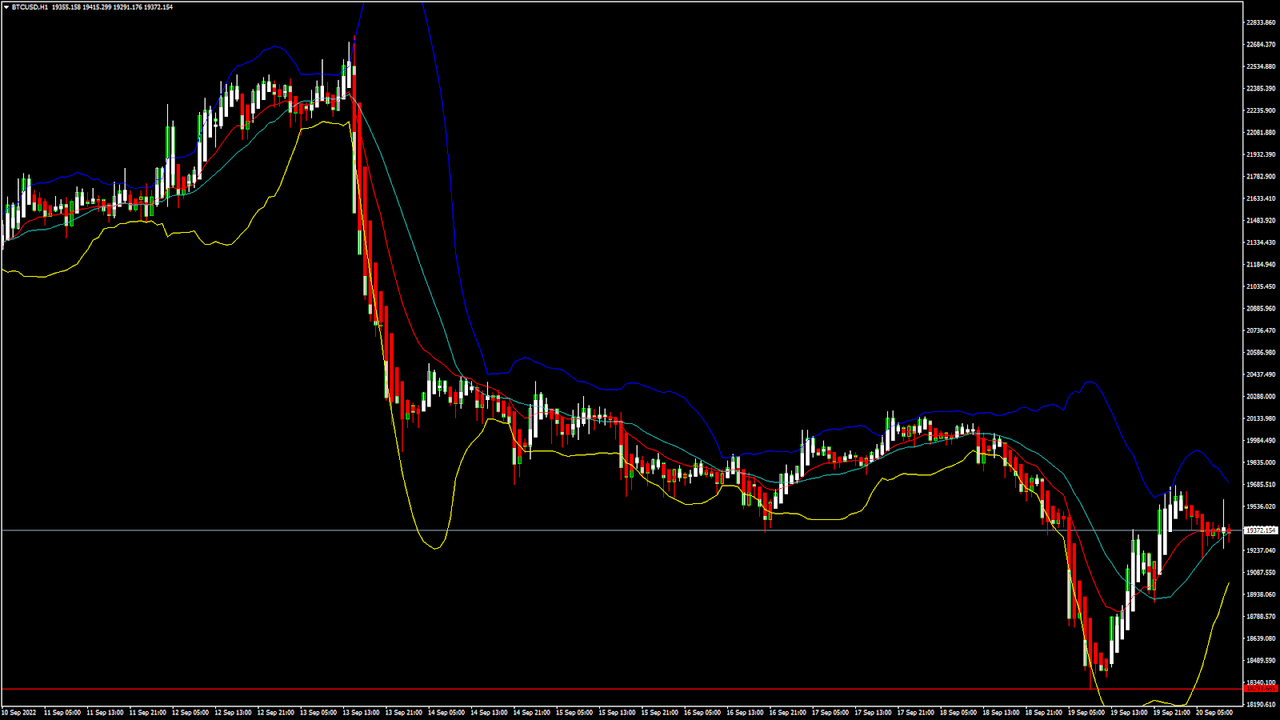
Bitcoin was unable to sustain its bearish momentum and after touching a low of 18567 on 07th Sep, it started to correct upwards crossing the $22000 handle today in the European trading session.
The price of Bitcoin continues to correct upwards due to the increased buying pressure and more upsides are expected towards the $25000 levels.
We can see a bullish price crossover with the adaptive moving average AMA50 in the 15-minute time frame.
We have also seen a bullish opening gap underpinning the markets this week.
We can clearly see an inverted hammer pattern above the $19025 handle which is a bullish reversal pattern because it signifies the end of a downtrend and a shift towards an uptrend.
Bitcoin touched an intraday low of 22067 in the Asian trading session and an intraday high of 22553 in the European trading session today.
Both the STOCH and Williams percent range are indicating overbought levels which means that in the immediate short term a decline in the prices is expected.
The relative strength index is at 71 indicating a very strong demand for bitcoin at the current market levels and the continuation of the buying pressure in the markets.
Bitcoin is now moving above its 100 hourly simple moving average and below its 200 hourly exponential moving averages.
All of the major technical Indicators are giving a STRONG BUY signal, which means that in the immediate short term we are expecting targets of 24000 and 25000.
The average true range is indicating LESS market volatility with a strong bullish momentum.
Bitcoin: Bullish reversal seen above $19025
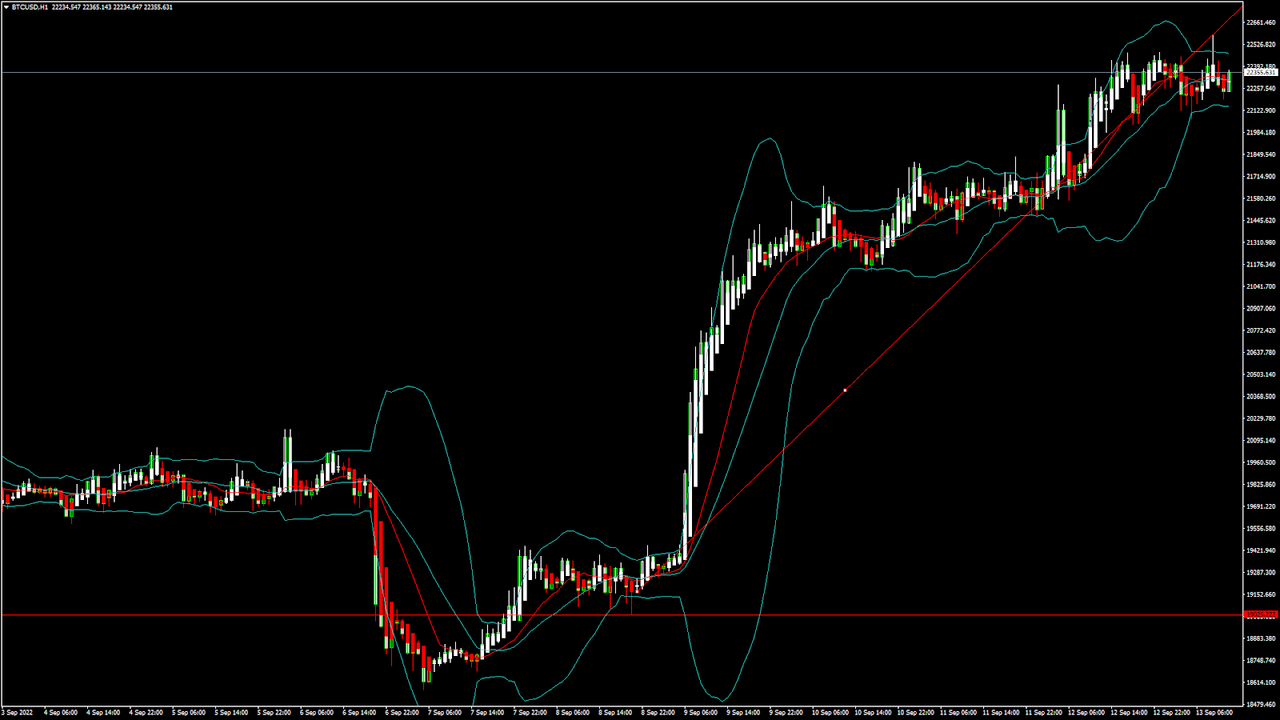
The price of bitcoin is forming an ascending channel, with the current price action indicating a move towards the consolidation phase above the $22000 handle.
We can see the formation of a bullish harami pattern in the 2-hourly time-frame indicating the underlying bullish nature of the markets.
We have also detected the formation of a bullish engulfing line in the 1-hourly time frame indicating the bullish scenario.
The immediate short-term outlook for bitcoin is bullish, the medium-term outlook has turned neutral, and the long-term outlook remains neutral under present market conditions.
Bitcoin’s support zone is located at $21000 and the price continues to remain above these levels for the continuation of the bullish reversal in the markets.
The price of BTCUSD is now facing its classic resistance level of 22502 and Fibonacci resistance level of 22731 after which the path towards 23000 will get cleared.
In the last 24hrs BTCUSD has increased by 0.95% by 211$ and has a 24hr trading volume of USD 43.846 billion. We can see a decrease of 2.98% in the trading volume as compared to yesterday, which appears to be normal.
The Week Ahead
The price of bitcoin is moving in a consolidation zone above the $22000 levels. At present the price is moving into a narrow range between the 22000 and 22500 levels.
We can see that the price of bitcoin is super bullish and we are heading towards the $30000 handle in the medium term range.
The daily RSI is printing at 61 which indicates a very strong demand from the long-term investors.
The price of BTCUSD will need to remain above the important support levels of $21000 this week.
The weekly outlook is projected at $25000 with a consolidation zone of $24500.
Technical Indicators:
The moving averages convergence divergence (12, 26): is at 564.30 indicating a BUY.
The ultimate oscillator: is at 57.64 indicating a BUY.
The rate of price change: is at 5.34 indicating a BUY.
The commodity channel index (14): is at 105.75 indicating a BUY.
VIEW FULL ANALYSIS VISIT - FXOpen Blog...
BTCUSD: Inverted Hammer Pattern Above $19025
Bitcoin was unable to sustain its bearish momentum and after touching a low of 18567 on 07th Sep, it started to correct upwards crossing the $22000 handle today in the European trading session.
The price of Bitcoin continues to correct upwards due to the increased buying pressure and more upsides are expected towards the $25000 levels.
We can see a bullish price crossover with the adaptive moving average AMA50 in the 15-minute time frame.
We have also seen a bullish opening gap underpinning the markets this week.
We can clearly see an inverted hammer pattern above the $19025 handle which is a bullish reversal pattern because it signifies the end of a downtrend and a shift towards an uptrend.
Bitcoin touched an intraday low of 22067 in the Asian trading session and an intraday high of 22553 in the European trading session today.
Both the STOCH and Williams percent range are indicating overbought levels which means that in the immediate short term a decline in the prices is expected.
The relative strength index is at 71 indicating a very strong demand for bitcoin at the current market levels and the continuation of the buying pressure in the markets.
Bitcoin is now moving above its 100 hourly simple moving average and below its 200 hourly exponential moving averages.
All of the major technical Indicators are giving a STRONG BUY signal, which means that in the immediate short term we are expecting targets of 24000 and 25000.
The average true range is indicating LESS market volatility with a strong bullish momentum.
- Bitcoin: bullish reversal seen above $19025.
- STOCHRSI is indicating an oversold level.
- The price is now trading just above its pivot level of $22332.
- All of the moving averages are giving a STRONG BUY market signal.
Bitcoin: Bullish reversal seen above $19025
The price of bitcoin is forming an ascending channel, with the current price action indicating a move towards the consolidation phase above the $22000 handle.
We can see the formation of a bullish harami pattern in the 2-hourly time-frame indicating the underlying bullish nature of the markets.
We have also detected the formation of a bullish engulfing line in the 1-hourly time frame indicating the bullish scenario.
The immediate short-term outlook for bitcoin is bullish, the medium-term outlook has turned neutral, and the long-term outlook remains neutral under present market conditions.
Bitcoin’s support zone is located at $21000 and the price continues to remain above these levels for the continuation of the bullish reversal in the markets.
The price of BTCUSD is now facing its classic resistance level of 22502 and Fibonacci resistance level of 22731 after which the path towards 23000 will get cleared.
In the last 24hrs BTCUSD has increased by 0.95% by 211$ and has a 24hr trading volume of USD 43.846 billion. We can see a decrease of 2.98% in the trading volume as compared to yesterday, which appears to be normal.
The Week Ahead
The price of bitcoin is moving in a consolidation zone above the $22000 levels. At present the price is moving into a narrow range between the 22000 and 22500 levels.
We can see that the price of bitcoin is super bullish and we are heading towards the $30000 handle in the medium term range.
The daily RSI is printing at 61 which indicates a very strong demand from the long-term investors.
The price of BTCUSD will need to remain above the important support levels of $21000 this week.
The weekly outlook is projected at $25000 with a consolidation zone of $24500.
Technical Indicators:
The moving averages convergence divergence (12, 26): is at 564.30 indicating a BUY.
The ultimate oscillator: is at 57.64 indicating a BUY.
The rate of price change: is at 5.34 indicating a BUY.
The commodity channel index (14): is at 105.75 indicating a BUY.
VIEW FULL ANALYSIS VISIT - FXOpen Blog...