Daily Review 17/12/2009

Messages
0
USD Dollar (USD)


The Dollar gained massively across the board on the day the Federal Reserve decided to leave rates as expected at 0.25%. The Dollar rose after the announcement and continued its gaining after Asia markets opened. Earlier, the Building Permits came out 0.58M better than expected 0.57M. CPI came out unchanged as expected at 0.4%. Wall Street finished mix after being unable to hold in the positive side. Stocks turned to the negative after the statement of the FED about monetary policy. The Dow Jones fell 0.10% and NASDAQ rose by 0.28%. Crude Oil kept gaining for the second day closing at 72.77$ a barrel after the oil inventories showed a 3.7M drop. Gold (XAU) gained also closing at 1137$ an ounce. Today, the Initial Jobless Claims expected at 470K vs. 474K previously. The Philadelphia Fed Manufacturing Index expected at 16 vs. 16.7 previously.

EURO (EUR)


The Euro fell against the Dollar and the Pound, breaking through the 1.4500 and 1.4400 support levels, after the CPI came out 0.5% worse than expected 0.6%. The breakdown of this level could bring the pair to fresh new lows. Manufacturing PMI came out 51.6 better than expected 51.5. Overall, EUR/USD traded with a low of 1.4379 and a high of 1.4590. Today, the Italian Unemployment Rate expected 7.7% vs. 7.4% previously.

EUR/USD - Last: 1.4410

Resistance 1.4500 1.4600 1.4675
EURUSD.PNG


British Pound (GBP)


The Cable was the best performer among majors. GBP/USD momentarily broke above 1.6370 and rose to 1.6404, reaching a one-week high but then pulled back, breaking below the 1.6300 support level, reaching lows of 1.6230. Claimant Count Change came out -6.3K better than the expected 14K. Overall, GBP/USD traded with a low of 1.6230 and a high of 1.6409. Today, the Retail Sales expected at 0.5% vs. 0.4% previously. The CBI DTS expected at 16 vs. 13 previously.

GBP/USD - Last: 1.6275

Resistance 1.6425 1.6475 1.6525
Support 1.6275 1.6210 1.6170
GBPUSD.PNG


Japanese Yen (JPY)


The Yen fell against the Pound and the Dollar. The Dollar reached a one-week high against the Yen as the Federal Reserve said deterioration in the labor market is abating while it will keep its low rate for an extended period. Overall, USD/JPY traded with a low of 89.37 and a high of 89.96. Today, the interest rate decision of The Bank of Japan (BOJ) expected unchanged at 0.1%.

USD/JPY-Last: 89.65

Resistance 89.95 90.40 90.75
Support 89.30 88.75 88.35
JPYUSD.PNG


Canadian Dollar (CAD)


The Canadian currency gained as crude oil and stocks rose. It was little changed after policy makers in the nation and the U.S. made commitments to keep interest rates at historic lows. The Manufacturing Sales came out 2% better than expected 0.5%. Overall, USD/CAD traded with a low of 1.0570 and a high of 1.0641. Today, The Core CPI expected unchanged at 0.1%. The Foreign Securities Purchases expected at 10B vs. 13.59B previously.

USD/CAD - Last: 1.0615

Resistance 1.0640 1.0670 1.0700
Support 1.0570 1.0550 1.0515
CADUSD.PNG


UFX Bank Research
 
Daily: The USD/CAD continues to climb in this recent environment of risk aversion and news of China's tightening of regulations which subdued any strength in commodities and thus commodity currencies such as the CAD, AUD, and NZD.

The daily time-frame shows the market struggling to reach the previous top at 1.075. The 1.07 is holding as resistance so far in three attemps this week.

The market may be starting a bullish run in the USD/CAD, but a significant correction would help with timing and could further confirm the bullish mode.

Weekly: The weekly time-frame shows that the 1.10-1.11 area is an important resistance. So if the markey breaks the 1.075 area, this may be the next resistance.

This is also an important area as it may coincide with the 200 and 50 MAs in the Weekly time-frame. We will see then if the current rally is a major correction, or whether a long-term rally is starting to take off.[Written by CMS Forex]

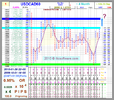
"P&F USDCAD1440 Box Size 225X3 or(5.37%) CLOSE
Data 1.5972 - 0.9161 ~ 92 Month ~ 2810 Day
Database 2000 records 1.0703 (Last Close)
2002-05-21 00~00
2010-01-29 00~00
(GMT+01:00) Paris
BJF Trading Group chart"

1.5975|~225||________________________________________________|-0.02%|74.38%
1.5750|~45O||x_______________________________________________|1.39%|71.92%
1.5525|~675||x_o_____________________________________________|2.8%|69.47%
1.5300|~9OO||x_o_____________________________________________|4.21%|67.01%
1.5075|~1125|__o_____________________________________________|5.62%|64.56%
1.4850|~135O|__o_____________________________________________|7.02%|62.1%
1.4625|~1575|__o_____________________________________________|8.43%|59.64%
1.4400|~18OO|__o_____________________________________________|9.84%|57.19%
1.4175|~2O25|__o_____________________________________________|11.25%|54.73%
1.3950|~225O|__o_x___x_______________________________________|12.66%|52.28%
1.3725|~2475|__o_x_o_x_o_____________________________________|14.07%|49.82%
1.3500|~27OO|__o_x_o_x_o_____________________________________|15.48%|47.36%
1.3275|~2925|__o___o_x_o_____________________________________|16.89%|44.91%
1.3050|~315O|______o_x_o_____________________________________|18.29%|42.45%
1.2825|~3375|______o_x_o_____________x___x_______x___________|19.7%|40%
1.2600|~36OO|______o___o_x___________x_o_x_o_x___x_o_________|21.11%|37.54%
1.2375|~3825|__________o_x_o_________x_o_x_o_x_o_x_o_________|22.52%|35.08%
1.2150|~4O5O|__________o_x_o_________x_o_x_o_x_o_x_o_________|23.93%|32.63%
1.1925|~4275|__________o_x_o_________x_o_x_o_x_o___o_________|25.34%|30.17%
1.1700|~45OO|__________o___o_x_______x_o_x_o_______o_________|26.75%|27.72%
1.1475|~4725|______________o_x_o_____x_o___________o_x_______|28.16%|25.26%
1.1250|~495O|______________o_x_o_____x_____________o_x_o_____|29.56%|22.8%
1.1025|~5175|______________o_x_o_____x_____________o_x_o_____|30.97%|20.35%
1.0800|~54OO|==============o===o=====x=============o===o=x===|32.38%|17.89%
1.0575|~5625|__________________o_____x_________________o_x_o_|33.79%|15.43%
1.0350|~585O|__________________o_x___x_________________o_x_o_|35.2%|12.98%
1.0125|~6O75|==================o=x=o=x=================o===o=|36.61%|10.52%
0.9900|~63OO|__________________o_x_o_x_______________________|38.02%|8.07%
0.9675|~6525|__________________o_x_o_________________________|39.43%|5.61%
0.9450|~675O|__________________o_x___________________________|40.83%|3.15%
0.9225|~6975|__________________o_x___________________________|42.24%|0.7%
0.9000|~72OO|__________________o_____________________________|43.65%|-1.76%
Column|||||||3_113_6_6_104_8_4_126_3_146_6_5_4_3_4_9_3_6_3_3_|
Count
 

Attachments

  • USDCAD0130.PNG
    USDCAD0130.PNG
    148.2 KB · Views: 13
  • BJF-Trading-Group_Excel_Chart-USDCAD0130.zip
    23 KB · Views: 1
GBP/USD closed higher due to short covering on Tuesday signalling a possible end to the two-day bounce off the 50% retracement level of the 2008-2009-rally crossing. The mid-range close sets the stage for a steady opening on Wednesday. Stochastics and the RSI are diverging but are turning neutral to bearish hinting that additional weakness is possible. If it extends the decline off January's high, the 62% retracement level of 2009's rally crossing is the next downside target. Closes above the 20-day moving average crossing are needed to confirm that a short-term low has been posted.[Written by HY Markets]

"P&F GBPUSD1440 Box Size 250X3 or(4.33%) HI/LO
Data 2.1161 - 1.3502 ~ 92 Month ~ 2799 Day
Database 2000 records 1.54478 (Last Close)
2002-06-27 00~00
2010-02-24 00~00
(GMT+01:00) Paris
BJF Trading Group chart"

2.1250|~25O||_____________________________________|-0.42%|57.38%
2.1000|~5OO||_________________X___________________|0.76%|55.53%
2.0750|~75O||_________________Xo__________________|1.94%|53.68%
2.0500|~1OOO|_______________X_Xo__________________|3.12%|51.83%
2.0250|~125O|_______________XoXoX_________________|4.31%|49.98%
2.0000|~15OO|_______________XoXoXo________________|5.49%|48.13%
1.9750|~175O|_______________Xo_oXo________________|6.67%|46.27%
1.9500|~2OOO|_________X_____X__o_o________________|7.85%|44.42%
1.9250|~225O|_________Xo____X____o________________|9.03%|42.57%
1.9000|~25OO|_____X___Xo__X_X____o________________|10.21%|40.72%
1.8750|~275O|_____XoX_Xo__XoX____o________________|11.39%|38.87%
1.8500|~3OOO|_____XoXoXo__XoX____oX_______________|12.58%|37.02%
1.8250|~325O|_____XoXoXoX_Xo_____oXo______________|13.76%|35.17%
1.8000|~35OO|_____XoXoXoXoX______oXo______________|14.94%|33.31%
1.7750|~375O|_____XoXo_oXoX______oXo______________|16.12%|31.46%
1.7500|~4OOO|_____Xo___o_oX______o_o______________|17.3%|29.61%
1.7250|~425O|_____X______o_________o______________|18.48%|27.76%
1.7000|~45OO|=====X================o==========X===|19.66%|25.91%
1.6750|~475O|___X_X________________o__________XoX_|20.84%|24.06%
1.6500|~5OOO|_X_XoX________________oX_________XoXo|22.03%|22.2%
1.6250|~525O|_XoXoX________________oXo________XoXo|23.21%|20.35%
1.6000|~55OO|_XoXoX________________oXo________XoXo|24.39%|18.5%
1.5750|~575O|oXoXo_________________oXo________Xo_o|25.57%|16.65%
1.5500|~6OOO|oXo===================o=oX=X=====X==o|26.75%|14.8%
1.5250|~625O|o_______________________oXoXoX___X___|27.93%|12.95%
1.5000|~65OO|________________________oXoXoXo__X___|29.11%|11.09%
1.4750|~675O|________________________o_oXoXoX_X___|30.3%|9.24%
1.4500|~7OOO|__________________________o_o_oXoX___|31.48%|7.39%
1.4250|~725O|______________________________oXoX___|32.66%|5.54%
1.4000|~75OO|______________________________oXoX___|33.84%|3.69%
1.3750|~775O|______________________________o_o____|35.02%|1.84%
1.3500|~8OOO|_____________________________________|36.2%|-0.01%
Column|||||||3545416547834739356314147344436441545|
Count||||||||_____3______________1_2__________3___|


BJF-Trading-Group_Excel_Chart

 
EUR/USD is in a downtrend, after peaking at 1.5146 (Nov.25,2009). Technical indicators are neutral, and trading is situated below the 50- and 200-Day SMA, currently projected at 1.4793 and 1.4169.
Yesterday's break below 1.3550 cleared the road for another test at 1.3342-60 support area. The failure of that test shows, that the pair is still in the consolidation pattern below 1.3696. We continue to expect a break below 1.3442, which will mark the end of the prolonged corrective phase and will target directly 1.3231, en route to 1.3061.

"P&F EURUSD1440 Box Size 2250X3 or(5.26%) HI/LO
Data 1.5997 - 0.9663 ~ 92 Month ~ 2787 Day
Database 2000 records 1.3567 (Last Close)
2002-07-15 00~00
2010-03-02 00~00 (GMT+01:00) Paris
BJF Trading Group chart"

1.5975|~225||________________x_____o_x_______________________|0.14%|65.32%
1.5750|~45O||____________x_o_x_o_x_o_x_o_____________________|1.54%|62.99%
1.5525|~675||____________x_o_x_o_x_____o_____________________|2.95%|60.66%
1.5300|~9OO||____________x_____o_______o_____________________|4.36%|58.34%
1.5075|~1125|____________x_____________o_________________x___|5.76%|56.01%
1.4850|~135O|____________x_____________o_x_______________x_o_|7.17%|53.68%
1.4625|~1575|____________x_____________o_x_o_____x_______x_o_|8.58%|51.35%
1.4400|~18OO|____________x_____________o_x_o_____x_o_____x_o_|9.98%|49.02%
1.4175|~2O25|____________x_____________o_x_o_____x_o_____x_o_|11.39%|46.69%
1.3950|~225O|____________x_____________o___o_____x_o_____x_o_|12.8%|44.37%
1.3725|~2475|____________x_________________o_____x_o_x___x_o_|14.2%|42.04%
1.3500|~27OO|________x___x_________________o_____x_o_x_o_x_o_|15.61%|39.71%
1.3275|~2925|________x_o_x_________________o_x___x_o_x_o_x___|17.02%|37.38%
1.3050|~315O|________x_o_x_________________o_x_o_x_o_x_o_____|18.42%|35.05%
1.2825|~3375|____x___x_o_x_________________o_x_o_x_o_x_______|19.83%|32.72%
1.2600|~36OO|____x_o_x_o_x_________________o_x_o___o_________|21.24%|30.39%
1.2375|~3825|____x_o_x_o_x_________________o_________________|22.64%|28.07%
1.2150|~4O5O|____x_o_x_o_x___________________________________|24.05%|25.74%
1.1925|~4275|x___x_o___o_x___________________________________|25.45%|23.41%
1.1700|~45OO|x_o_x_____o_____________________________________|26.86%|21.08%
1.1475|~4725|x_o_x___________________________________________|28.27%|18.75%
1.1250|~495O|x_o_x___________________________________________|29.67%|16.42%
1.1025|~5175|x_o_x___________________________________________|31.08%|14.1%
1.0800|~54OO|x_o_____________________________________________|32.49%|11.77%
1.0575|~5625|x_______________________________________________|33.89%|9.44%
1.0350|~585O|x_______________________________________________|35.3%|7.11%
1.0125|~6O75|x_______________________________________________|36.71%|4.78%
0.9900|~63OO|x_______________________________________________|38.11%|2.45%
0.9675|~6525|________________________________________________|39.52%|0.12%
0.9450|~675O|________________________________________________|40.93%|-2.2%
Column|||||||105_9_4_7_8_182_3_3_2_2_2_9_4_114_3_9_9_5_3_9_7_|
Count


BJF-Trading-Group_Excel_Chart
 
EUR/USD's corrective rise from 1.3266 might still be in progress but we'd continue to anticipate strong resistance at 1.3570 to conclude the correction and bring fall resumption. Below 1.3384 will flip intraday bias back to the downside for retesting 1.3266 first. However, note that decisive break of 1.3570 will indicate that the five wave sequence from 1.5143 is completed and stronger rebound should then be seen to 1.3817 resistance and above.

"P&F EURUSD1440 Box Size 200X3 or(4.68%) HI/LO
Data 1.6038 - 0.9607 ~ 92 Month ~ 2796 Day
Database 2000 records 1.35043 (Last Close)
2002-08-05 00~00
2010-04-01 00~00 (GMT+01:00) Paris
BJF Trading Group chart"

1.6200|~2OO||______________________________________________|-1.01%|68.63%
1.6000|~4OO||__________________x___x_______________________|0.24%|66.55%
1.5800|~6OO||__________________x_o_x_o_____________________|1.48%|64.46%
1.5600|~8OO||__________________x_o_x_o_____________________|2.73%|62.38%
1.5400|~1OOO|__________________x_o___o_____________________|3.98%|60.3%
1.5200|~12OO|__________________x_____o_____________________|5.23%|58.22%
1.5000|~14OO|__________________x_____o_________________x___|6.47%|56.14%
1.4800|~16OO|__________________x_____o_x_______________x_o_|7.72%|54.05%
1.4600|~18OO|__________________x_____o_x_o_____x_______x_o_|8.97%|51.97%
1.4400|~2OOO|__________________x_____o_x_o_____x_o_____x_o_|10.21%|49.89%
1.4200|~22OO|__________________x_____o_x_o_____x_o_____x_o_|11.46%|47.81%
1.4000|~24OO|__________________x_____o___o_____x_o_____x_o_|12.71%|45.73%
1.3800|~26OO|__________________x_________o_____x_o_____x_o_|13.95%|43.65%
1.3600|~28OO|__________x_______x_________o_____x_o_x___x_o_|15.2%|41.56%
1.3400|~3OOO|__________x_o_x___x_________o_____x_o_x_o_x_o_|16.45%|39.48%
1.3200|~32OO|__________x_o_x_o_x_________o_x___x_o_x_o_x___|17.7%|37.4%
1.3000|~34OO|__________x_o_x_o_x_________o_x_o_x_o_x_o_____|18.94%|35.32%
1.2800|~36OO|______x___x_o___o_x_________o_x_o_x_o_x_______|20.19%|33.24%
1.2600|~38OO|______x_o_x_____o_x_________o_x_o_x_o_________|21.44%|31.15%
1.2400|~4OOO|______x_o_x_____o_x_________o___o_____________|22.68%|29.07%
1.2200|~42OO|______x_o_x_____o_x___________________________|23.93%|26.99%
1.2000|~44OO|______x_o_x_____o_x___________________________|25.18%|24.91%
1.1800|~46OO|__x___x_o_______o_____________________________|26.42%|22.83%
1.1600|~48OO|__x_o_x_______________________________________|27.67%|20.75%
1.1400|~5OOO|__x_o_x_______________________________________|28.92%|18.66%
1.1200|~52OO|__x_o_x_______________________________________|30.17%|16.58%
1.1000|~54OO|__x_o_x_______________________________________|31.41%|14.5%
1.0800|~56OO|__x_o_________________________________________|32.66%|12.42%
1.0600|~58OO|__x___________________________________________|33.91%|10.34%
1.0400|~6OOO|__x___________________________________________|35.15%|8.25%
1.0200|~62OO|__x___________________________________________|36.4%|6.17%
1.0000|~64OO|o_x___________________________________________|37.65%|4.09%
0.9800|~66OO|o_x___________________________________________|38.9%|2.01%
0.9600|~68OO|______________________________________________|40.14%|-0.07%
Column|||||||2_1_5_1_5_9_4_3_8_2_3_3_1_4_1_4_4_1_1_5_3_1_8_|
Count||||||||__1___0___________1_____0___2_____1_0_____0___|


BJF-Trading-Group_Excel_Chart
 
The short term picture remains positive as the pair continues its strong upward movement. So far the rise is limited by the resistance at 94.70, which is 38.2% FIbo retracement of the 110.64-84.71 drop, and if broken successfully next targets will be the resistances at 96.80 and 97.70, which is 50.0% Fibo retracement of the mentioned drop. On the downside, support is seen at 93.80, followed by 91.80 and 90.20.

"P&F USDJPY1440 Box Size 130X4 or(4.94%) HI/LO
Data 125.75 - 84.819 ~ 92 Month ~ 2800 Day
Database 2000 records 94.031 (Last Close)
2002-08-06 00~00
2010-04-06 00~00 (GMT+01:00) Paris
BJF Trading Group chart"

126.1|~13O||_________________________________|-0.28%|48.67%
124.8|~26O||XoX______________________________|0.76%|47.14%
123.5|~39O||XoXo________X____________________|1.79%|45.6%
122.2|~52O||XoXo________Xo___________________|2.82%|44.07%
120.9|~65O||XoXo____X_X_Xo___________________|3.86%|42.54%
119.6|~78O||Xo_o____XoXoXo___________________|4.89%|41.01%
118.3|~91O||X__o____XoXoXo___________________|5.92%|39.47%
117.0|~1O4O|___o____XoXoXoX__________________|6.96%|37.94%
115.7|~117O|___o____XoXo_oXo_________________|7.99%|36.41%
114.4|~13OO|___o__X_XoX__oXoX________________|9.03%|34.88%
113.1|~143O|___o__XoXoX__oXoXo_______________|10.06%|33.34%
111.8|~156O|___oX_XoXoX__o_oXo_______________|11.09%|31.81%
110.5|~169O|___oXoXoXoX____oXoX______________|12.13%|30.28%
109.2|~182O|___oXoXoXo_____oXoXo_____________|13.16%|28.74%
107.9|~195O|___oXoXoX______o_oXo_____________|14.19%|27.21%
106.6|~2O8O|___oXoXoX________oXo_____________|15.23%|25.68%
105.3|~221O|___o_oXoX________oXo_____________|16.26%|24.15%
104.0|~234O|_____o_oX________oXo_____________|17.3%|22.61%
102.7|~247O|_______o_________oXo_____________|18.33%|21.08%
101.4|~26OO|=================oXo======X======|19.36%|19.55%
100.1|~273O|_________________oXoX_____Xo_____|20.4%|18.02%
98.80|~286O|_________________oXoXo__X_Xo_____|21.43%|16.48%
97.50|~299O|_________________oXoXo__XoXoX____|22.47%|14.95%
96.20|~312O|_________________o_oXo__XoXoXo___|23.5%|13.42%
94.90|~325O|___________________oXo__XoXoXo___|24.53%|11.89%
93.60|~338O|===================oXoX=Xo=oXoX=X|25.57%|10.35%
92.30|~351O|___________________oXoXoX__o_oXoX|26.6%|8.82%
91.00|~364O|___________________o_oXoX____oXoX|27.63%|7.29%
89.70|~377O|_____________________oXoX____oXoX|28.67%|5.75%
88.40|~39OO|_____________________o_o_____oXo_|29.7%|4.22%
87.10|~4O3O|_____________________________oX__|30.74%|2.69%
85.80|~416O|=============================o===|31.77%|1.16%
84.50|~429O|_________________________________|32.8%|-0.38%
Column||||||654156891994694751117944846749644|
Count|||||||___5____4________415_____________|


BJF-Trading-Group_Excel_Chart
 
The underlying MT direction is bearish while the daily bias is bearish. Therefore the main risk is lower. Ensure that key resistances levels hold. Note key support levels that would suggest continuation of the bearish move. Consider confirming this with a bearish set up pattern in price or important that you consider either bullish or bearish set up patterns in indicators or lower time frame charts to support S&R breaks.

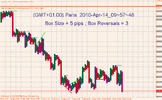
"P&F USDCAD15 Box Size 10X4 or(0.39%) HI/LO
Data 1.0302 - 0.9977 ~ 1 Month ~ 29.05 Day
Database 2000 records 0.99813 (Last Close)
2010-03-16 08~45
2010-04-14 10~00 (GMT+01:00) Paris
BJF Trading Group chart"

1.0300|~1O|||___________X___________________|0.02%|3.24%
1.0290|~2O|||___________Xo__________________|0.12%|3.14%
1.0280|~3O|||_________X_Xo__________________|0.21%|3.04%
1.0270|~4O|||_________XoXo__________________|0.31%|2.94%
1.0260|~5O|||_________XoXo__________________|0.41%|2.84%
1.0250|~6O|||_________XoXo__________________|0.5%|2.74%
1.0240|~7O|||_____X___XoXo__________________|0.6%|2.64%
1.0230|~8O|||_____Xo__XoXo__________________|0.7%|2.54%
1.0220|~9O|||_____XoX_XoXoX_________________|0.8%|2.44%
1.0210|~1OO||_____XoXoXoXoXoX_______________|0.89%|2.34%
1.0200|~11O||_____XoXoXoXoXoXo______________|0.99%|2.24%
1.0190|~12O||_____XoXoXoXoXoXoX_____________|1.09%|2.13%
1.0180|~13O||o__X_XoXoXoXo_oXoXo____________|1.18%|2.03%
1.0170|~14O||o__XoXo_oXo___oXoXo____________|1.28%|1.93%
1.0160|~15O||o__XoX__o_____o_oXo____________|1.38%|1.83%
1.0150|~16O||o__XoX__________oX4____________|1.48%|1.73%
1.0140|~17O||o__XoX__________oXo____________|1.57%|1.63%
1.0130|~18O||oX_XoX__________o_o____________|1.67%|1.53%
1.0120|~19O||oXoXoX____________oX___________|1.77%|1.43%
1.0110|~2OO||oXoXoX____________oXo__________|1.86%|1.33%
1.0100|~21O||oXoXoX____________oXoX_________|1.96%|1.23%
1.0090|~22O||oXo_oX____________oXoXo________|2.06%|1.13%
1.0080|~23O||oX__oX____________oXoXoX___X___|2.15%|1.03%
1.0070|~24O||o___o_____________o_oXoXoX_Xo__|2.25%|0.93%
1.0060|~25O||____________________oXoXoXoXoX_|2.35%|0.83%
1.0050|~26O||____________________oXoXoXoXoXo|2.45%|0.73%
1.0040|~27O||____________________oXoXoXoXoXo|2.54%|0.63%
1.0030|~28O||____________________oXoXo_oXoXo|2.64%|0.53%
1.0020|~29O||____________________oXoX__o_oXo|2.74%|0.43%
1.0010|~3OO||____________________oXoX____o_o|2.83%|0.33%
1.0000|~31O||____________________oXo_______o|2.93%|0.23%
0.9990|~32O||____________________oX________o|3.03%|0.13%
0.9980|~33O||____________________o__________|3.13%|0.03%
0.9970|~34O||_______________________________|3.22%|-0.07%
Column|||||||1649117561111465861511185456757|
Count||||||||2___17___2132_____2_42O________|


Full-size image archive.....
 

Attachments

  • bjf-trading-group-usdcad_0414-2.gif
    bjf-trading-group-usdcad_0414-2.gif
    28 KB · Views: 11
  • UsdCad_0414.zip
    979.3 KB · Views: 0
  • BJF-Trading-Group-UsdCad_0414_(1).PNG
    BJF-Trading-Group-UsdCad_0414_(1).PNG
    39.3 KB · Views: 10
What's In Store for the EUR and the USD Next Week?
At the end of a volatile trading week which has seen a turmoil in Greek bonds and has culminated with a formal request from Greece for financial aid from the EU and IMF, I explore the important economic events for the week ahead and ponder what they may bring for the EUR and the USD, I examine this morning's EUR strengthening and analyze the latest trend developments with the EUR/USD, EUR/JPY and EUR/GBP currency pairs, I note the bullish breakout of the USD vs. JPY, I examine the weakness of the GBP and CAD after series of disappointing economic reports from the U.K. and Canada.
This is my forecast!

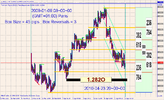
"P&F EURUSD1440 Box Size 200X3 or(4.68%) HI/LO
Data 1.6038 - 0.9607 ~ 92 Month ~ 2796 Day
Database 2000 records 1.33811 (Last Close)
2002-08-27 00~00
2010-04-23 00~00 (GMT+01:00) Paris
BJF Trading Group chart"

1.6200|~2OO||____________________________________________|-1.01%|68.63%
1.6000|~4OO||________________x___x_______________________|0.24%|66.55%
1.5800|~6OO||________________x_o_x_o_____________________|1.48%|64.46%
1.5600|~8OO||________________x_o_x_o_____________________|2.73%|62.38%
1.5400|~1OOO|________________x_o___o_____________________|3.98%|60.3%
1.5200|~12OO|________________x_____o_____________________|5.23%|58.22%
1.5000|~14OO|================x=====o=================x===|6.47%|56.14%
1.4800|~16OO|________________x_____o_x_______________x_o_|7.72%|54.05%
1.4600|~18OO|________________x_____o_x_o_____x_______x_o_|8.97%|51.97%
1.4400|~2OOO|________________x_____o_x_o_____x_o_____x_o_|10.21%|49.89%
1.4200|~22OO|________________x_____o_x_o_____x_o_____x_o_|11.46%|47.81%
1.4000|~24OO|________________x_____o___o_____x_o_____x_o_|12.71%|45.73%
1.3800|~26OO|________________x_________o_____x_o_____x_o_|13.95%|43.65%
1.3600|~28OO|________x_______x_________o_____x_o_x___x_o_|15.2%|41.56%
1.3400|~3OOO|========x=o=x===x=========o=====x=o=x=o=x=o=|16.45%|39.48%
1.3200|~32OO|________x_o_x_o_x_________o_x___x_o_x_o_x___|17.7%|37.4%
1.3000|~34OO|________x_o_x_o_x_________o_x_o_x_o_x_o_____|18.94%|35.32%
1.2800|~36OO|____x___x_o___o_x_________o_x_o_x_o_x_______|20.19%|33.24%
1.2600|~38OO|____x_o_x_____o_x_________o_x_o_x_o_________|21.44%|31.15%
1.2400|~4OOO|====x=o=x=====o=x=========o===o=============|22.68%|29.07%
1.2200|~42OO|____x_o_x_____o_x___________________________|23.93%|26.99%
1.2000|~44OO|____x_o_x_____o_x___________________________|25.18%|24.91%
1.1800|~46OO|x___x_o_______o_____________________________|26.42%|22.83%
1.1600|~48OO|x_o_x_______________________________________|27.67%|20.75%
1.1400|~5OOO|x_o_x_______________________________________|28.92%|18.66%
1.1200|~52OO|x_o_x_______________________________________|30.17%|16.58%
1.1000|~54OO|x_o_x_______________________________________|31.41%|14.5%
1.0800|~56OO|x_o_________________________________________|32.66%|12.42%
1.0600|~58OO|x___________________________________________|33.91%|10.34%
1.0400|~6OOO|x___________________________________________|35.15%|8.25%
1.0200|~62OO|x___________________________________________|36.4%|6.17%
1.0000|~64OO|x___________________________________________|37.65%|4.09%
0.9800|~66OO|x___________________________________________|38.9%|2.01%
0.9600|~68OO|____________________________________________|40.14%|-0.07%
Column|||||||1_5_1_5_9_4_3_8_2_3_3_1_4_1_4_4_1_1_5_3_1_8_|
Count|~||||||1___O___________1_____O___2_____1_O_____O___|


Attachments

  • BJF-Trading-Group-EurUsd_0424-2.pdf
    573.4 KB · Views: 2
  • BJF-Trading-Group-EurUsd_0424-MT.PNG
    BJF-Trading-Group-EurUsd_0424-MT.PNG
    82.6 KB · Views: 11
  • BJF-Trading-Group-EurUsd_0424.zip
    295 KB · Views: 1
Last edited:
The pound reversed below the new support level at $1.53, warning of a bull trap.
Expect another test of $1.48.
Recovery above $1.53, however, would signal a rally to $1.60, confirmed if the declining trendline is broken.

"P&F GBPUSD1440 Box Size 250X3 or(4.33%) HI/LO
Data 2.1161 - 1.3502 ~ 91 Month ~ 2797 Day
Database 2000 records 1.52649 (Last Close)
2002-09-02 00~00
2010-04-30 00~00 (GMT+01:00) Paris
BJF Trading Group chart"


BJF-Trading-Group_Excel_Chart
 
USDJPY is currently trading 94.70 levels. A break above 94.30(2 days close), we could target 97-98 levels. Weekly close above 92 levels has increased chances for a bearish move for the yen currency. Importers hold for medium term covers. (USDJPY- 94.70). Long Term (3-6 months) target 98 and higher.We just need a conistent break of 94.30 to make thes happen.

"P&F USDJPY1440 Box Size 140X4 or(5.32%) HI/LO
Data 125.75 - 84.819 ~ 92 Month ~ 2800 Day
Database 2000 records 94.26 (Last Close)
2002-09-04 00~00
2010-05-05 00~00 (GMT+01:00) Paris
BJF Trading Group chart"

126.00|~14O||_____________________________|-0.2%|48.55%
124.60|~28O||XoX__________________________|0.91%|46.9%
123.20|~42O||XoXo________X________________|2.03%|45.25%
121.80|~56O||XoXo______X_Xo_______________|3.14%|43.6%
120.40|~7OO||Xo_o____X_XoXo_______________|4.25%|41.95%
119.00|~84O||X__o____XoXoXo_______________|5.37%|40.3%
117.60|~98O||___o____XoXoXoX______________|6.48%|38.65%
116.20|~112O|___o____XoXo_oXo_____________|7.59%|37%
114.80|~126O|___o__X_XoX__oXo_____________|8.71%|35.35%
113.40|~14OO|___o__XoXoX__oXoX____________|9.82%|33.7%
112.00|~154O|___oX_XoXoX__o_oXo___________|10.93%|32.05%
110.60|~168O|___oXoXoXoX____oXoX__________|12.05%|30.4%
109.20|~182O|___oXoXoXo_____oXoXo_________|13.16%|28.74%
107.80|~196O|___oXoXoX______o_oXo_________|14.27%|27.09%
106.40|~21OO|___o_oXoX________oXo_________|15.39%|25.44%
105.00|~224O|_____oXoX________oXo_________|16.5%|23.79%
103.60|~238O|_____o_oX________oXo_________|17.61%|22.14%
102.20|~252O|_______o_________oXo_________|18.73%|20.49%
100.80|~266O|=================oXo======X==|19.84%|18.84%
99.40|~28OO||_________________oXoX___X_Xo_|20.95%|17.19%
98.00|~294O||_________________oXoXo__XoXo_|22.07%|15.54%
96.60|~3O8O||_________________o_oXo__XoXo_|23.18%|13.89%
95.20|~322O||___________________oXo__XoXo_|24.29%|12.24%
93.80|~336O||===================oXoX=Xo=oX|25.41%|10.59%
92.40|~35OO||___________________oXoXoX__oX|26.52%|8.94%
91.00|~364O||___________________o_oXoX__oX|27.63%|7.29%
89.60|~378O||_____________________oXoX__oX|28.75%|5.64%
88.20|~392O||_____________________o_o___oX|29.86%|3.99%
86.80|~4O6O||___________________________oX|30.97%|2.34%
85.40|~42OO||===========================o=|32.09%|0.68%
84.00|~434O||_____________________________|33.2%|-0.97%
Column|||||||54314689189458474111684484516|
Count||||||||___3____3________2O4_______1_|


BJF-Trading-Group-UsdJpy_0505_%281%29.PNG
 

Attachments

  • BJF-Trading-Group-UsdJpy_0505.zip
    480.7 KB · Views: 0
Back
Top