Daily Technical Analysis by FxGrow

FxGrow Support

Recruit
Messages
58
Dear Forum Members!

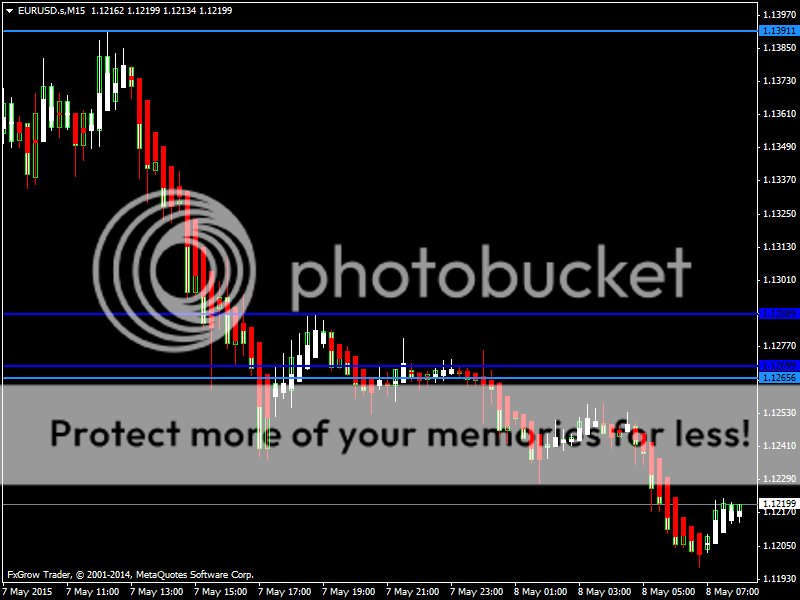
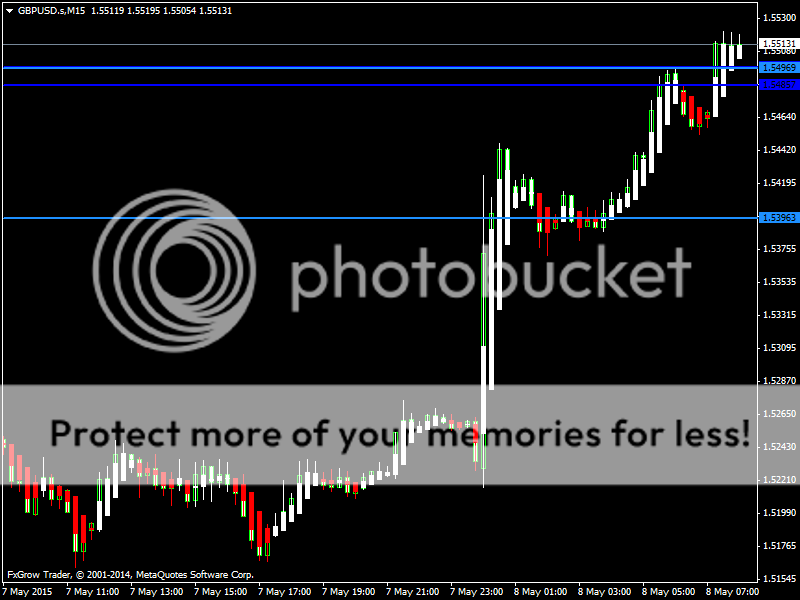
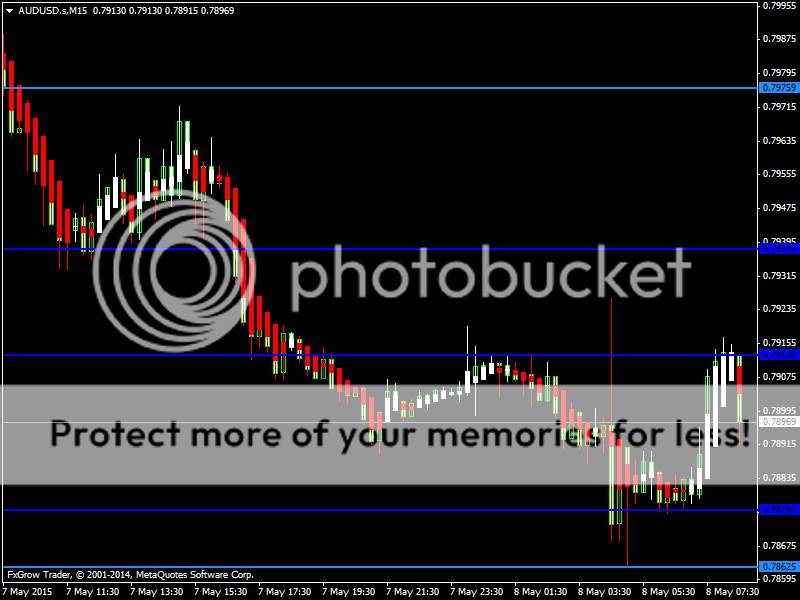
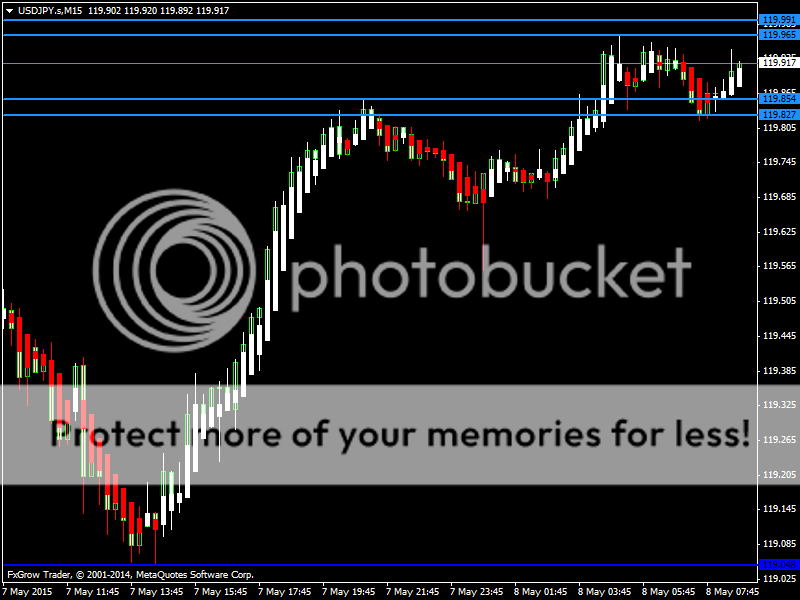
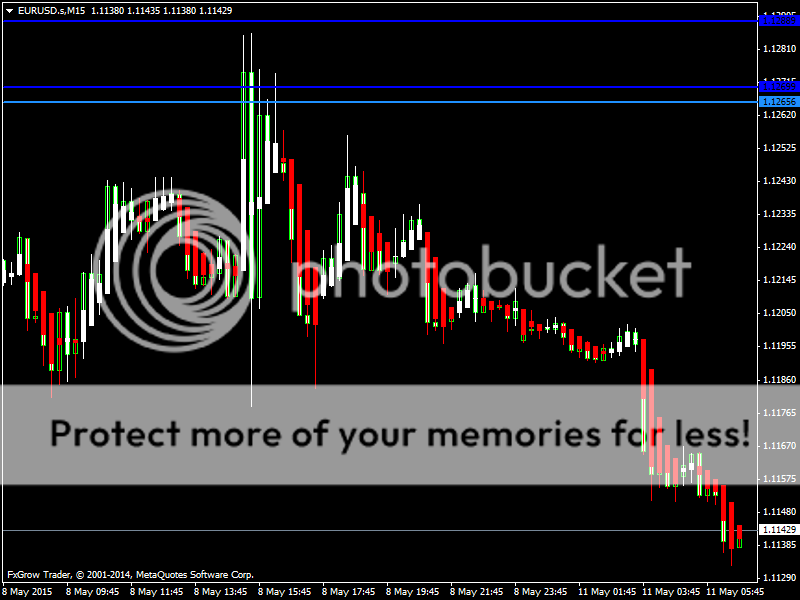
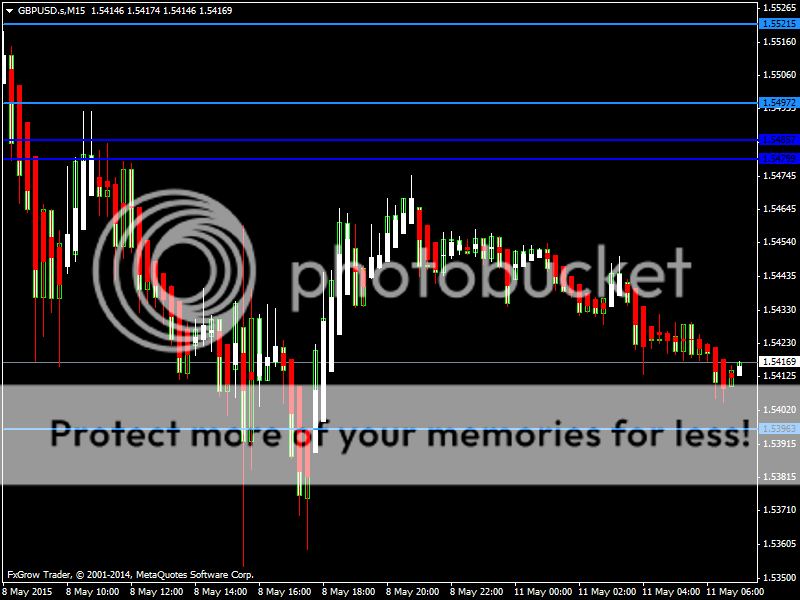
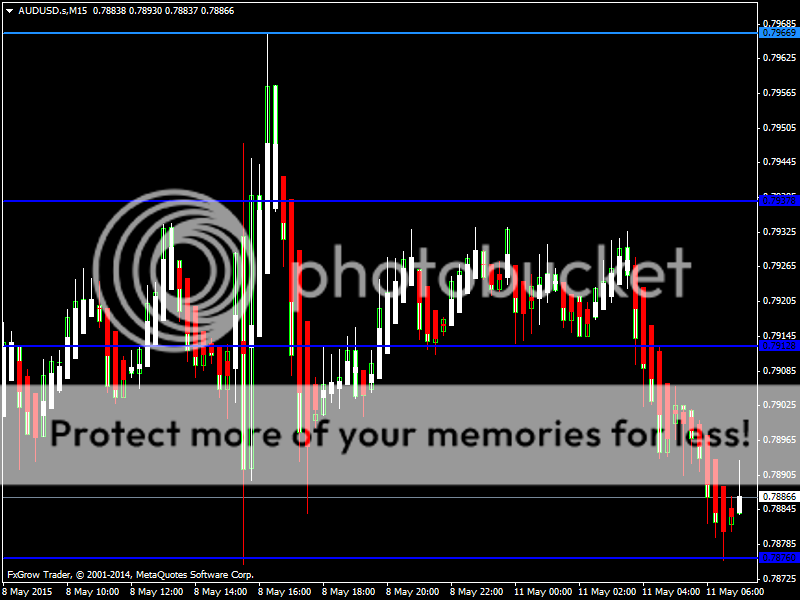
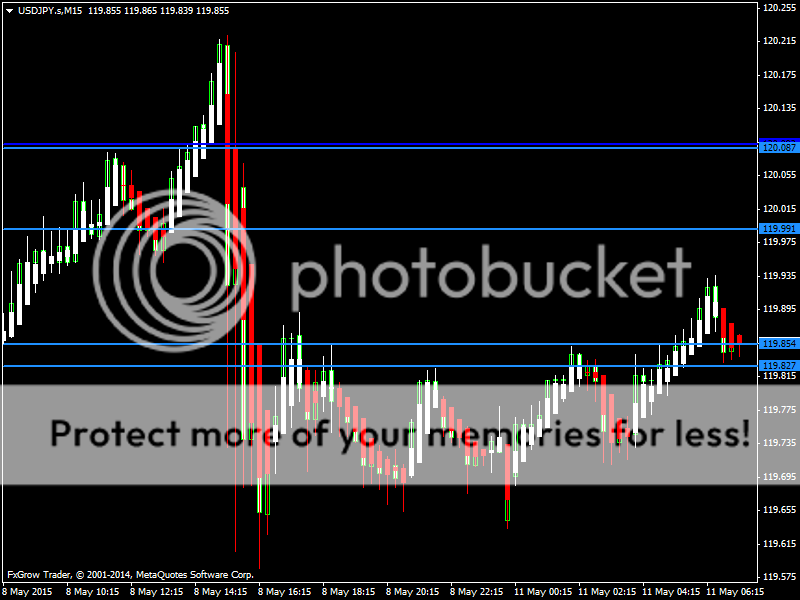
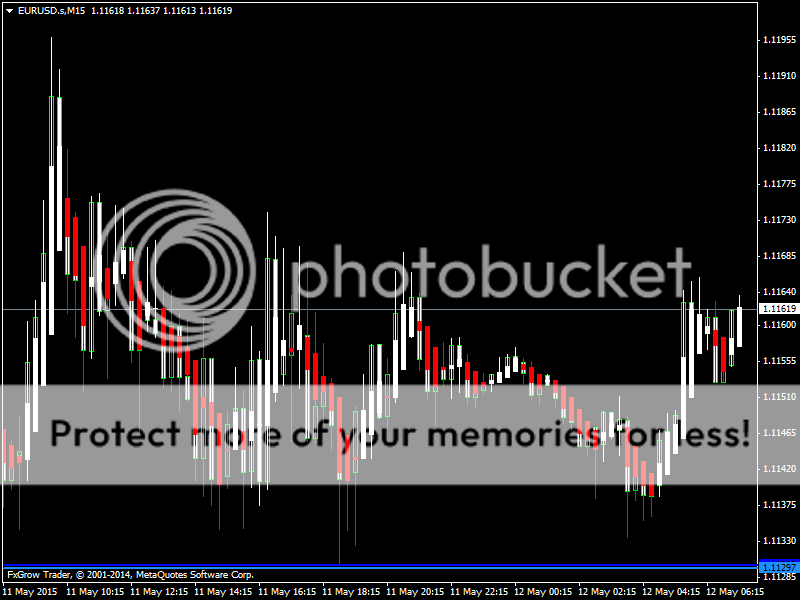
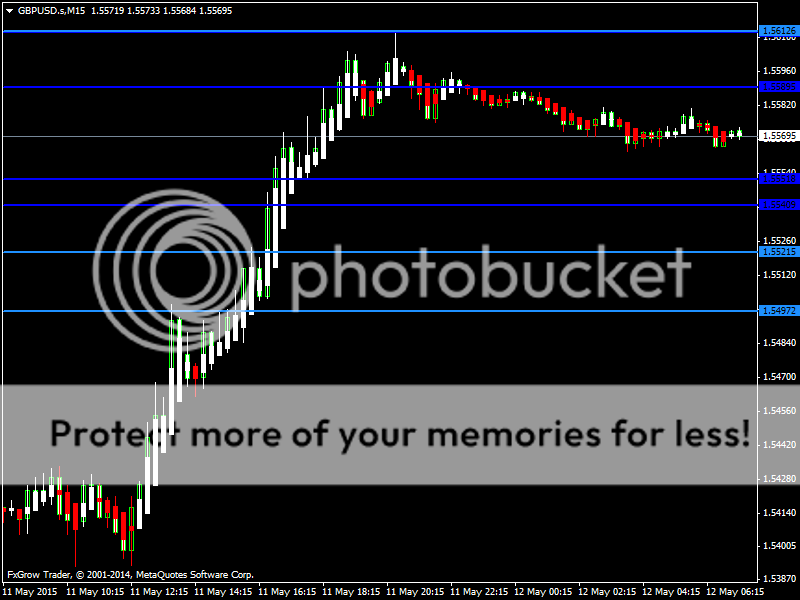
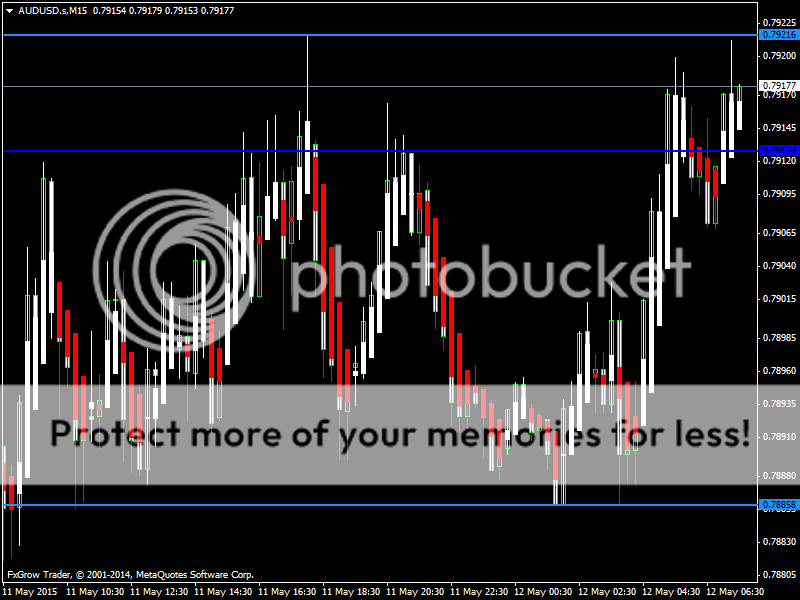
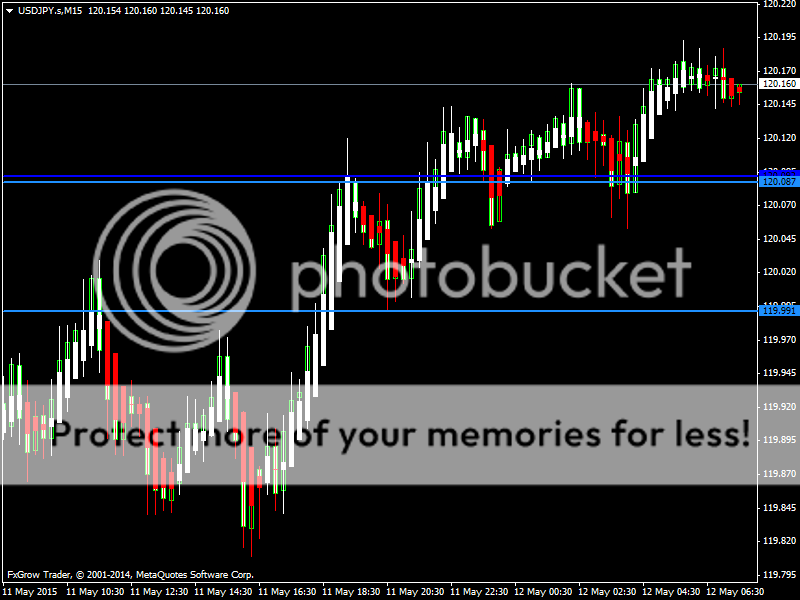
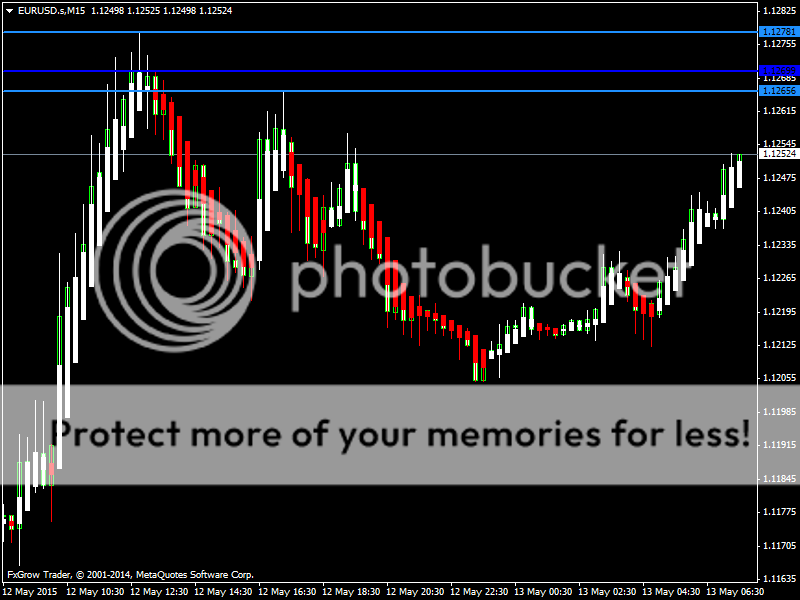
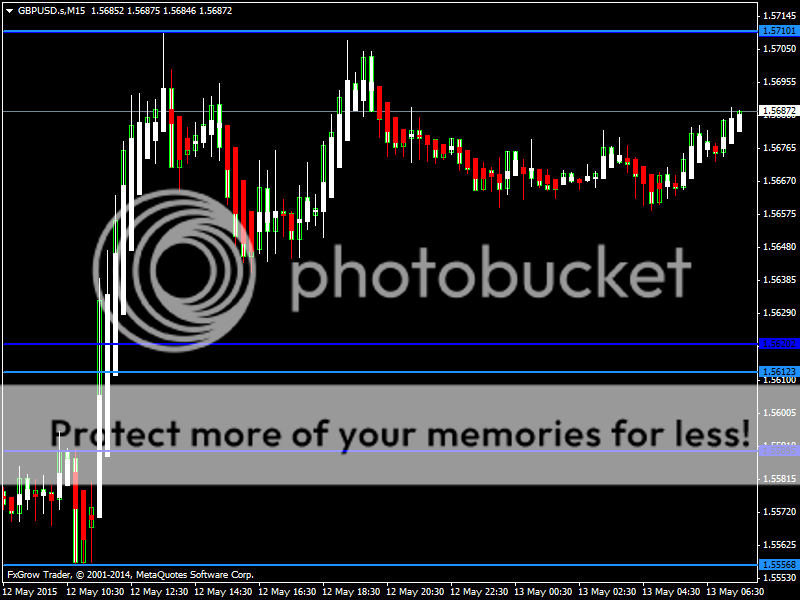
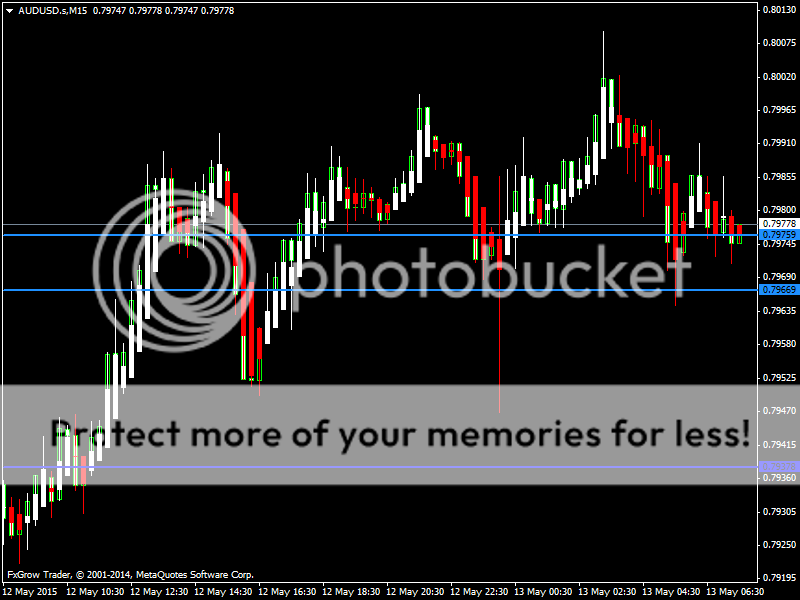
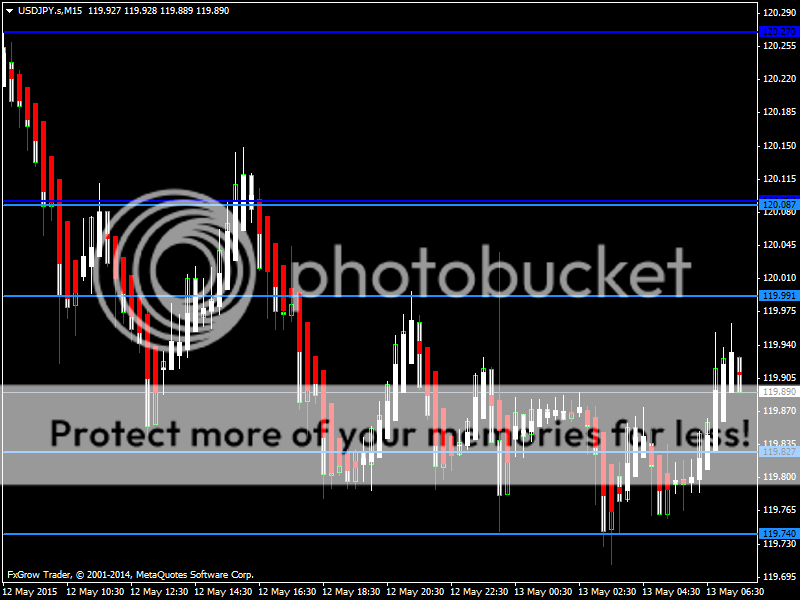
Here you can find Daily Technical Analysis of Major Currencies.

We hope that this information will be helpful for your trading.

Best Regards
FxGrow Support

-------------------------------------------------------------------------------

Terms used in our Analysis

RSI (14) - Relative strength index 14 days Time frame
MACD (12, 26) - Moving Average Convergence Divergence 12 day EMA - 26 day EMA
EMA - Exponential moving average
ADX (14) - Average Directional Index 14 days
ATR (14) - Average True Range 14 days
SMA - Simple Moving Average
MA x - Moving Average where x is the number of days
STOCH RSI (14) - Stochastic RSI 14 days
William %R - Momentum Indicator
CCI(14) - Commodity Channel Index
ROC - Rate of Change

-------------------------------------------------------------------------------
 
Daily Technical Analysis – 08th May, 2015
By FxGrow Research & Analysis Team

EURUSD

EURUSD08may15_zps4aajzcpi.png


EURUSD could not hold on to its bullish trend and came down on profit taking at 1.1220 Near term bias is bearish but overall scenario remains bullish.

RSI (14), ADX (14) and MACD (12, 26) indicate a SELL while Average True Range (14) indicates Less Volatility.

Support is at 1.1197 while Resistance is at 1.1265, 1.1288 and 1.1391


GBPUSD

GBPUSD08may15_zps6aw8doxa.png


GBPUSD continues its strong bullish momentum crossing 1.5480; the short term bias is bullish within range of 1.5500 to 1.5550, and a correction is expected due to profit taking.

RSI (14), MACD (12, 26) and ADX (14) indicate a BUY while ATR (14) indicates High volatility.

Support is at 1.5303 while Resistance is at 1.5497 and 1.5521


Note: This analysis is intended to provide general information and does not constitute the provision of INVESTMENT ADVICE. Investors should, before acting on this information, consider the appropriateness of this information having regard to their personal objectives, financial situation or needs. We recommend investors obtain investment advice specific to their situation before making any financial investment decision.
 
Daily Technical Analysis – 08th May, 2015
By FxGrow Research & Analysis Team

AUDUSD

AUDUSD08may15_zpsl8utlj8c.png


AUDUSD could not hold on to its bullish trend and came down to 0.7900 and remains vulnerable to downside movements with targets of 0.7850 and 0.7800

RSI (14), MACD (12, 26) and MA100 indicate a SELL while STOCH (9, 6) is Neutral and STOCHRSI (14) is overbought. Average True Range (14) indicates Less Volatility.

Support is at 0.7862 and 0.7876 while Resistance is at 0.7937 and 0.7975


USDJPY

USDJPY08may15_zpsvaplci6v.png


USDJPY is higher at 119.90 and the near term bias remains bullish within the range of 120.00 to 120.35, sideways movements are possible in the European trading session.

RSI (14), STOCHRSI (14), ADX (14), CCI (14) and MACD (12, 26) indicate a BUY. STOCH (9, 6) is overbought and ATR (14) indicates less volatility.

Support is at 119.04 while Resistance is at 119.96 and 119.99


Note: This analysis is intended to provide general information and does not constitute the provision of INVESTMENT ADVICE. Investors should, before acting on this information, consider the appropriateness of this information having regard to their personal objectives, financial situation or needs. We recommend investors obtain investment advice specific to their situation before making any financial investment decision.
 
Daily Technical Analysis – 11th May, 2015
By FxGrow Research & Analysis Team

EURUSD

EURUSD11may15_zpsgkmwcyst.png


EURUSD remained sideways with the pair testing 1.1140 in the Asian trading session. Near term bias remains bearish with targets of 1.1040 but overall scenario remains bullish.

RSI (14), ADX (14), ROC and MACD (12, 26) indicate a SELL while Average True Range (14) indicates Less Volatility.

Support is at 1.1136 while Resistance is at 1.1269 and 1.1288

11th May 2015 – 04:03hrs GMT


GBPUSD

GBPUSD11may15_zpsjz461dua.png


GBPUSD maintains its bullish tone still trading above 1.5400 but downside movements are possible due to price action and overall scenario remains bullish.

RSI (14) is Neutral, STOCH (9, 6), ADX (14), CCI (14) indicate a SELL while ATR (14) indicates Less volatility.

Support is at 1.5269, 1.5303 while Resistance is at 1.5497 and 1.5521

11th May 2015 – 04:12hrs GMT


Note: This analysis is intended to provide general information and does not constitute the provision of INVESTMENT ADVICE. Investors should, before acting on this information, consider the appropriateness of this information having regard to their personal objectives, financial situation or needs. We recommend investors obtain investment advice specific to their situation before making any financial investment decision.
 
Daily Technical Analysis – 11th May, 2015
By FxGrow Research & Analysis Team

AUDUSD

AUDUSD11may15_zpsug9kogdz.png


AUDUSD remains in Uptrend at 0.7885 and is expected to consolidate at 0.7850 to 0.7900 in the Asian trading session.

RSI (14), MACD (12, 26), STOCH (9, 6) and MA100 indicate a SELL while STOCHRSI (14) is oversold. Average True Range (14) indicates Less Volatility.

Support is at 0.7860 and 0.7876 while Resistance is at 0.7937 and 0.7966

11th May 2015 – 04:19hrs GMT


USDJPY

USDJPY11may15_zpsignngmd8.png


USDJPY is moving sideways trading below 120.00 in the Asian trading session and the near term bias remains Neutral.

RSI (14) is Neutral; STOCHRSI (14) is overbought; ADX (14), CCI (14) and MACD (12, 26) indicate a BUY while ATR (14) indicates Less volatility.

Support is at 119.70 while Resistance is at 120.08

11th May 2015 – 04:26hrs GMT


Note: This analysis is intended to provide general information and does not constitute the provision of INVESTMENT ADVICE. Investors should, before acting on this information, consider the appropriateness of this information having regard to their personal objectives, financial situation or needs. We recommend investors obtain investment advice specific to their situation before making any financial investment decision.
 
Daily Technical Analysis – 12th May, 2015
By FxGrow Research & Analysis Team

EURUSD

EURUSD12may15_zpsmeh6w7bv.png


EURUSD came below the 10day SMA but pulled back above the support level of 1.1136 in the Asian trading session to reach 1.1160 with the near term bias remaining Neutral.

RSI (14) and STOCH (9, 6) is Neutral; STOCHRSI (14) is overbought; ADX (14) and MACD (12, 26) indicate a SELL while Average True Range (14) indicates Less Volatility.

Support is at 1.1129 while Resistance is at 1.1164 and 1.1176

12th May 2015 – 04:27hrs GMT


GBPUSD

GBPUSD12may15_zpsfst4iyyg.png


GBPUSD continues its bullish tone crossing 1.5600 yesterday. Near-term bias remains bullish to neutral within the range of 1.5620 to 1.5560

RSI (14) and MACD (12, 26) indicate a BUY; STOCH (9, 6) and CCI (14) indicate a SELL while ATR (14) is Neutral.

Support is at 1.5497, 1.5521 while Resistance is at 1.5589 and 1.5612

12th May 2015 – 04:36hrs GMT

For more in depth Research & Analysis please visit FxGrow.

Note: This analysis is intended to provide general information and does not constitute the provision of INVESTMENT ADVICE. Investors should, before acting on this information, consider the appropriateness of this information having regard to their personal objectives, financial situation or needs. We recommend investors obtain investment advice specific to their situation before making any financial investment decision.
 
Daily Technical Analysis – 12th May, 2015
By FxGrow Research & Analysis Team

AUDUSD

AUDUSD12may15_zps7vroraqv.png


AUDUSD remains stable at 0.7926 and the near term bias is bullish with targets of 0.8000; some correction is expected in the European trading session today.

RSI (14), MACD (12, 26) and STOCH (9, 6) indicate a BUY while STOCHRSI (14) is oversold. Average True Range (14) indicates Less Volatility.

Support is at 0.7876 and 0.7885 while Resistance is at 0.7925

12th May 2015 – 04:48hrs GMT


USDJPY

USDJPY12may15_zpsenp08jbi.png


USDJPY maintains its bullish tone with the pair testing 120.16 in the Asian trading session. Near term bias remains bullish within the range of 121.00 to 121.50 but overall scenario remains Neutral.

RSI (14), STOCH (9, 6), ADX (14) and MACD (12, 26) indicate a BUY while ATR (14) indicates less volatility.

Support is at 119.99 while Resistance is at 120.22

12th May 2015 – 04:42hrs GMT

For more in depth Research & Analysis please visit FxGrow.

Note: This analysis is intended to provide general information and does not constitute the provision of INVESTMENT ADVICE. Investors should, before acting on this information, consider the appropriateness of this information having regard to their personal objectives, financial situation or needs. We recommend investors obtain investment advice specific to their situation before making any financial investment decision.
 
Daily Technical Analysis – 13th May, 2015
By FxGrow Research & Analysis Team

EURUSD

EURUSD13may15_zpsdxr0ner6.png


EURUSD tried to regain its bullish trend yesterday but came under selling pressure to close below 1.1220 In the Asian trading session the pair is up at 1.1250 and near term bias is bullish with targets of 1.1280 to 1.1300

RSI (14), MACD (12, 26), ADX (14), CCI (14) and ROC indicate a BUY; STOCH (9, 6) is Neutral; STOCHRSI (14) is overbought; while Average True Range (14) indicates Less Volatility.

Support is at 1.1129 while Resistance is at 1.1269 and 1.1278

13th May 2015 – 04:41hrs GMT


GBPUSD

GBPUSD13may15_zpsg66bal6e.png


GBPUSD had a strong bullish tone yesterday crossing 1.5700 and the near term bias is bullish in the range of 1.5740 to 1.5800

RSI (14), MACD (12, 26), ADX (14) and CCI (14) indicate a BUY; while Average True Range (14) indicates Less Volatility.

Support is at 1.5556, 1.5589 while Resistance is at 1.5710

13th May 2015 – 04:46hrs GMT

For more in depth Research & Analysis please visit FxGrow.

Note: This analysis is intended to provide general information and does not constitute the provision of INVESTMENT ADVICE. Investors should, before acting on this information, consider the appropriateness of this information having regard to their personal objectives, financial situation or needs. We recommend investors obtain investment advice specific to their situation before making any financial investment decision.
 
Daily Technical Analysis – 13th May, 2015
By FxGrow Research & Analysis Team

AUDUSD

AUDUSD13may15_zpsi2jbigwh.png


AUDUSD has started its bullish tone with the pair crossing 0.8000 in the Asian trading session. The near term bias is bullish with targets of 0.8100

RSI (14), MACD (12, 26) and STOCH (9, 6) indicate a BUY while STOCHRSI (14) is oversold. Average True Range (14) indicates Less Volatility.

Support is at 0.79125 and 0.7937 while Resistance is at 0.8006

13th May 2015 – 04:55hrs GMT


USDJPY

USDJPY13may15_zpsfvsnlyo0.png


USDJPY could not sustain its bullish momentum yesterday and came down below 120.00 and is trading at 119.85 in the Asian trading session. The near term bias remains Neutral.

RSI (14), ADX (14) is Neutral, STOCHRSI(14) is overbought; while Average True Range (14) indicates Less Volatility.

Support is at 119.74 while Resistance is at 120.27

13th May 2015 – 04:51hrs GMT

For more in depth Research & Analysis please visit FxGrow.

Note: This analysis is intended to provide general information and does not constitute the provision of INVESTMENT ADVICE. Investors should, before acting on this information, consider the appropriateness of this information having regard to their personal objectives, financial situation or needs. We recommend investors obtain investment advice specific to their situation before making any financial investment decision.
 
Back
Top