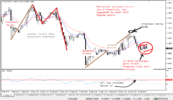
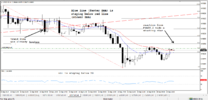
Sold NZDUSD below low of 'recent thrust up'. Price is more likely to erase 'whole swing up' on H1.
Risk: If it moves up and H1 closes above high of 'recent thrust up', the bearish setup will fail.
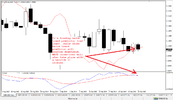
On daily/D1 time-frame:
The trend remain bearish and no longer oversold, so there is enough room for NZD/USD to move down.