IvanGlobalPrime
Company Representative
- Messages
- 36
Hi traders,
Ivan Delgado, Head of Market Research at Global Prime Forex.
I thought I'd open up this new thread so that I will notify the forum whenever new material is available. My only intention is to pass on my knowledge after over a decade trading forex (no fillers, no non-sense).
In this guide, I look at How To Define Your Bias Thru Forex Options
As forex traders, adding further layers of evidence to help you in the makeup of every day’s jigsaw, this time via how options traders are positioning on a day to day basis, can reveal invaluable snippets of information.
After all, market makers in the options market use some of the most sophisticated technologies and models out there to assist them in pricing options as a reflection of the anticipation of market volatility. Therefore, cues obtained via implied volatility but also through the split and variations in Calls/Puts constitutes very valuable information.
Understanding Call & Put Options
Before taking things further, for the less initiated, let’s break down the type of options that exist.
On one hand, we have Call options, which give the right (not the obligation) to execute a buy order of an underlying asset at a specified price (the strike price), during a certain period of time. On the other hands, Put options provide the holder the right to execute a sell order of an underlying asset at a specified price (the strike price), during a certain period of time. Both Calls and Puts can be exercised at any time during the validity of the contract.
The next point is cardinal. If you are an option buyer, your downside is limited to the premium you paid. Therefore, those that are exposed to unlimited risk are option sellers or also referred as the writers, while their upside or potential profit is limited to the Put premium received.
In & Out Of The Money Options
The following terms are critically important as it constitutes the foundation to understand this tutorial. We must differentiate what it means to be ‘in the money’ and ‘out of the money’.
The term itself is quite self-explanatory, but let me provide some examples.
If as the buyer of a Call, the strike price is below the current pricing, it means that the option has a positive intrinsic valuation, which is referred to as ‘in the money’ call. On the flip side, if the price of the underlying instrument is lower than the option contract strike price, it is referred to as ‘in the money’ put as the execution to sell the asset class above the underlying price is profitable.
If a buyer of a Call is ‘out of the money’, it means that the Call option contract has no intrinsic value, in other words, the strike price that is higher than the price of the underlying instrument. Meanwhile, a Put ‘out of the money’ indicates a strike price lower than the price of the underlying asset.
At the time of buying an option contract, whether it is a Call or a Put, the more advantageous the strike price in your favor, the more expensive the option will be. Right from the moment you buy an option, therefore, you can be categorized as ‘in the money’ or ‘out of the money’.
Option contracts ‘out of the money’ cost only a fraction of what ‘in the money’ price strikes cost, as the underlying price must move a certain distance in one’s favor before the ‘out of the money’ option holder happens to be in a position to make any profit.
That’s why, when market participants buy an ‘out of the money’ option contract, in many instances serves the purpose of buying cheap insurances in case the underlying price goes against them.
For instance, if I am an institution with a large position long EUR/USD, how can I protect my downside? The first answer that comes to mind for a retail trader would be via a conventional stop loss, right?
However, there are more sophisticated ways to limit your downside risks while still allowing your long Euro position to play out without running the risk of getting stopped out. This is achieved via the low-cost of buying an ‘out of the money’ Call, which would allow to also restrict any losses, but with the added benefit of the time decay to potentially still keep you in the long position without being taken out via a stop loss.
Conversely, if an institution holds the same long view in the EUR/USD market, but we notice that the recent activity in the options market is largely skewed towards an increase of ‘in the money’ calls, what does this mean? This is an aggressive change which obeys to the rationale of a number of participants that are aggressively buying up EUR at an expensive price in view of higher prices before the expiration of the futures contract.
How to Access Forex Options Data
Up until this point, I’ve walked you through the very basic building blocks each one must understand before we could be moving along. So, if we would you like to know what forex options traders are up to on a daily basis, how can we possibly find out? Follow the instructions below.
1 — We will registerto the CME site.
2 — Once you are in, we will click on ‘Select Products’ and then ‘FX’.
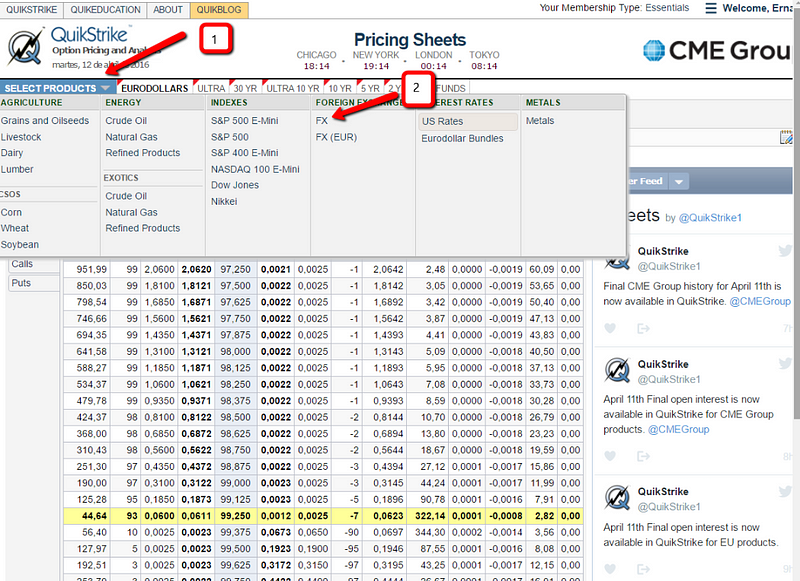
3 — On the top of the screen we have various asset classes.
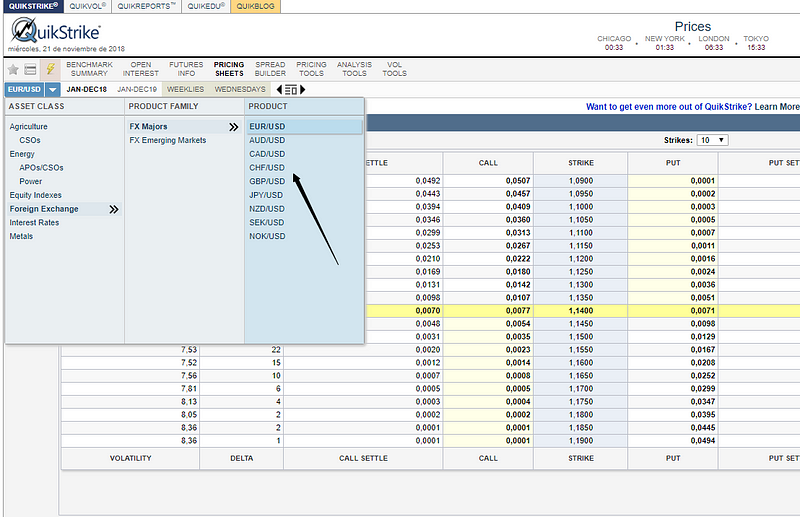
4 — Depending on the futures market we want to analyze, we will select one or another. For simulation purposes, let’s select the AUD/USD.
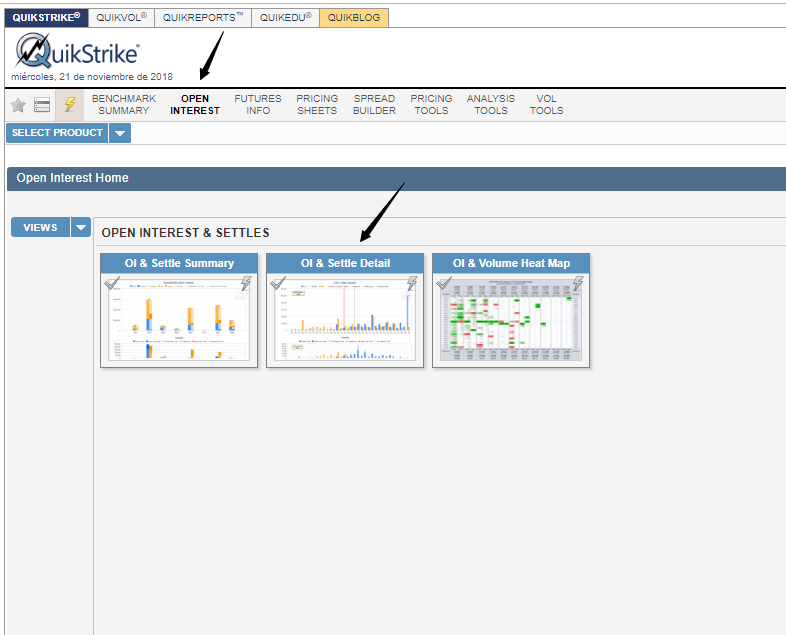
5 — Below each asset class, different categories are displayed. The one that we will focus on is OPEN INTEREST section. This is the activity we will be exploring on a daily basis (OI & Settle Detail).
6 — Let’s look at Open Interest AUDUSD first. This is the summary of options activity page you will land at. Note, make sure you check OI activity for the earliest contract due to expire, in this case, AUDUSD Dec contract (currently the most actively traded with 17 days to expire.
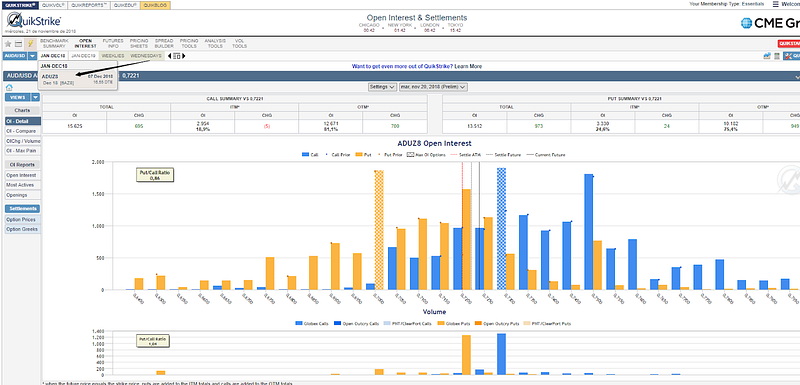
7 — After all the above steps, now is when we get down to the nitty-gritty to obtain what could be valuable information for that particular market.
8 — At the top of the section, we will find a summary displaying the change in open interest, divided by IM (In-the-money) or OM (out-of-the-money) Calls / Puts. Once this info becomes available each day, ahead of the Frankfurt open, we want to start digging in to find little gems of information to factor in.
How to Make Sense Of The Options Data?
Let me now briefly explain how to best interpret this info.
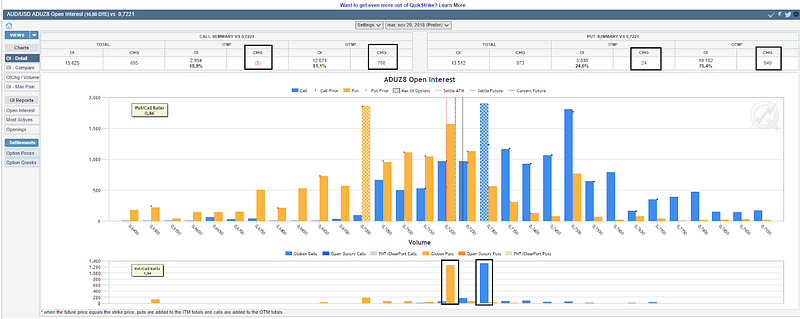
Before I dive right into it, note that if you want to get a sense of the overall stance (macro wise) of the market, you can locate on the top left side of the chart above the total split between puts and calls via a ratio. That would definitely give you an idea of how the market is positioned. Each vertical bar helps with the visual representation too.
Remember, when a futures contract, in this case, the 6A (AUDUSD) shows heavy activity in IM Calls, that means that the holder of the call purchased has the right to buy the asset below its current market price, which implies that the right to buy that asset has intrinsic value.
If we see strong IM Calls activity, that means institutional players/hedge funds/smart money are in a hurry to buy the asset for what they perceive could be a directional move brewing.
IM calls activity, as you will notice if decide to add this concept to your daily routine, is not frequent. It perhaps occurs 2–3 times/month. But when it happens, you must pay attention, as that is a genuine bullish sign going forward. As per IM Puts, the same concept applies but instead of long this time we focus on the short side.
The most frequent occurrences in options activity are changes in out-of-the-money Calls or Puts. Remember, an OM Call or Put would be an option that has no intrinsic value, but only possesses extrinsic or time value. As a result, the value of an out of the money option erodes quickly with time as it gets closer to expiry.
Now, why do we want to check changes in OM Calls or Puts you may wonder? As I briefly touched on above, it is common practice by institutions, whenever they engage in a buy or sell campaigns, to use OM Calls or Puts for hedging purposes, as the cost of buying Calls or Puts out of the money are way cheaper than IM Calls/Puts (it acts as an ‘insurance’ against their desired direction).
If we see strong activity in OM Calls, that generally means the market is looking to go directionally short and are using these cheap calls out of the money (at a higher level than current prices) as protection should the asset class eventually turn against their favored directional bias (short).
The opposite applies if we see a jump in OM Puts, this is communicating that the market’s intention is more likely to be focused on long-side business in the underlying instrument.
Now that a brief definition between IM and OM Calls/Puts has been given, let’s look at the activity in the 6A contract. Allow me to rescue an example I had saved in my folder from 2y ago, Monday, April 11th, 2016.
As shown in the illustration below, we can notice a huge jump in OM Puts, with activity concentrated at 0.7150 and 0.74 strikes. Note there should be a significant difference between OM Calls and Puts to conclude that the reading has enough significance. I’d personally suggest a minimum ratio of 3/1.
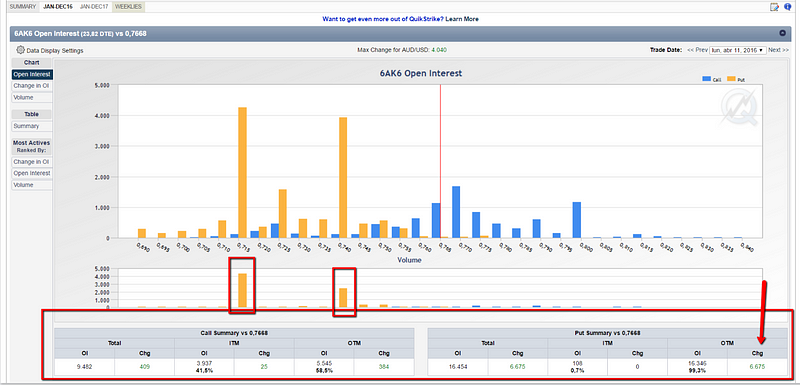
What this implies is that market participants remain long-biased, while tapping into the benefits of buying cheap ‘insurance-like’ OM Puts in the 6A contract for hedging purposes.
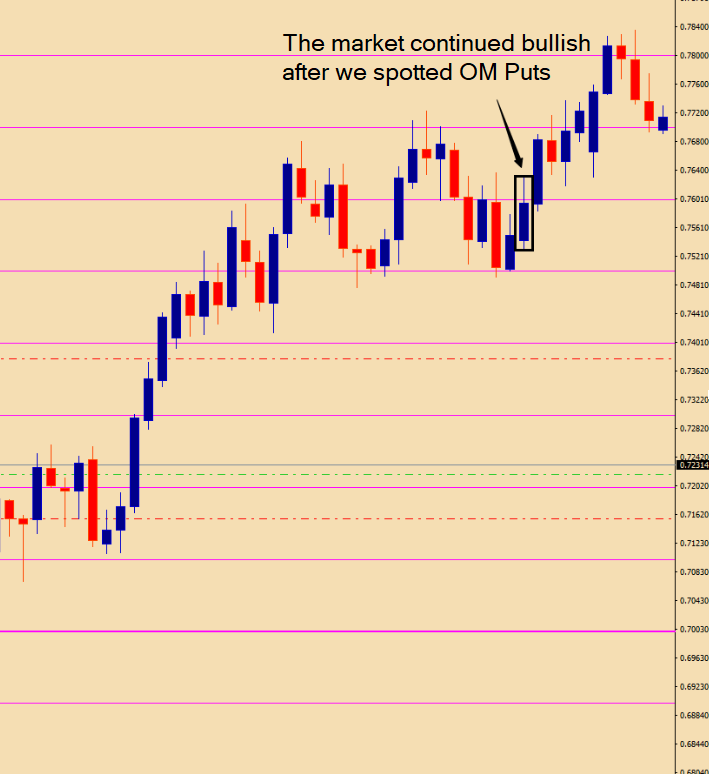
If the market continues bullish, they make money via long spot. However, if the market turns against them, the OM Put option will start having intrinsic value once it drops below 74.
OM Calls/Puts are a much better strategy to protect one’s positions, as they serve the purpose of a dynamic ‘stop-loss’. It has the added advantage that your position is never at risk of being taken out, instead of running the risk of the option expiring worthless. But if that is the case, that probably means that their long-sided view of the market AUDUSD long has paid off most likely.
In terms of practical use, whenever we see this heavy biased activity, we want to take note and report, as it telegraphs bullishness, with 0.74 the first line in the sand from a macro level, to take into consideration.
Following the info we received in the options activity on April 11th, 2016, the performance by the AUDUSD was bullish for more than a week afterward. By monitoring the options market, we would have been one step ahead by understanding that there was sufficient evidence of hedging activities via CME data to remain long.
Additional notes:
I’ve been writing quite extensively on options activity in the past during my tenure at FXStreet. Find below a couple of samples to help you strengthen your understanding of what’s been discussed in this tutorial.
EUR/USD: Options traders busy buying ‘in the money’ calls
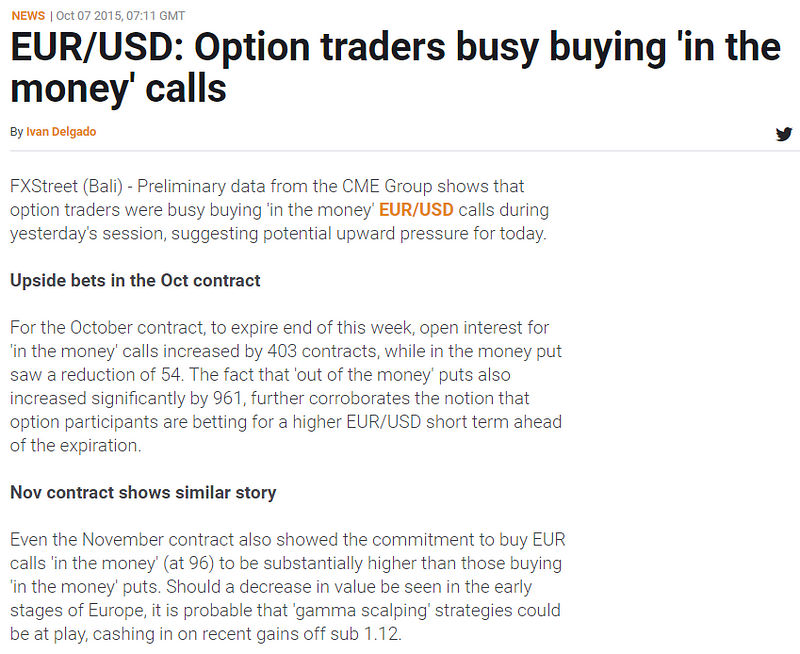
EUR/USD: Options market shows evidence selling has substance behind
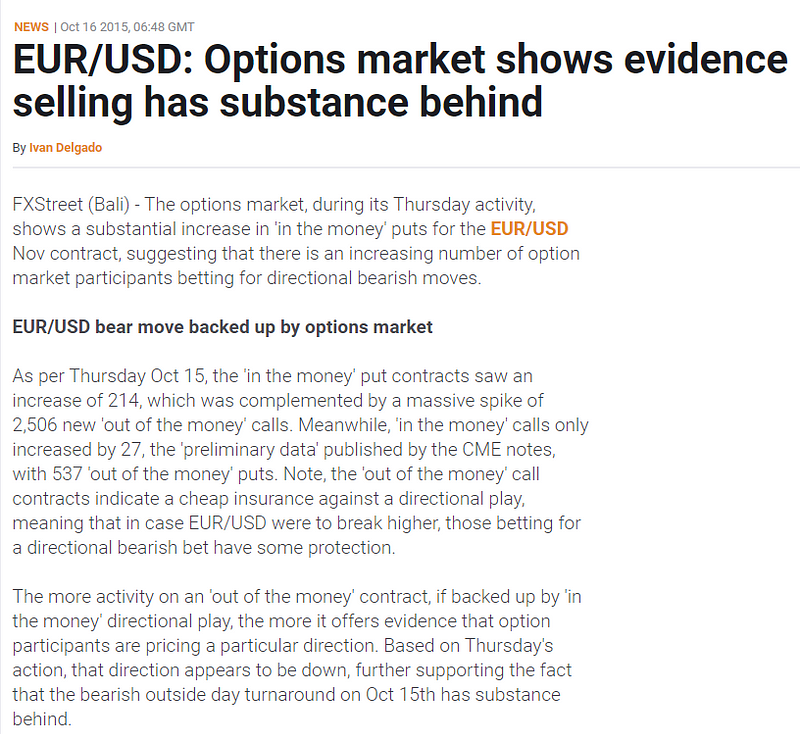
Ivan Delgado, Head of Market Research at Global Prime Forex.
I thought I'd open up this new thread so that I will notify the forum whenever new material is available. My only intention is to pass on my knowledge after over a decade trading forex (no fillers, no non-sense).
In this guide, I look at How To Define Your Bias Thru Forex Options
As forex traders, adding further layers of evidence to help you in the makeup of every day’s jigsaw, this time via how options traders are positioning on a day to day basis, can reveal invaluable snippets of information.
After all, market makers in the options market use some of the most sophisticated technologies and models out there to assist them in pricing options as a reflection of the anticipation of market volatility. Therefore, cues obtained via implied volatility but also through the split and variations in Calls/Puts constitutes very valuable information.
Understanding Call & Put Options
Before taking things further, for the less initiated, let’s break down the type of options that exist.
On one hand, we have Call options, which give the right (not the obligation) to execute a buy order of an underlying asset at a specified price (the strike price), during a certain period of time. On the other hands, Put options provide the holder the right to execute a sell order of an underlying asset at a specified price (the strike price), during a certain period of time. Both Calls and Puts can be exercised at any time during the validity of the contract.
The next point is cardinal. If you are an option buyer, your downside is limited to the premium you paid. Therefore, those that are exposed to unlimited risk are option sellers or also referred as the writers, while their upside or potential profit is limited to the Put premium received.
In & Out Of The Money Options
The following terms are critically important as it constitutes the foundation to understand this tutorial. We must differentiate what it means to be ‘in the money’ and ‘out of the money’.
The term itself is quite self-explanatory, but let me provide some examples.
If as the buyer of a Call, the strike price is below the current pricing, it means that the option has a positive intrinsic valuation, which is referred to as ‘in the money’ call. On the flip side, if the price of the underlying instrument is lower than the option contract strike price, it is referred to as ‘in the money’ put as the execution to sell the asset class above the underlying price is profitable.
If a buyer of a Call is ‘out of the money’, it means that the Call option contract has no intrinsic value, in other words, the strike price that is higher than the price of the underlying instrument. Meanwhile, a Put ‘out of the money’ indicates a strike price lower than the price of the underlying asset.
At the time of buying an option contract, whether it is a Call or a Put, the more advantageous the strike price in your favor, the more expensive the option will be. Right from the moment you buy an option, therefore, you can be categorized as ‘in the money’ or ‘out of the money’.
Option contracts ‘out of the money’ cost only a fraction of what ‘in the money’ price strikes cost, as the underlying price must move a certain distance in one’s favor before the ‘out of the money’ option holder happens to be in a position to make any profit.
That’s why, when market participants buy an ‘out of the money’ option contract, in many instances serves the purpose of buying cheap insurances in case the underlying price goes against them.
For instance, if I am an institution with a large position long EUR/USD, how can I protect my downside? The first answer that comes to mind for a retail trader would be via a conventional stop loss, right?
However, there are more sophisticated ways to limit your downside risks while still allowing your long Euro position to play out without running the risk of getting stopped out. This is achieved via the low-cost of buying an ‘out of the money’ Call, which would allow to also restrict any losses, but with the added benefit of the time decay to potentially still keep you in the long position without being taken out via a stop loss.
Conversely, if an institution holds the same long view in the EUR/USD market, but we notice that the recent activity in the options market is largely skewed towards an increase of ‘in the money’ calls, what does this mean? This is an aggressive change which obeys to the rationale of a number of participants that are aggressively buying up EUR at an expensive price in view of higher prices before the expiration of the futures contract.
How to Access Forex Options Data
Up until this point, I’ve walked you through the very basic building blocks each one must understand before we could be moving along. So, if we would you like to know what forex options traders are up to on a daily basis, how can we possibly find out? Follow the instructions below.
1 — We will registerto the CME site.
2 — Once you are in, we will click on ‘Select Products’ and then ‘FX’.
3 — On the top of the screen we have various asset classes.
4 — Depending on the futures market we want to analyze, we will select one or another. For simulation purposes, let’s select the AUD/USD.
5 — Below each asset class, different categories are displayed. The one that we will focus on is OPEN INTEREST section. This is the activity we will be exploring on a daily basis (OI & Settle Detail).
6 — Let’s look at Open Interest AUDUSD first. This is the summary of options activity page you will land at. Note, make sure you check OI activity for the earliest contract due to expire, in this case, AUDUSD Dec contract (currently the most actively traded with 17 days to expire.
7 — After all the above steps, now is when we get down to the nitty-gritty to obtain what could be valuable information for that particular market.
8 — At the top of the section, we will find a summary displaying the change in open interest, divided by IM (In-the-money) or OM (out-of-the-money) Calls / Puts. Once this info becomes available each day, ahead of the Frankfurt open, we want to start digging in to find little gems of information to factor in.
How to Make Sense Of The Options Data?
Let me now briefly explain how to best interpret this info.
Before I dive right into it, note that if you want to get a sense of the overall stance (macro wise) of the market, you can locate on the top left side of the chart above the total split between puts and calls via a ratio. That would definitely give you an idea of how the market is positioned. Each vertical bar helps with the visual representation too.
Remember, when a futures contract, in this case, the 6A (AUDUSD) shows heavy activity in IM Calls, that means that the holder of the call purchased has the right to buy the asset below its current market price, which implies that the right to buy that asset has intrinsic value.
If we see strong IM Calls activity, that means institutional players/hedge funds/smart money are in a hurry to buy the asset for what they perceive could be a directional move brewing.
IM calls activity, as you will notice if decide to add this concept to your daily routine, is not frequent. It perhaps occurs 2–3 times/month. But when it happens, you must pay attention, as that is a genuine bullish sign going forward. As per IM Puts, the same concept applies but instead of long this time we focus on the short side.
The most frequent occurrences in options activity are changes in out-of-the-money Calls or Puts. Remember, an OM Call or Put would be an option that has no intrinsic value, but only possesses extrinsic or time value. As a result, the value of an out of the money option erodes quickly with time as it gets closer to expiry.
Now, why do we want to check changes in OM Calls or Puts you may wonder? As I briefly touched on above, it is common practice by institutions, whenever they engage in a buy or sell campaigns, to use OM Calls or Puts for hedging purposes, as the cost of buying Calls or Puts out of the money are way cheaper than IM Calls/Puts (it acts as an ‘insurance’ against their desired direction).
If we see strong activity in OM Calls, that generally means the market is looking to go directionally short and are using these cheap calls out of the money (at a higher level than current prices) as protection should the asset class eventually turn against their favored directional bias (short).
The opposite applies if we see a jump in OM Puts, this is communicating that the market’s intention is more likely to be focused on long-side business in the underlying instrument.
Now that a brief definition between IM and OM Calls/Puts has been given, let’s look at the activity in the 6A contract. Allow me to rescue an example I had saved in my folder from 2y ago, Monday, April 11th, 2016.
As shown in the illustration below, we can notice a huge jump in OM Puts, with activity concentrated at 0.7150 and 0.74 strikes. Note there should be a significant difference between OM Calls and Puts to conclude that the reading has enough significance. I’d personally suggest a minimum ratio of 3/1.
What this implies is that market participants remain long-biased, while tapping into the benefits of buying cheap ‘insurance-like’ OM Puts in the 6A contract for hedging purposes.
If the market continues bullish, they make money via long spot. However, if the market turns against them, the OM Put option will start having intrinsic value once it drops below 74.
OM Calls/Puts are a much better strategy to protect one’s positions, as they serve the purpose of a dynamic ‘stop-loss’. It has the added advantage that your position is never at risk of being taken out, instead of running the risk of the option expiring worthless. But if that is the case, that probably means that their long-sided view of the market AUDUSD long has paid off most likely.
In terms of practical use, whenever we see this heavy biased activity, we want to take note and report, as it telegraphs bullishness, with 0.74 the first line in the sand from a macro level, to take into consideration.
Following the info we received in the options activity on April 11th, 2016, the performance by the AUDUSD was bullish for more than a week afterward. By monitoring the options market, we would have been one step ahead by understanding that there was sufficient evidence of hedging activities via CME data to remain long.
Additional notes:
I’ve been writing quite extensively on options activity in the past during my tenure at FXStreet. Find below a couple of samples to help you strengthen your understanding of what’s been discussed in this tutorial.
EUR/USD: Options traders busy buying ‘in the money’ calls
EUR/USD: Options market shows evidence selling has substance behind