Elliott Wave Analysis by Admiral Markets

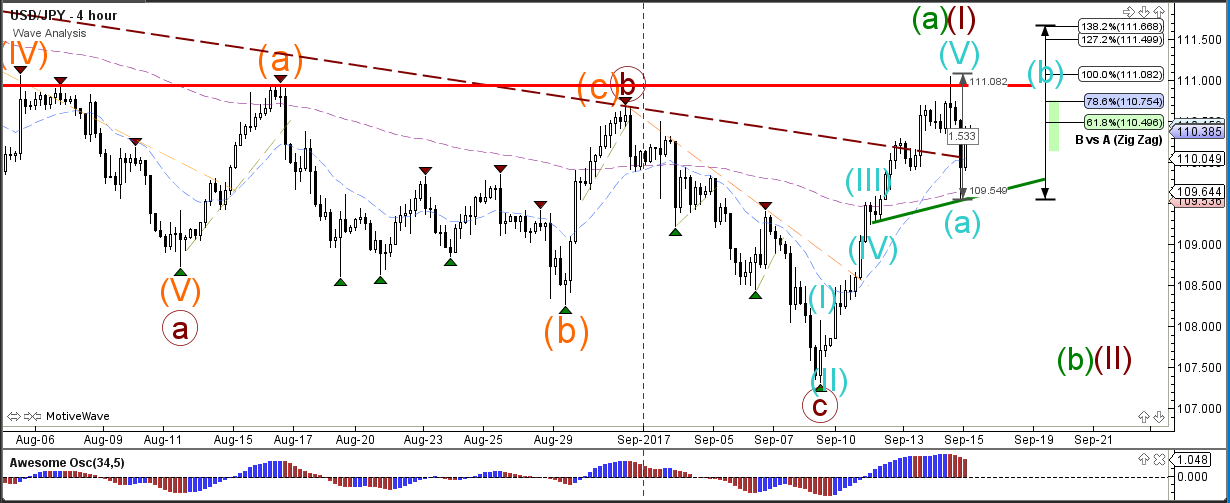
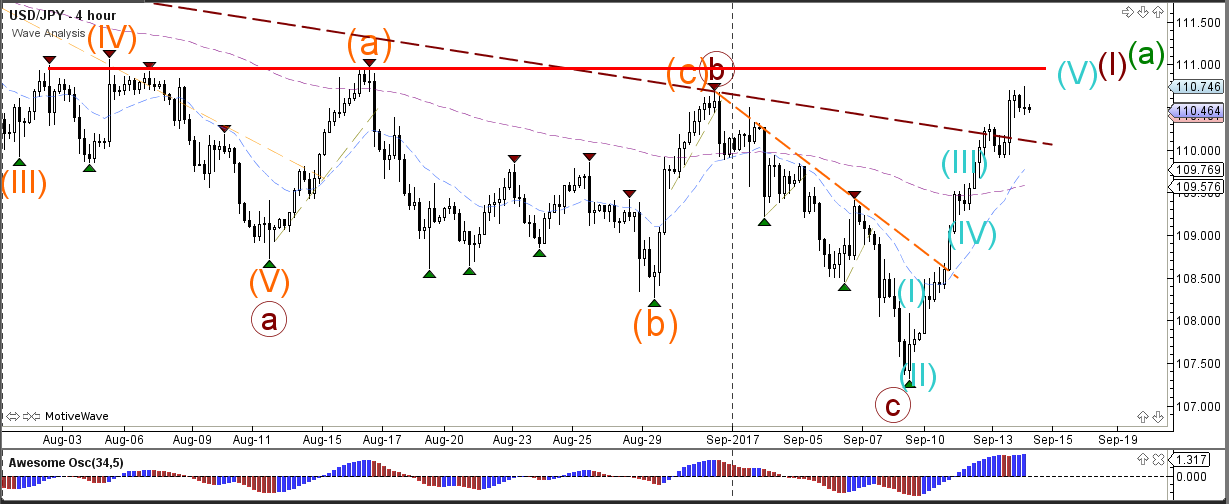
USD/JPY Bullish Momentum Faces Strong 111 Resistance Zone

USD/JPY

4 hour


14-09-2017uj4.png1229x504 56.2 KB


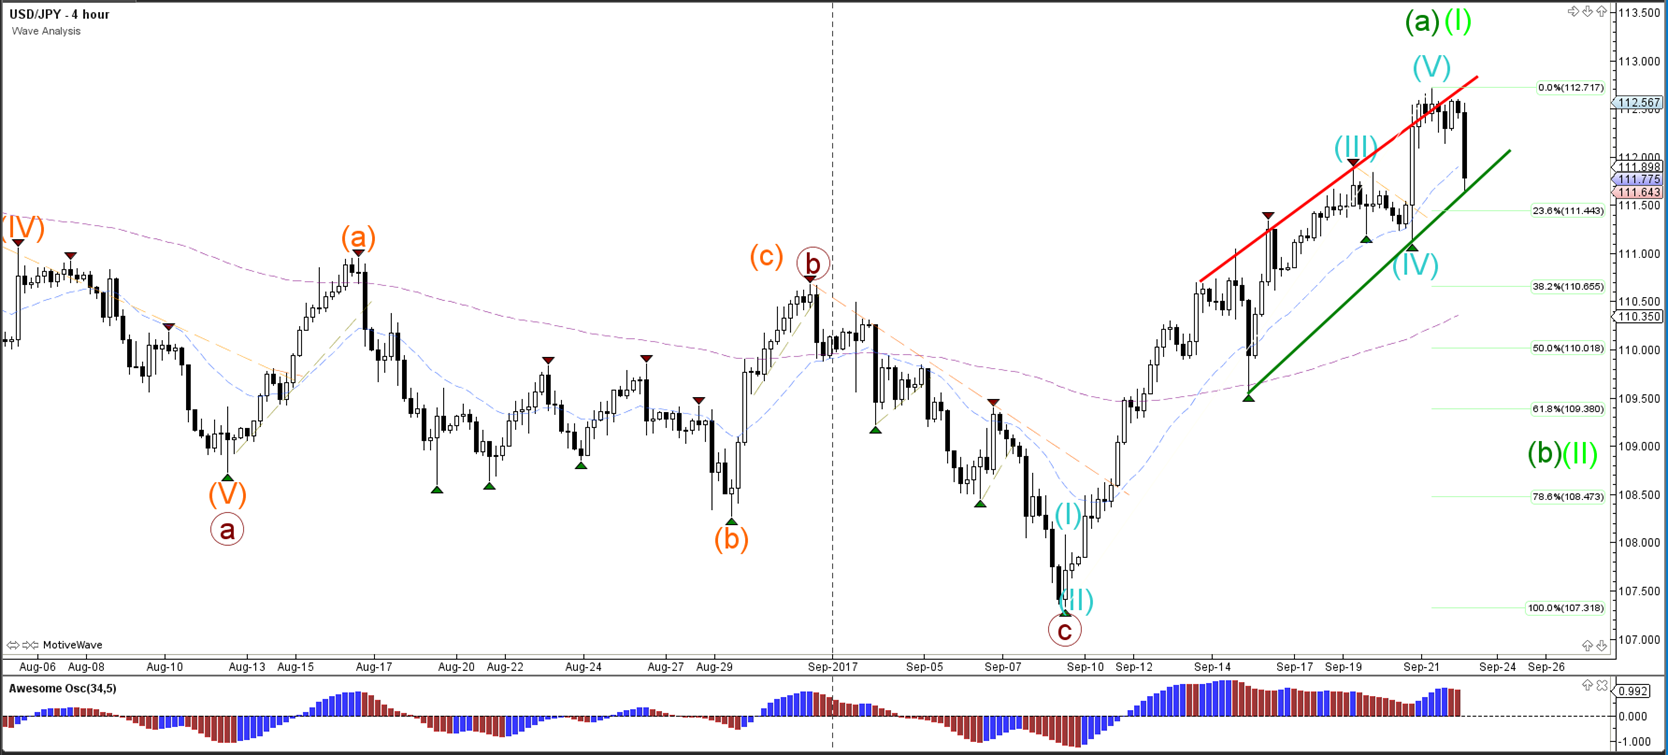
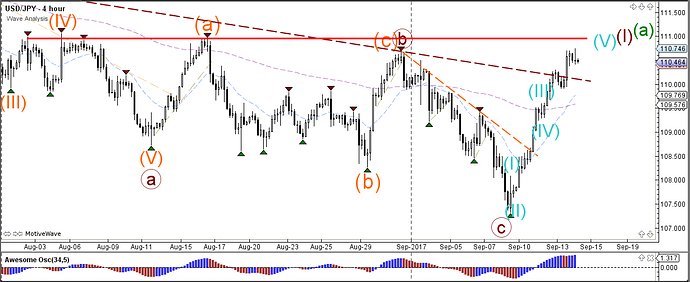
The USD/JPY bullish momentum broke above the resistance trend line (dotted brown) but price has a strong horizontal resistance level nearby (red). Price seems to be building 5 (blue) bullish waves within wave 1 or wave A.
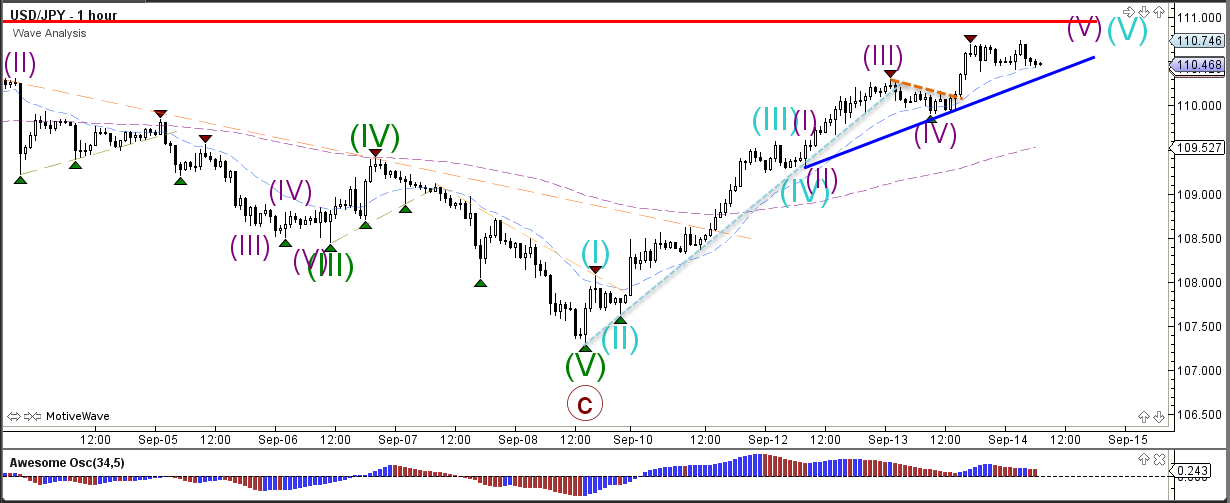
1 hour


14-09-2017uj1.png1230x503 56.4 KB


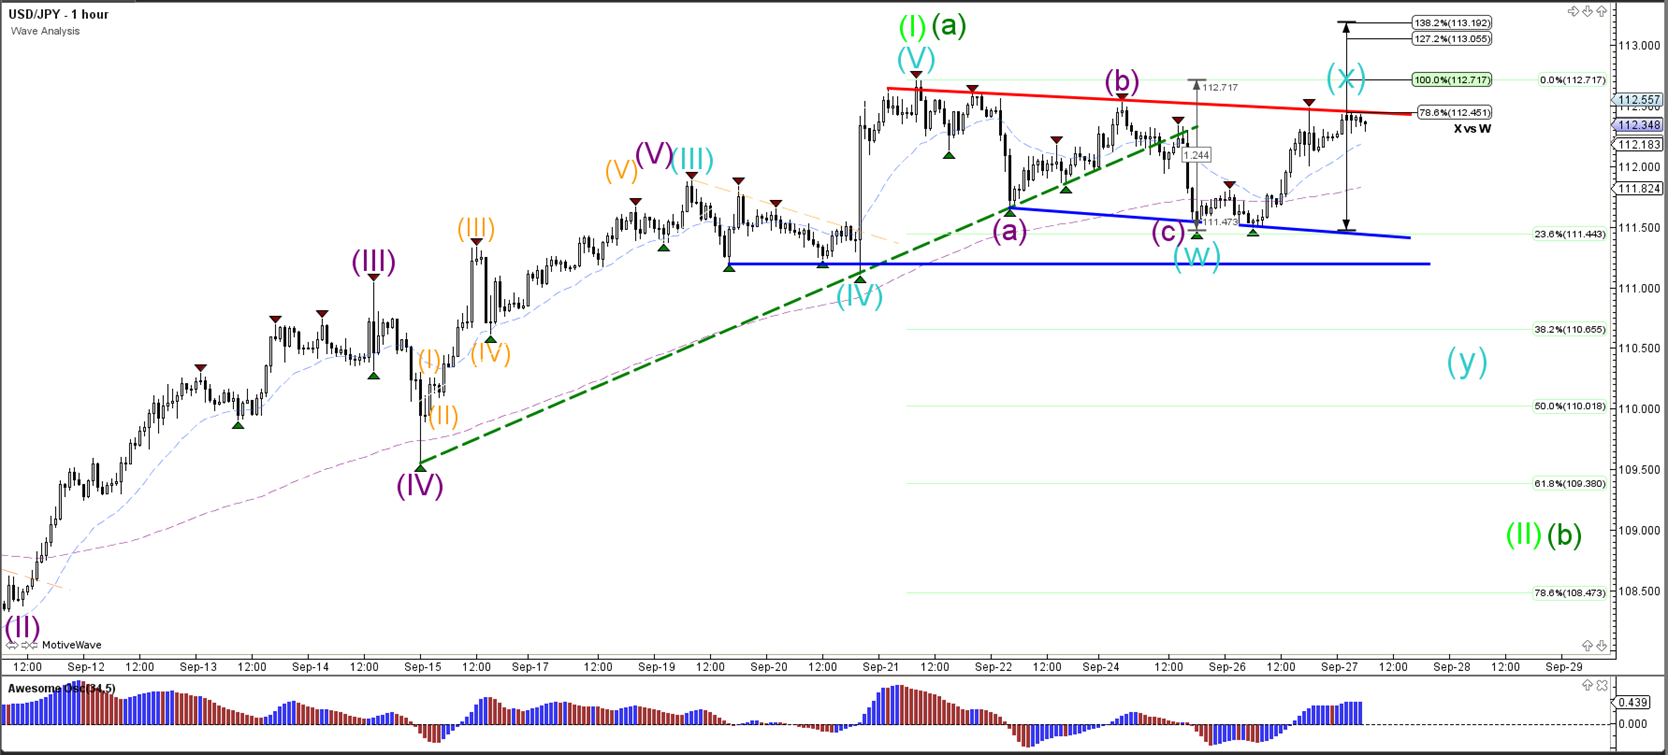
The USD/JPY is showing strong bullish momentum and is building 5 extended waves (purple). A break below support could indicate the start of a bearish correction.
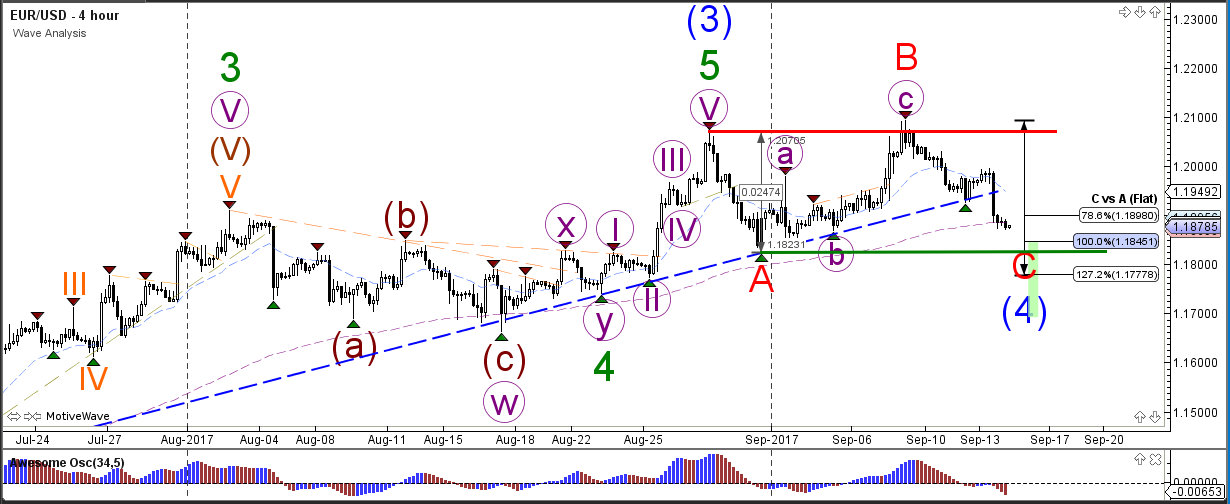
EUR/USD

4 hour


14-09-2017eu4.png1230x504 65.5 KB


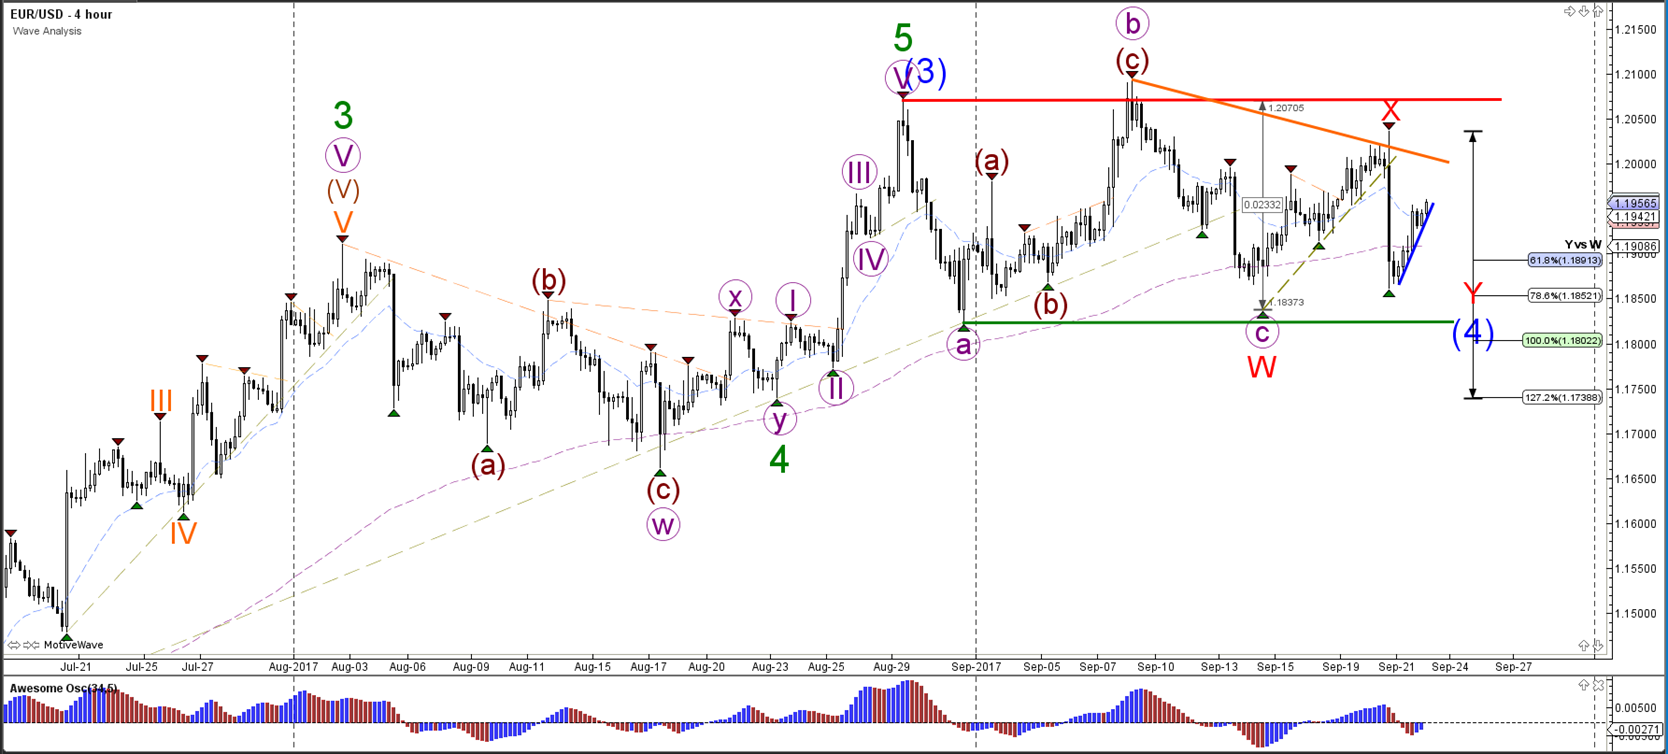
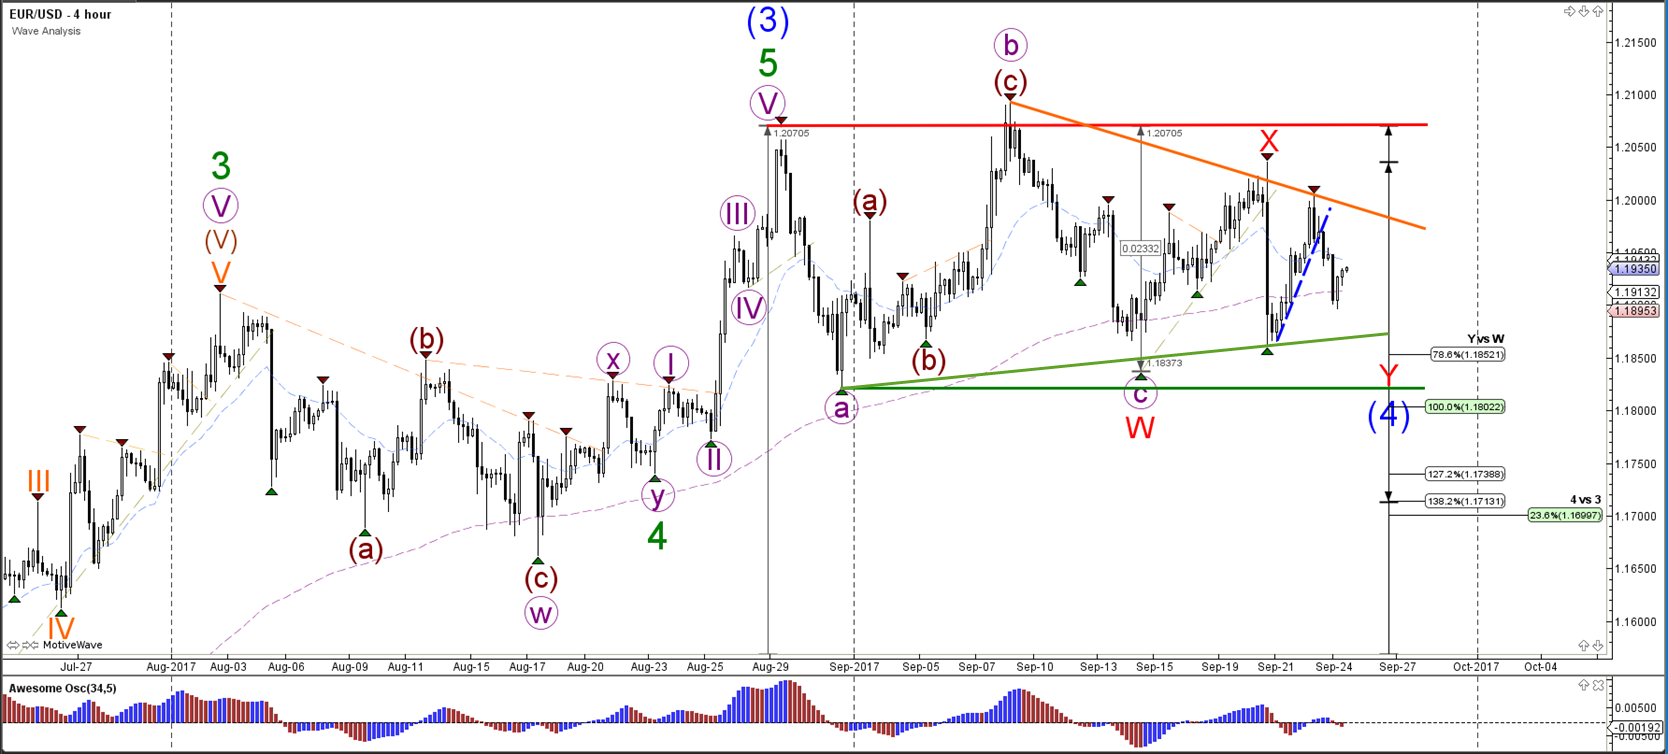
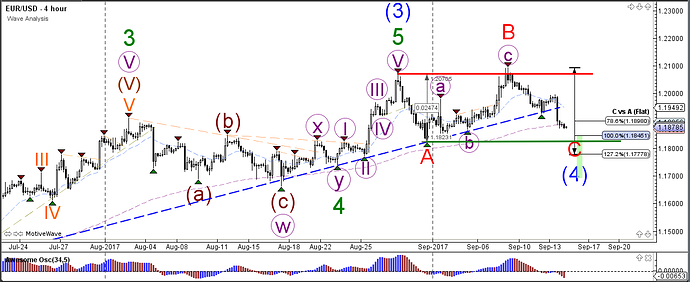
The EUR/USD broke below the support trend line (dotted blue) and extended the bearish price action. The wave structure is most likely indicating a wave C (red) within a larger wave 4 (blue). The Fibonacci levels of wave C vs A are most likely bouncing spots for further upside.

1 hour


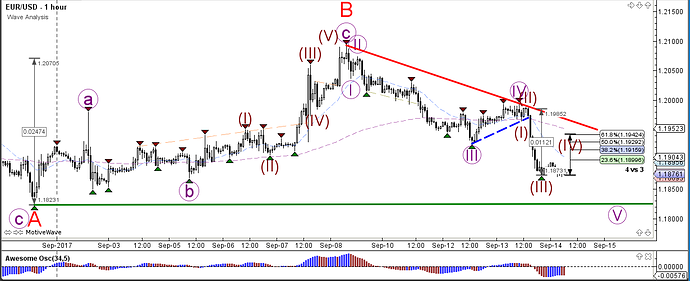
14-09-2017eu1.png1230x502 57.1 KB


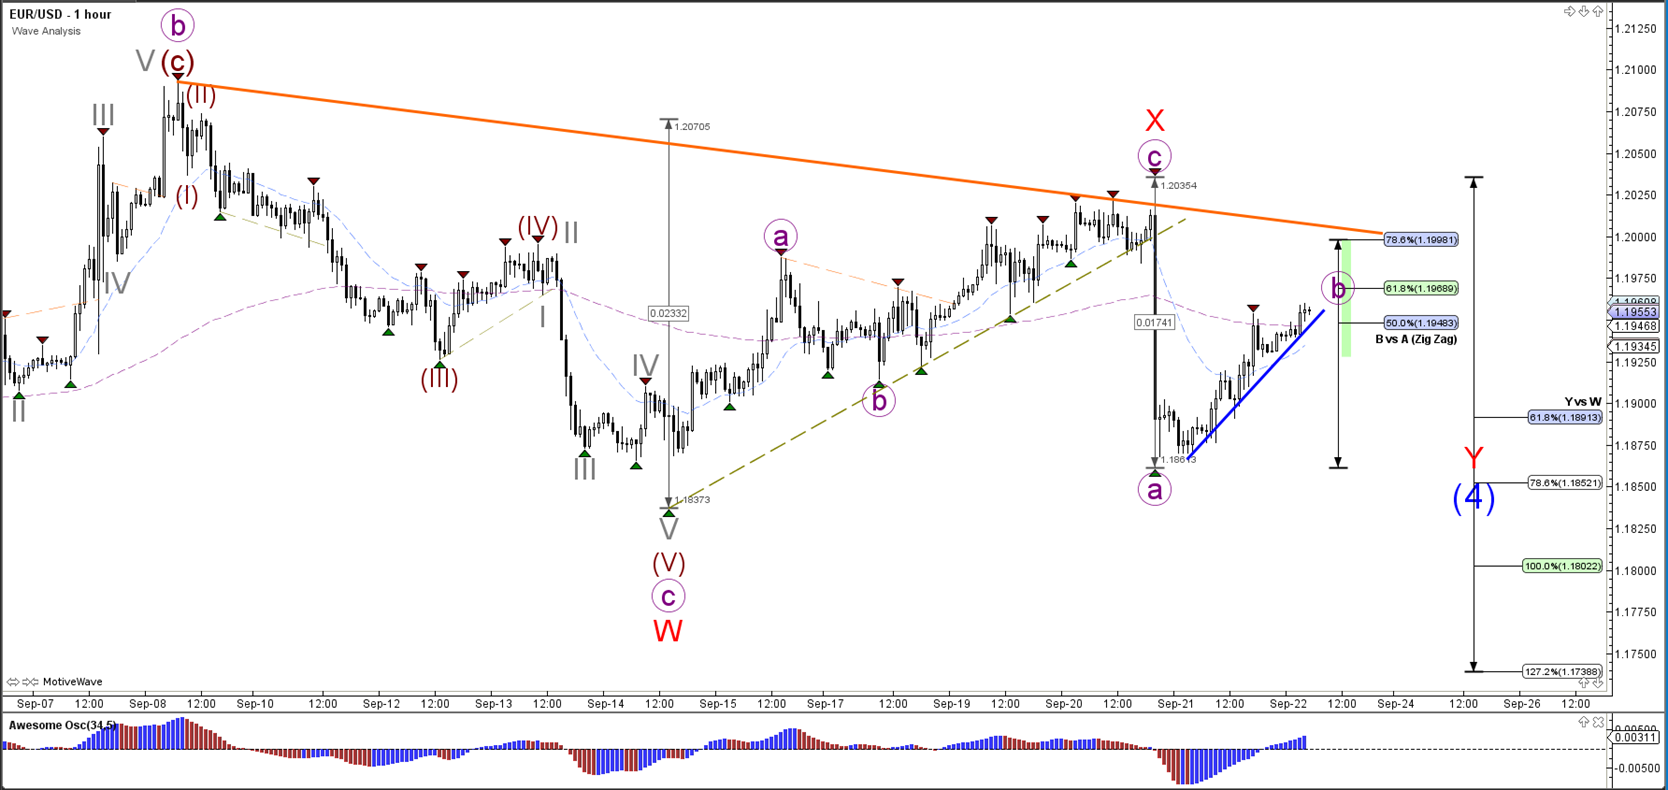
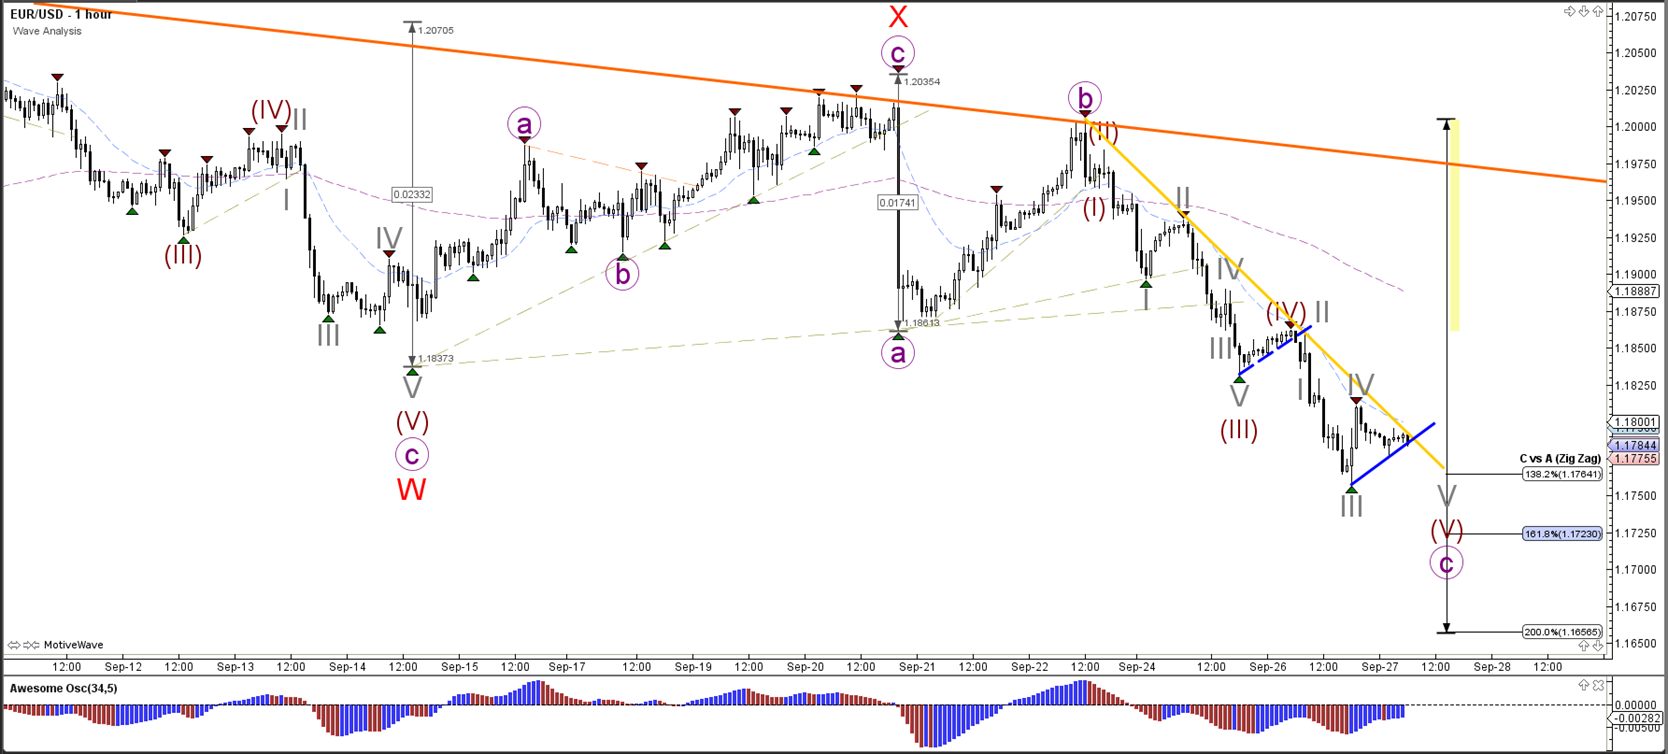
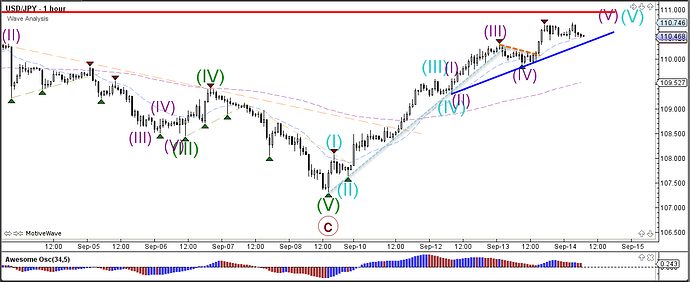
The EUR/USD broke below the minor support (dotted blue) and price is building 5 internal waves (brown) within wave 5 (purple). Price could bounce at the previous bottom (green line) of wave A for instance. A break of resistance (red) could indicate the start of a new uptrend.

GBP/USD

4 hour


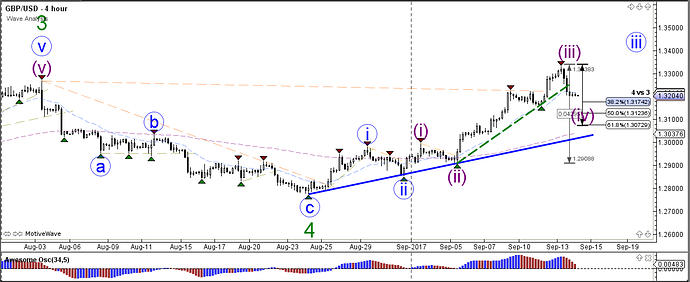
14-09-2017gu4.png1229x504 50.3 KB


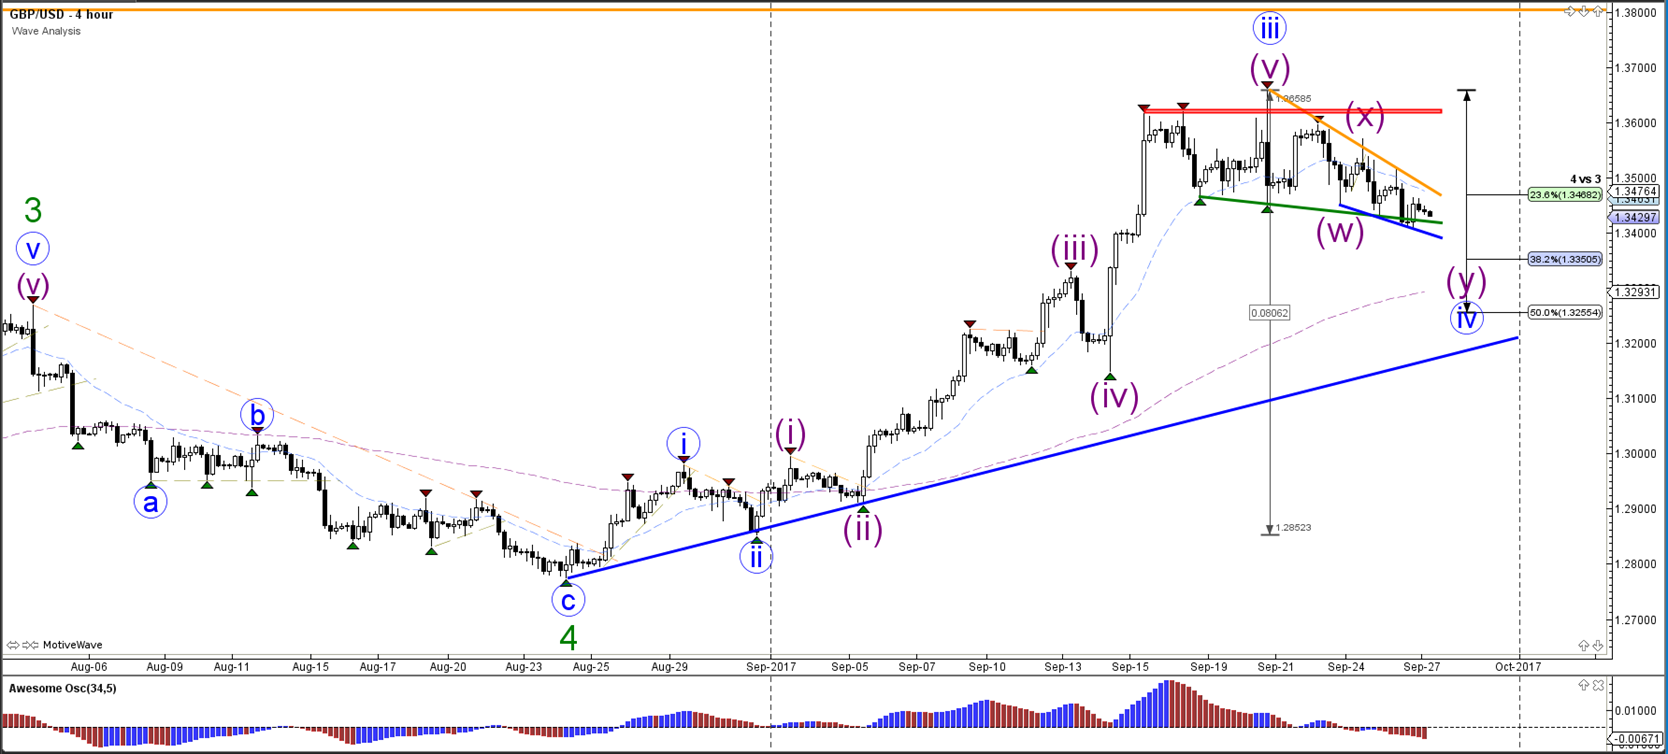
The GBP/USD broke below the support trend line (dotted green) and completed the 3rd wave (purple). Price could now be in a potential wave 4 (purple) retracement which could bounce at the Fibonacci levels of wave 4 vs 3.

1 hour


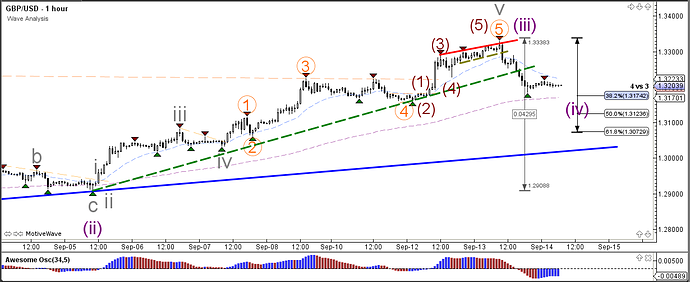
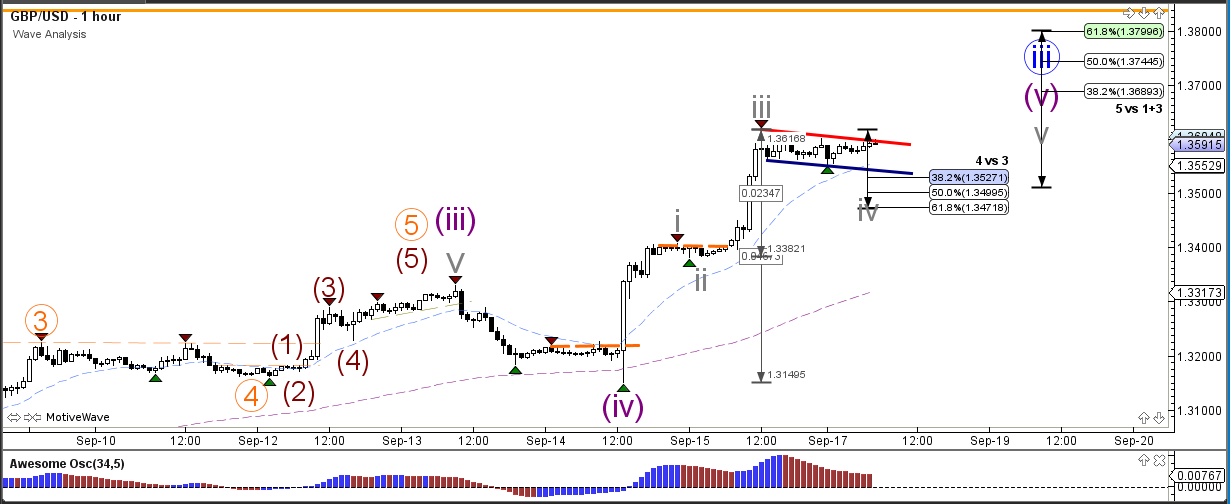
14-09-2017gu1.png1230x504 56.7 KB


The GBP/USD did indeed complete multiple waves 5 at around 1.33. The retracement has broken below multiple support levels (dotted green) and is now testing the Fibonacci levels.

Follow @ChrisSvorcik on twitter for latest market updates.
Connect with Chris Svorcik on Facebook for latest Forex and education tips.

Risk disclosure - Forex and CFD trading carries a high level where losses can exceed your deposits. This material is does not contain, and should not be construed as containing, investment advice or an investment recommendation or, an offer of or solicitation for any transactions in financial instruments. Please note that the trading analyses which refers to past performance, may change over time. No representation is given as to the accuracy or completeness of the information and any person acting upon it does so entirely at their own risk. Before making any investment decisions, you should seek advice from independent financial advisor to ensure you understand the risks involved.
 
EUR/USD Completes ABC Correction at 100% Fibonacci Level

EUR/USD

4 hour


15-09-2017eu4.png1230x503 61.5 KB


The EUR/USD made a bullish bounce at the 100% Fibonacci level of wave C (red). Price will need to break above the resistance trend line (red) before the completion of wave 4 (blue) could become more likely.

1 hour


15-09-2017eu1.png1230x502 53.7 KB


The EUR/USD completed 5 internal waves (brown) within wave 5 (purple) and price bounced at the previous bottom (green line) of wave A. A break of resistance (red) could indicate the start of a new uptrend.

USD/JPY

4 hour


15-09-2017uj4.png1230x503 63.2 KB


The USD/JPY made a bearish bounce at the strong horizontal resistance level (red). This could indicate the start of a wave 2 (brown) or alternatively a wave B (green). The correction could unfold via an ABC (blue) and therefore the Fibonacci levels of wave B vs A could act as resistance.

1 hour


15-09-2017uj1.png1230x503 53.9 KB


The USD/JPY is in a wave B (blue) unless price manages to break above the 138.2% Fibonacci level. A break below support (green) could see price make a bearish breakout within wave 2 (brown).

GBP/USD

4 hour


15-09-2017gu4.png1230x504 48.3 KB


The GBP/USD indeed bounced at the Fibonacci levels of wave 4 (purple) retracement and continue with the larger uptrend of wave 3 (blue).

1 hour


15-09-2017gu1.png1230x504 42.4 KB


The GBP/USD could push towards the Fibonacci targets of wave 5 (purple).

Follow @ChrisSvorcik on twitter for latest market updates.
Connect with Chris Svorcik on Facebook for latest Forex and education tips.

Risk disclosure - Forex and CFD trading carries a high level where losses can exceed your deposits. This material is does not contain, and should not be construed as containing, investment advice or an investment recommendation or, an offer of or solicitation for any transactions in financial instruments. Please note that the trading analyses which refers to past performance, may change over time. No representation is given as to the accuracy or completeness of the information and any person acting upon it does so entirely at their own risk. Before making any investment decisions, you should seek advice from independent financial advisor to ensure you understand the risks involved.
 
GBP/USD Bull Flag Continuation Chart Pattern Targets 1.3750

GBP/USD

4 hour


18-09-2017gu4.png1231x505 50.3 KB


The GBP/USD bullish momentum is strong and probably part of a wave 3 (blue). The resistance line (orange) is a potential resistance from the daily chart.

1 hour


18-09-2017gu1.png1230x504 45.8 KB


The GBP/USD is building a bull flag chart pattern (red/blue), which is a continuation pattern within the uptrend. The Fibonacci levels of wave 4 vs 3 (grey) are most likely support whereas a break above the bull flag could see price challenge the Fibonacci targets of wave 5 (grey/purple).

EUR/USD

4 hour


18-09-2017eu4.png1230x504 59.7 KB


The EUR/USD seems to have completed an ABC correction (red) within the wave 4 (blue). A bullish breakout could indicate the continuation of the uptrend via wave 5 (blue).

1 hour


18-09-2017eu1.png1230x504 51.1 KB


The wave 4 (blue) might become extended via a WXY formation (red) if price develops a 3 wave pattern (purple).

USD/JPY

4 hour


18-09-2017uj4.png1230x503 58.5 KB


The USD/JPY is challenging the strong horizontal resistance level (red), which could indicate the end of a wave 1 (light green) or alternatively wave A (green).

1 hour


18-09-2017uj1.png1231x504 53.3 KB


The USD/JPY break below the support trend lines (green/blue) could indicate a bearish ABC correction. Otherwise price could still continue slightly higher within the wave 5 (blue).

Follow @ChrisSvorcik on twitter for latest market updates.
Connect with Chris Svorcik on Facebook for latest Forex and education tips.

Risk disclosure - Forex and CFD trading carries a high level where losses can exceed your deposits. This material does not contain, and should not be construed as containing, investment advice or an investment recommendation or, an offer of or solicitation for any transactions in financial instruments. Please note that the trading analyses which refers to past performance, may change over time. No representation is given as to the accuracy or completeness of the information and any person acting upon it does so entirely at their own risk. Before making any investment decisions, you should seek advice from an independent financial advisor to ensure you understand the risks involved.
 
Bullish EUR/USD, GBP/USD Test Resistance Fibonacci Levels

EUR/USD

4 hour


22-09-2017eu4.png1668x754 236 KB


The EUR/USD is probably in an extended correction within wave 4 (blue) when considering the sideways price movement between support (green) and resistance (red). Currently I’m expecting a longer wave Y (red) because from a time perspective the current wave seems short when compared to wave X and Y (red).

1 hour


22-09-2017eu1.png1668x790 216 KB


The EUR/USD could perhaps be building an ABC (purple) zigzag correction within wave Y (red). The confirmation could be a bearish candlestick pattern at the Fibonacci levels of wave B (purple) or a break of the support trend line (blue). A break above the resistance trend line (orange) and 78.6% Fib of wave B vs A with strong candles could indicate uptrend continuation.

GBP/USD

4 hour


22-09-2017gu4.png1668x752 207 KB


The GBP/USD bounced at the support trend line (green). The bounce could be part of the wave 4 (blue) correction as typically waves 4 are lengthy consolidation patterns.

1 hour


22-09-2017gu1.png1668x755 203 KB


The GBP/USD is probably building an ABC (grey) correction within wave B (purple) but a break above the resistance trend lines and 78.6% Fib of wave B vs A with strong candles could indicate uptrend continuation.

USD/JPY

4 hour


22-09-2017uj4.png1668x755 200 KB


The USD/JPY did not manage to break above the resistance trend line (red) and bounced back down. Price is now testing a support trend line (green).

1 hour


22-09-2017uj1.png1668x754 210 KB


The USD/JPY could be a wave 123 (orange) which could be part of a larger ABC correction.

Follow @ChrisSvorcik on twitter for latest market updates.
Connect with Chris Svorcik on Facebook for latest Forex and education tips.

Risk disclosure - Forex and CFD trading carries a high level where losses can exceed your deposits. This material does not contain, and should not be construed as containing, investment advice or an investment recommendation or, an offer of or solicitation for any transactions in financial instruments. Please note that the trading analyses which refers to past performance, may change over time. No representation is given as to the accuracy or completeness of the information and any person acting upon it does so entirely at their own risk. Before making any investment decisions, you should seek advice from an independent financial advisor to ensure you understand the risks involved.
 
EUR/USD, GBP/USD Build Key Sideways Correction and Chart Patterns

EUR/USD

4 hour


25-09-2017eu4.png1668x754 232 KB


The EUR/USD is moving sideways as price stays in between support (green) and resistance (red) trend lines. The overall trend however is up and a bearish break could stop at the Fibonacci support levels of wave 4 (blue). A bullish breakout could indicate that the WXY (red) correction is finished.

1 hour


25-09-2017eu1.png1668x754 223 KB


The EUR/USD is in a triangle chart pattern which is indicated by the trend lines. Price is in a wave C (purple) of wave Y (red) unless price manages to break above resistance (red). In that case, the wave C is most likely completed at the most recent bottom.

GBP/USD

4 hour


25-09-2017gu4.png1668x754 212 KB


The GBP/USD is also in a sideways range (red/green lines) within a larger uptrend. A break below support could see price challenge the 38.2% Fibonacci level of wave 4 vs 3. A break above resistance could see price continue with the trend.

1 hour


25-09-2017gu1.png1668x754 199 KB


The GBP/USD needs to breakout below support (green) or above resistance (red/orange) otherwise the sideways range remains valid.

USD/JPY

4 hour


25-09-2017uj4.png1668x754 211 KB


The USD/JPY is testing a support trend line (green) of the uptrend channel.

1 hour


25-09-2017uj1.png1668x753 218 KB


The USD/JPY needs to break above resistance (orange) before an uptrend continuation is likely. A break below support (blue) could confirm an ABC (blue) correction.

Follow @ChrisSvorcik on twitter for latest market updates.
Connect with Chris Svorcik on Facebook for latest Forex and education tips.

Risk disclosure - Forex and CFD trading carries a high level where losses can exceed your deposits. This material does not contain, and should not be construed as containing, investment advice or an investment recommendation or, an offer of or solicitation for any transactions in financial instruments. Please note that the trading analyses which refers to past performance, may change over time. No representation is given as to the accuracy or completeness of the information and any person acting upon it does so entirely at their own risk. Before making any investment decisions, you should seek advice from an independent financial advisor to ensure you understand the risks involved.
 
GBP/USD Falling Wedge Pattern Approaches Support within Wave-4

GBP/USD

4 hour


27-09-2017gu4.png1668x754 202 KB


The GBP/USD seems to be building a falling wedge chart pattern (green/yellow lines). Price is now testing the support of that wedge. The corrective chart pattern fits within the larger wave 4 (blue) correction.

1 hour


27-09-2017gu1.png1668x754 220 KB


The GBP/USD has many support layers below it and could complete an ABC (grey) correction at support. A break of resistance (orange/red) could indicate the continuation of the uptrend whereas a break below support could indicate a larger wave C (grey) correction towards the Fibonacci targets.

EUR/USD

4 hour


27-09-2017eu4.png1668x754 227 KB


The EUR/USD broke the support zone (dotted green) as expected in yesterday’s analysis. The bearish momentum is indicated by the resistance trend line (yellow). Price could continue lower towards the Fibonacci targets but overall the bearish price action seems to be corrective. This could be explained by the potential wave 4 (blue).

1 hour


27-09-2017eu1.png1668x754 224 KB


The EUR/USD broke the support (dotted blue) of the bear flag chart pattern and continued lower towards the 1.1750 quarter level. The EUR/USD could extend the bearish momentum if price breaks below the support trend line (blue).

USD/JPY

4 hour


27-09-2017uj4.png1668x753 215 KB


The USD/JPY has bounced at the 23.6% Fibonacci support level. Price is now testing the resistance trend line (red) of the correction and a bearish bounce could confirm the wave X (blue) correction. A deeper correction could be part of a wave 2 (light green) or a wave B (green).

1 hour


27-09-2017uj1.png1668x755 212 KB


The USD/JPY is probably in a wave X (blue) unless price manages to break above the resistance trend line (red) and the 138.2% Fibonacci level of wave X vs W.

Follow @ChrisSvorcik on twitter for latest market updates.
Connect with Chris Svorcik on Facebook for latest Forex and education tips.

Risk disclosure - Forex and CFD trading carries a high level where losses can exceed your deposits. This material does not contain, and should not be construed as containing, investment advice or an investment recommendation or, an offer of or solicitation for any transactions in financial instruments. Please note that the trading analyses which refers to past performance, may change over time. No representation is given as to the accuracy or completeness of the information and any person acting upon it does so entirely at their own risk. Before making any investment decisions, you should seek advice from an independent financial advisor to ensure you understand the risks involved.
 
Back
Top