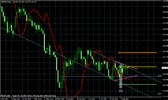
EUR/USD Daily Video, August 13, 2012

Sive Morten

Special Consultant to the FPA
Messages
18,644
Good morning,
currently price stands at important level. Although bulls have created all conditions for upward continuation - if this level will fail, then bears probably will return control on market:


The technical portion of Sive's analysis owes a great deal to Joe DiNapoli's methods, and uses a number of Joe's proprietary indicators. Please note that Sive's analysis is his own view of the market and is not endorsed by Joe DiNapoli or any related companies.
 
Last edited by a moderator:

gbpjpy

Hello Mr. Morten!

If you have the time please give an opinion on GBPJPY:

Monthly downtrend is well defined by 25x5 DMA. If the ABC points are correct, the price is moving to 100% expansion.

Weekly chart shows consolidation above 61.8. The price is forming higher lows. The Bulls are moving the price back at MPP and flirting with it. There is a chance of Weekly Butterfly Buy, with 1.618 expansion right at 100% Monthly target.

Daily chart shows possibility of upward move. We have SG. Also, the uptrend supports the retracements. The price didnt reach the lower border of triangle and channel.

Action: if the price breaks to the upside I will enter long because this will negate a lot of Bear moments: MPP, Channel, Triangle, Daily trend will confirm bullish.
Breaking the triangle to the downside will mean continuation of down move.

Thank you!
 

Attachments

  • gbpjpyw.gif
    gbpjpyw.gif
    31.9 KB · Views: 16
  • gbpjpym.gif
    gbpjpym.gif
    30.8 KB · Views: 17
  • gbpjpyw1.gif
    gbpjpyw1.gif
    30.1 KB · Views: 12
  • gbpjpyd.gif
    gbpjpyd.gif
    31.5 KB · Views: 15
Last edited:
Hello Mr. Morten!

If you have the time please give an opinion on GBPJPY:

Monthly downtrend is well defined by 25x5 DMA. If the ABC points are correct, the price is moving to 100% expansion.

Weekly chart shows consolidation above 61.8. The price is forming higher lows. The Bulls are moving the price back at MPP and flirting with it. There is a chance of Weekly Butterfly Buy, with 1.618 expansion right at 100% Monthly target.

Daily chart shows possibility of upward move. We have SG. Also, the uptrend supports the retracements. The price didnt reach the lower border of triangle and channel.

Action: if the price breaks to the upside I will enter long because this will negate a lot of Bear moments: MPP, Channel, Triangle, Daily trend will confirm bullish.
Breaking the triangle to the downside will mean continuation of down move.

Thank you!

Hi Georgeta,
On monthly chart this is probably not an AB=CD pattern, since BC leg is anemic. Hence there is no gravitation to 100% expansion target. Probably there could be some sort of W&R but not due this reason.
If you would like to get more clear bullish context - wait first breakout through 25x5. Recall DiNapoli example with soybean meal.
Since you have bearish trend on weekly and bullish on daily (stop grabber also is not of very good sort) - I see only "222" on daily. In such sircumstances, you may try to get 0.618 extension from daily large AB=CD...
 
Back
Top