RCtrader
Banned
- Messages
- 3
Downhill Skiing, Last Wave
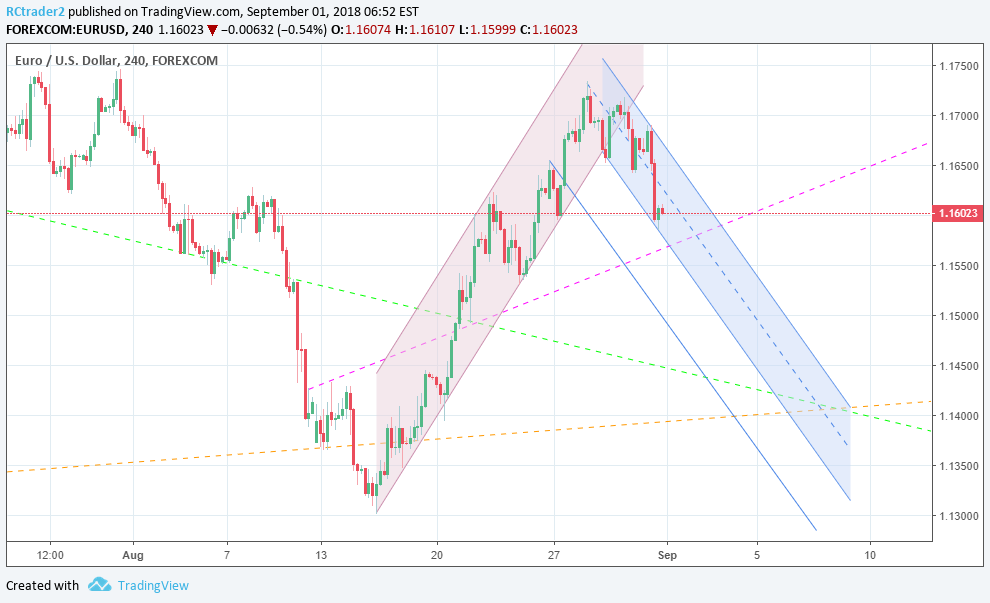
The pair has exited the uptrend channel and is now headed towards 1.13x. It would be the 3rd impulse wave on the daily chart (5-3 EW) which has finished or is about to finish the 1st impulse wave on the lower TF (4h for example). If this scenario is true then the 2nd corrective wave is rather short compared to the 1st corrective wave. Our aim, however, is to be aware of what might come next and if 2nd impulse wave (daily chart) was 550 pips long, the 3rd one could be as long.
On the chart, you can see a projection of a possible PA channel with an extra blue line parallel to it which could act as support in the event of a breakout. The wave has its start at 1.1733 and a possible end below 1.13x but until it reaches its target there are key support trendlines that stand on the way. The magenta line is a minor s/r trendline which crossing will give the last signal of the 4h trend change. The green line, on the other hand, is a key daily support that can be used by traders to TP some orders before a major pullback. And the orange line, despite being so close to the green line, is the last defense. It is a weekly trendline that might be the lower limit of an up-channel on the weekly chart. If it holds, the corrective wave on the daily chart could bring the price back into the 1.20x zone.
Trading Plan:
One of the options, for now, is to do SOER until 1.1438 with a final TP in the 1.1410 area. That's at least 200 pips gain if we don't take into account the scalping on pullbacks between the limits of the channel.
Next option, is to BOED from 1.1410 area, but it is risky because the price could dip as low as 1.1200.
We are at the beginning of a bountiful new month and a new season. The very first week could set the bottom of the next 3 months. The price action has largely been predictable in the past months of this year, but the type of the ABC corrective wave to follow is unknown. Luckily, we have the trendlines, the fibo tool, and the technical indicators to aid us at any time. Let's ride these mountains!