Sive Morten
Special Consultant to the FPA
- Messages
- 18,641
Hi everybody,
Let’s see, what we can expect during the next week.
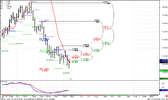
This is a Monthly EUR/USD chart. It’s a bit complicated, so I made some notes about the markings on it. Blue dashes are monthly Pivot points, light green dashes – monthly pivot support1 and dark green ones – monthly pivot support 2. The blue line – is a lower bound of Oscillator Predictor that shows us oversold level and for May it at 1.2680.
The monthly trend, based on MACD is bearish. We can see that during last five months, the market has closed below Pivot points. Also, I have to say that Pivots are traded by markets in 80% of cases. May Pivot =1.3373 and we can expect that during the month market will touch this level. Also, we have two Pivot support levels – Support 1=1.3052 and Support 2 = 1.2796. If you look at previous down move, you’ll see that usually either support 1 holds down move during the month or the area between support1 and support2.
Pivot analysis tells us that market should to trade 1.3370 area and the monthly minimum should be somewhere between the 1.2800 and 1.3050 level.
But – the trend is bearish now; there is no oversold condition - that’s why I will interpret any up move as a possibility to enter short. We have no oversold and the near target COP = 1.2880 can be achieved in May.
Let’s see, what we can expect during the next week.
This is a Monthly EUR/USD chart. It’s a bit complicated, so I made some notes about the markings on it. Blue dashes are monthly Pivot points, light green dashes – monthly pivot support1 and dark green ones – monthly pivot support 2. The blue line – is a lower bound of Oscillator Predictor that shows us oversold level and for May it at 1.2680.
The monthly trend, based on MACD is bearish. We can see that during last five months, the market has closed below Pivot points. Also, I have to say that Pivots are traded by markets in 80% of cases. May Pivot =1.3373 and we can expect that during the month market will touch this level. Also, we have two Pivot support levels – Support 1=1.3052 and Support 2 = 1.2796. If you look at previous down move, you’ll see that usually either support 1 holds down move during the month or the area between support1 and support2.
Pivot analysis tells us that market should to trade 1.3370 area and the monthly minimum should be somewhere between the 1.2800 and 1.3050 level.
But – the trend is bearish now; there is no oversold condition - that’s why I will interpret any up move as a possibility to enter short. We have no oversold and the near target COP = 1.2880 can be achieved in May.
Attachments
Last edited: