- Forex, Gold, BTC Market Analysis | Trading Signals
- Sive Morten- Currencies, Gold, Bitcoin Daily Video
You are using an out of date browser. It may not display this or other websites correctly.
You should upgrade or use an alternative browser.
You should upgrade or use an alternative browser.
Euro Forex Pro weekly 14-18 June, 2010
- Thread starter Sive Morten
- Start date
Sive Morten
Special Consultant to the FPA
- Messages
- 18,630
Hi Sive,
OP = B-A+C in our current situation,
B=1.2054, A=1.2164, C=1.2125
Are the formulas different between an uptrend and downtrend?
downtrend = A - B + C, uptrend = B - A + C
Thanks,
Jim
Hi, Jim
When you calculate expansions to downside, you should substract AB distance from C, because expansions at downtrend should be below C. This is obvious. So, OP at downtrend equals (B-A)+C. With your numbers OP=1.2015
For uptrend formula is the same. But due to point B that is higher than A, (B-A) is a positive number. When you surplus it to C point, you'll get OP that is above the market.
would someone shed me some light here? I don't know what ABC that Sive mentioned above is? is it the entrance based on breakout at B? is it the same as 123 concept? if yes, how about the objective target calculation?
Hi An2,
look at the chart - ABC - are marked there and they mean a market swing. Usually AB - initial thrust, BC - retracement from it. Using this numbers we can estimate Fibonacci expansions 0.618 (COP), 1.0 (OP) and 1.618 (XOP) that is our targets. OP means Objective point, COP - contracted OP, XOP - Extended OP.
Hi Sive,
Thanks again for the excellent updates. I have a question on the above. You mention that retracement should not start until the OP is reached at 1.2265 but the OP is down at 1.2165 on the chart? Is that a simple typo or am I missing something?
Thanks,
Chief
Hello Chief,
Look at hourly chart carefully - see, there is another ABC just in the beginning of the chart. This is an ABC that we're talking about. this ABC-bottom patern gives us OP=1.2265. More recent ABC - is for calculation target of retracement to enter long, because it ABC-top
Morten sir, doesnt it better to put those XOP, OP, ABC and some others abbv. (plus reference links about Dinapolli if any) on your every posts? Thus it will reduce new comers asking same questions over and over which in the end annoy you. I'm not blamming new comers here. They're keep coming since your posts gave them very good insight about the market. It's just I dont want you to stop posting because you answer the same questions over and over")
Well, there are too many abbv, to describe all of them. Besides, guys, you will be around, willn't you? I think that you swim fine in all this stuff already. Always somebody can explain basic things.
I see very important "wind of change" - debt crisis start spreads across the world, not only Europe - just see Japan's new prime minister speach about 200% GDP debt... This can lead to fast yen falling to 110 first target and more important - rising power of yen crosses, which can change most pairs technical...
What do you think about?...
Hi kamuta
Hm... In fact, I've wrote about the spreading, but basically in Europe, and I think that the next country, which will fall under scrutiny will be UK. (besides, Spain Portugal etc.)
Concerning Japan I think that more important is an export contraction due to recession. Besides, Japan one of the greatest holders of US Treasuries, so I do not think that 200% GDP debt is a new stuff.
Sive Morten
Special Consultant to the FPA
- Messages
- 18,630
EUR/USD Update Tue, 15 June
Hello everybody,
today we have some signal to trade.
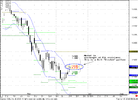
This is a daily bearish "Stretch" pattern. Market has reached overbought condition at Fib resistance 1.2230. This is a daily context. On 4-hour chart market has reached XOP target and weekly Pivot resistance 2.
As I've said in weekly research i expect that market should show deep retracement after first swing up. So, this first swing has finished with Stretch pattern and now I expect retracement to downside. For short term traders this is not bad possibility to enter short with target around weekly pivot point 1.2035-1.2050. For position traders - wait for ending of a retracement down and enter long for the next swing up.
That's being said - short term strategy - sell with target around weekly Pivot.
Long term - wait when stretch will be worked out and enter long at weekly Pivot point.
Hello everybody,
today we have some signal to trade.
This is a daily bearish "Stretch" pattern. Market has reached overbought condition at Fib resistance 1.2230. This is a daily context. On 4-hour chart market has reached XOP target and weekly Pivot resistance 2.
As I've said in weekly research i expect that market should show deep retracement after first swing up. So, this first swing has finished with Stretch pattern and now I expect retracement to downside. For short term traders this is not bad possibility to enter short with target around weekly pivot point 1.2035-1.2050. For position traders - wait for ending of a retracement down and enter long for the next swing up.
That's being said - short term strategy - sell with target around weekly Pivot.
Long term - wait when stretch will be worked out and enter long at weekly Pivot point.
Attachments
Hi Everyone,
Is the preferred trade to go LONG below 1.2000 (with target 1.2200) when the market opened?
Or is it preferred to go SHORT above 1.2230 (with target of 1.2050) like it is now?
I currently went short 1.2265 when it first went up. But EUR went up after the very bad ZEW report?
I could add some more shorts though as I only have entered half a position.
Thanks
JT
Sive Morten
Special Consultant to the FPA
- Messages
- 18,630
EUR/USD Update, Wed, 16 June
Hello, everybody
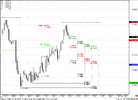
Although I've expected some down move yesterday, market has shown an up move. Looks like I've underestimated oversold level on monthly chart and market need deeper up move decpite daily overbought. Nevertheless I'm sure that market will correct lower sooner rather than later. And mostly because this is a first swing up - new sellers will enter the market and it should lead to retracement lower.
Anyway, Daily bearish Stretch pattern is still there. As I've said earlier this pattern is very tricky, because If you'll take it - you need open position against the trend. That's why we should to wait some confirmation on lower time frames before enter short.
I just can give you a beacon, where it can happen. For today this is a Daily Confluence resistance area at 1.2350-1.2380. This is a solid resistance, let's take a look, probably some bearish signs will appear there.
Hello, everybody
Although I've expected some down move yesterday, market has shown an up move. Looks like I've underestimated oversold level on monthly chart and market need deeper up move decpite daily overbought. Nevertheless I'm sure that market will correct lower sooner rather than later. And mostly because this is a first swing up - new sellers will enter the market and it should lead to retracement lower.
Anyway, Daily bearish Stretch pattern is still there. As I've said earlier this pattern is very tricky, because If you'll take it - you need open position against the trend. That's why we should to wait some confirmation on lower time frames before enter short.
I just can give you a beacon, where it can happen. For today this is a Daily Confluence resistance area at 1.2350-1.2380. This is a solid resistance, let's take a look, probably some bearish signs will appear there.
Attachments
Good Day Sive, thanks for confirming technicals. Yeah very strong resistance just up ahead. I actually shorted it last night after it almost touched 1.2350 resistance, I let it go 2hours ago due to up move and stochastics crossing as well. Nonetheless I will try to short again.
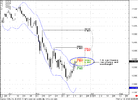
I also see a ABC forming on the 4hrs chart with D at around 1.2420. It seems like it's a good sl after this point. The strong resistance couple with the confluence level seems to make this a sure bet !
I hope we are right on this one. I will probably double the stake since there are so many confirmation signal in one.
So the Strategy is to wait for a higher level to SHORT.. Got it...
I still believe the down trend is not done yet and I will wait for the 1.20s level..
likewise, since I have entered half a position, I will short anew at higher levels to get a better average price.
I still believe the down trend is not done yet and I will wait for the 1.20s level..
likewise, since I have entered half a position, I will short anew at higher levels to get a better average price.
Sive Morten
Special Consultant to the FPA
- Messages
- 18,630
So the Strategy is to wait for a higher level to SHORT.. Got it...
I still believe the down trend is not done yet and I will wait for the 1.20s level..
likewise, since I have entered half a position, I will short anew at higher levels to get a better average price.
Hi, Jtfx,
Not exactly. Carefully read updates. The short-term strategy is bearish. We have some strain on the market due serious resistance and overbought condition. So, I try to catch a correction to the downside in short-term period. But this signal is very unstable due to some reasons and very capricious.
After this signals will be done and market will show this retracement - you may enter long as a positional trader. That's why I've wrote - if you're a positional trader - wait until downside correction will be finished. For now I think that it will happen around 1.2050 area.
Similar threads
- Replies
- 7
- Views
- 761
- Replies
- 0
- Views
- 60
- Replies
- 5
- Views
- 215
- Replies
- 6
- Views
- 234
- Replies
- 5
- Views
- 881
- Forex, Gold, BTC Market Analysis | Trading Signals
- Sive Morten- Currencies, Gold, Bitcoin Daily Video