Sive Morten
Special Consultant to the FPA
- Messages
- 18,644
Fundamentals
The previous week's data has shown a confirmation of our previous week’s post “Too early for europhoria”. So I will make just some small additions, based on the previous week's events. The major idea of that research - is that currently the market reassesses the USD premium above EUR currency that has been formed during the time when US had a strong data and EU had strong problems. But, the market is very often a subject of a wave effect – overestimation very often changes with underestimation, until balance will be established. So, I think that currently the market has entered in underestimation of EU problems and doubts the Dollar. US macro data was strongly disappointing, look– Fed reduce their forecast on economic growth and inflation, CPI and PPI shows lower than expected data, all indexes – Philadelphia, New-York and Michigan shows huge down turn. Also, I do not expect solid data on real estate during next week. At the same time EU news events were much better. The Spanish bond auction as well as the Greek auction saw solid subscription despite the fact these countries could still be on the brink of default. It has lead to a strong EUR up move on Thursday.
So, what to expect in the macro sphere in foreseeable future? First of all, 23 of July will be released an EU bank’s stress-tests. Although EU officials tell that they will be in a row with expectations and bring no surprises, I do not have so much assurance in this. Second, much like the USD sold off as macro indicators decelerated, the EUR should expect similar treatment. Third, there is some uncertainty with returning process of the liquidity that EU banks had accumulated via ECB austerity program. The time period of this program is 12 months, and then banks have to return as much as 442 Bln. EUR.
That’s being said, although currently the scale has turned in favor of EUR, I think that market has underestimated EU problems in the long term. I expect another move down in the EUR/USD when EU austerity measures are bound to causing a cooling for growth.
Monthly
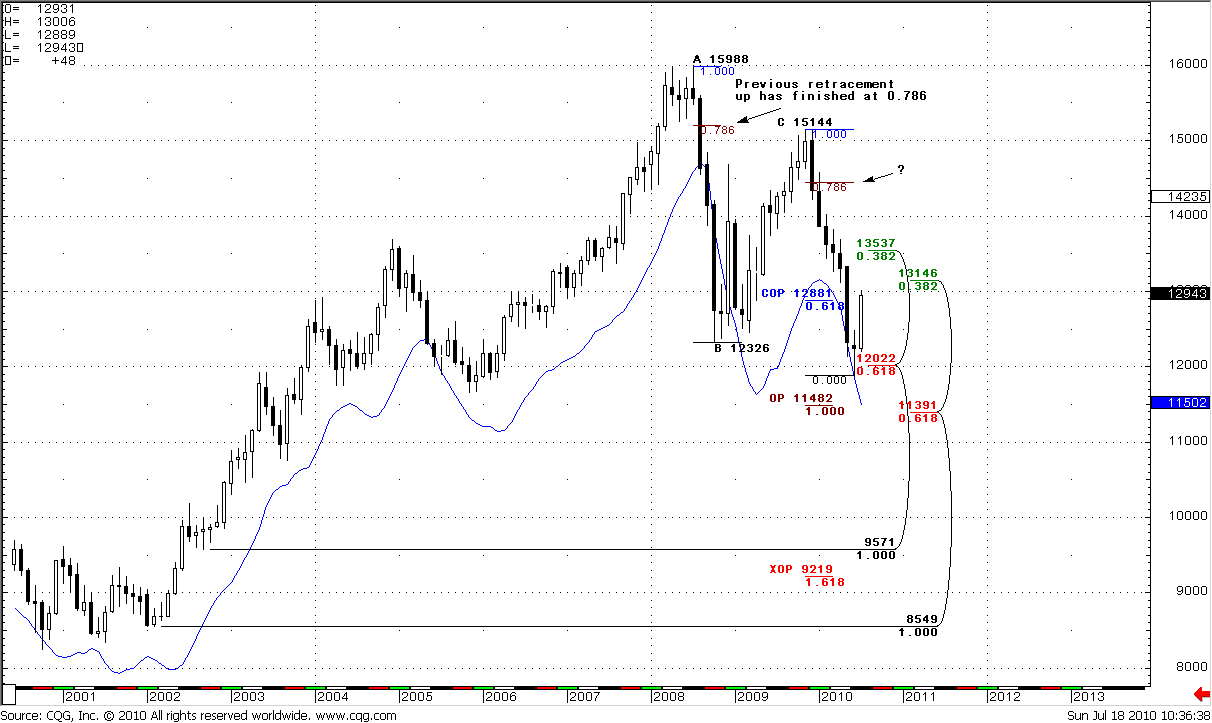
The market continues a gradual pull back from oversold. The previous part of the month shows an excellent up move. At the same time, the trend is bearish, next nearest target is Agreement at 1.1391-1.1482. I still think that this is just a pullback from a strong down thrust and we will see another leg down. I don’t know for now how strong it will be, but definitely it will take place. The nearest level to watch for – weekly 1.30-1.31 area. Will retracement stop there? Who knows… If we carefully look at the chart, we’ll see that previous up move has stopped at 0.782 retracement, so it was deep retracement. On the previous week we’ve talked about symmetry of the down move. They are not absolutely harmonic, the current leg a bit slower than the AB leg, but if symmetry will hold we can see deep retracement again. But we’re technical traders, let’s follow our trading plan and do not run ahead of train.
Weekly
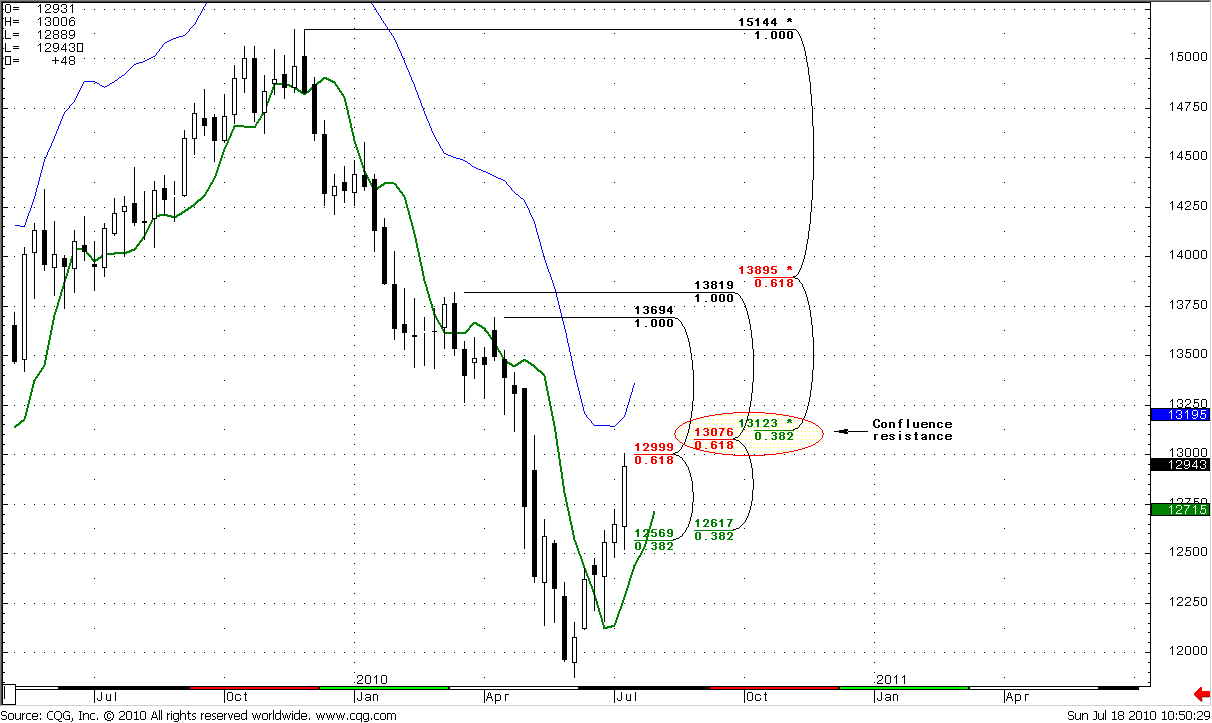
The weekly trend is bullish, no overbought. The green line on the chart is a 3x3 SMA, the blue line – Oscillator Predictor upper bound that shows us overbought level.
I have no monthly Pivot points at weekly chart, because all of them have been erased by price action. This is a really the sign of strength of the market. As you remember during the last couple of weeks we’ve talked about “Bread and Butter” directional trade. And I’ve said that I prefer to see at least 3 closes above 3x3 DMA for B&B. Now we have 4 closes above 3x3 and the last week was really strong. For now I do not see any particular “Sell” signals, but what I do see is a strong resistance just above the market. (In general, it is even stronger than on the weekly chart – daily chart has something to add to this level). 1.3076 – 1.3123 area of weekly Confluence resistance. 1.3195 – weekly overbought level for next week. I also have pointed a minor Fib level – 1.2999 it’s rather psychological one, but my particular interest is in K-area.
So, from the weekly point of view – keep an eye on K-area, drop your time frame to daily or even 4-hour and watch for sell signals. B&B can start from this level. Surely it can pierce it a bit, show W&R or something like that, I don’t know. But this 13076-1.3195 range has chances to stop up move and lead to B&B start. If this scenario will realize - the target of B&B will be 1.2350 area. Not a bad move.
Daily
The daily chart is very interesting now. First of all let’s look at resistances and Fib work. As I’ve said, the daily chart has something to add to the weekly one. This is an XOP target at 1.3133 that creates an Agreement with weekly Confluence resistance. When we’ve talked about reverse H&S pattern that only starts to materialize, I’ve said the very often the target of H&S is 1.618 expansion that is XOP. In general, area of XOP – is a level where bull party is over or at least time for pause. I expect that even B&B trade will not start from this area – the market should show some move down. This is an excellent area to establish short positions. By the way, 1.3125 is a weekly Pivot resistance 1.
Second, during last two days the market has reached an overbought level and Friday is a doji. It means that the market in decision. Market is also at weekly 1.30 Fib resistance and psychological one. Daily trend is bullish, but this is not the time for enter long at weekly and daily Fib resistance and overbought area. Probability suggests that we should buy at pullback. To estimate possible levels to enter – let’s look at supports and Pivot work. For enter there can be 3 possible areas:
1.2822-1.2824 includes weekly Pivot point, Fib support and 50% retracement of a long previous Thursday’s bar;
1.2682-1.2708 – Daily Confluence support that also includes previous highs.
1.2760-1.2780 – Disrespected Fib confluence resistance (look for previous research to refresh in mind this area). Very often, when market has disrespected K-area – it returns to it during a pullback.
That’s being said, I expect that the market should reach XOP=1.3133, but the market is currently at Overbought and daily/weekly 1.30 resistance. For those who are bearish – wait until XOP will be reached and look for Sell signals in 1.3130-1.3190 area. For those who likes scalp trades – drop your time frame to 4-hour or even 1 hour, look for ABC’s that finishes around levels that I’ve pointed, wait for Buy signals in this areas and enter long with XOP=1.3133 target.
Let’s try to find out something on lower time frames…
Daily#1
Daily#2
1-Hour
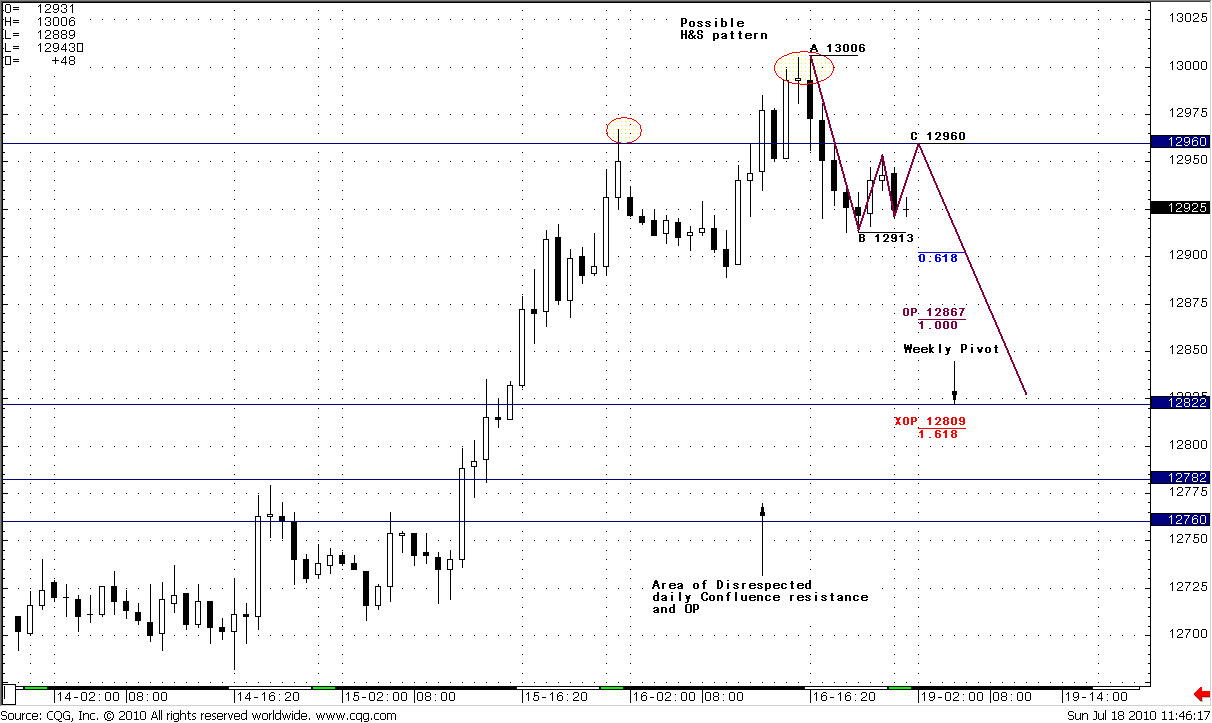
The hourly trend is bearish. I see a H&S pattern forming. Usually, H&S patterns are symmetrical, not only in sense of price levels, but of time also. It means that shoulders should have an equal time periods from the Head. That’s why, on Monday opening I expect ABC up pattern at least to 1.2960 – this is a 50% retracement from Head down move also. Then, H&S will be nicely harmonized to start to work. For those of you who like scalp trade – this is an excellent place to try to enter short with 1.2820 target, because you can place a very tight stop.
As I’ve said many times – very often target of H&S is XOP that is 1.2809 – just below weekly Pivot=1.2822 and daily Fib support. This is an Agreement. Interesting, right? Just below this level you also can see a Triangle consolidation that market has entered when It reached OP on Thursday. This is a support. I think it should hold if market intends to go higher.
The strategy for Monday as follows: wait until ABC of right shoulder will be accomplished around 1.2960 area. For those who likes scalp trades – you can enter short with a tight stop just above the head and XOP=1.2809 target or at least 1.2822 (weekly Pivot point).
For the others – wait when market will reach 1.2809-1.2822 target, then you can enter long only after the moment when hourly trend will turn bullish and market will rise above weekly pivot (if it will move below first, of cause). Target - daily XOP=1.3133
That is my trading plan for next week – Enter long in 1.28-1.2822 area on Monday – if weekly Pivot will hold the market with target 1.3133. Stop below 1.2760.
Good luck.
The previous week's data has shown a confirmation of our previous week’s post “Too early for europhoria”. So I will make just some small additions, based on the previous week's events. The major idea of that research - is that currently the market reassesses the USD premium above EUR currency that has been formed during the time when US had a strong data and EU had strong problems. But, the market is very often a subject of a wave effect – overestimation very often changes with underestimation, until balance will be established. So, I think that currently the market has entered in underestimation of EU problems and doubts the Dollar. US macro data was strongly disappointing, look– Fed reduce their forecast on economic growth and inflation, CPI and PPI shows lower than expected data, all indexes – Philadelphia, New-York and Michigan shows huge down turn. Also, I do not expect solid data on real estate during next week. At the same time EU news events were much better. The Spanish bond auction as well as the Greek auction saw solid subscription despite the fact these countries could still be on the brink of default. It has lead to a strong EUR up move on Thursday.
So, what to expect in the macro sphere in foreseeable future? First of all, 23 of July will be released an EU bank’s stress-tests. Although EU officials tell that they will be in a row with expectations and bring no surprises, I do not have so much assurance in this. Second, much like the USD sold off as macro indicators decelerated, the EUR should expect similar treatment. Third, there is some uncertainty with returning process of the liquidity that EU banks had accumulated via ECB austerity program. The time period of this program is 12 months, and then banks have to return as much as 442 Bln. EUR.
That’s being said, although currently the scale has turned in favor of EUR, I think that market has underestimated EU problems in the long term. I expect another move down in the EUR/USD when EU austerity measures are bound to causing a cooling for growth.
Monthly
The market continues a gradual pull back from oversold. The previous part of the month shows an excellent up move. At the same time, the trend is bearish, next nearest target is Agreement at 1.1391-1.1482. I still think that this is just a pullback from a strong down thrust and we will see another leg down. I don’t know for now how strong it will be, but definitely it will take place. The nearest level to watch for – weekly 1.30-1.31 area. Will retracement stop there? Who knows… If we carefully look at the chart, we’ll see that previous up move has stopped at 0.782 retracement, so it was deep retracement. On the previous week we’ve talked about symmetry of the down move. They are not absolutely harmonic, the current leg a bit slower than the AB leg, but if symmetry will hold we can see deep retracement again. But we’re technical traders, let’s follow our trading plan and do not run ahead of train.
Weekly
The weekly trend is bullish, no overbought. The green line on the chart is a 3x3 SMA, the blue line – Oscillator Predictor upper bound that shows us overbought level.
I have no monthly Pivot points at weekly chart, because all of them have been erased by price action. This is a really the sign of strength of the market. As you remember during the last couple of weeks we’ve talked about “Bread and Butter” directional trade. And I’ve said that I prefer to see at least 3 closes above 3x3 DMA for B&B. Now we have 4 closes above 3x3 and the last week was really strong. For now I do not see any particular “Sell” signals, but what I do see is a strong resistance just above the market. (In general, it is even stronger than on the weekly chart – daily chart has something to add to this level). 1.3076 – 1.3123 area of weekly Confluence resistance. 1.3195 – weekly overbought level for next week. I also have pointed a minor Fib level – 1.2999 it’s rather psychological one, but my particular interest is in K-area.
So, from the weekly point of view – keep an eye on K-area, drop your time frame to daily or even 4-hour and watch for sell signals. B&B can start from this level. Surely it can pierce it a bit, show W&R or something like that, I don’t know. But this 13076-1.3195 range has chances to stop up move and lead to B&B start. If this scenario will realize - the target of B&B will be 1.2350 area. Not a bad move.
Daily
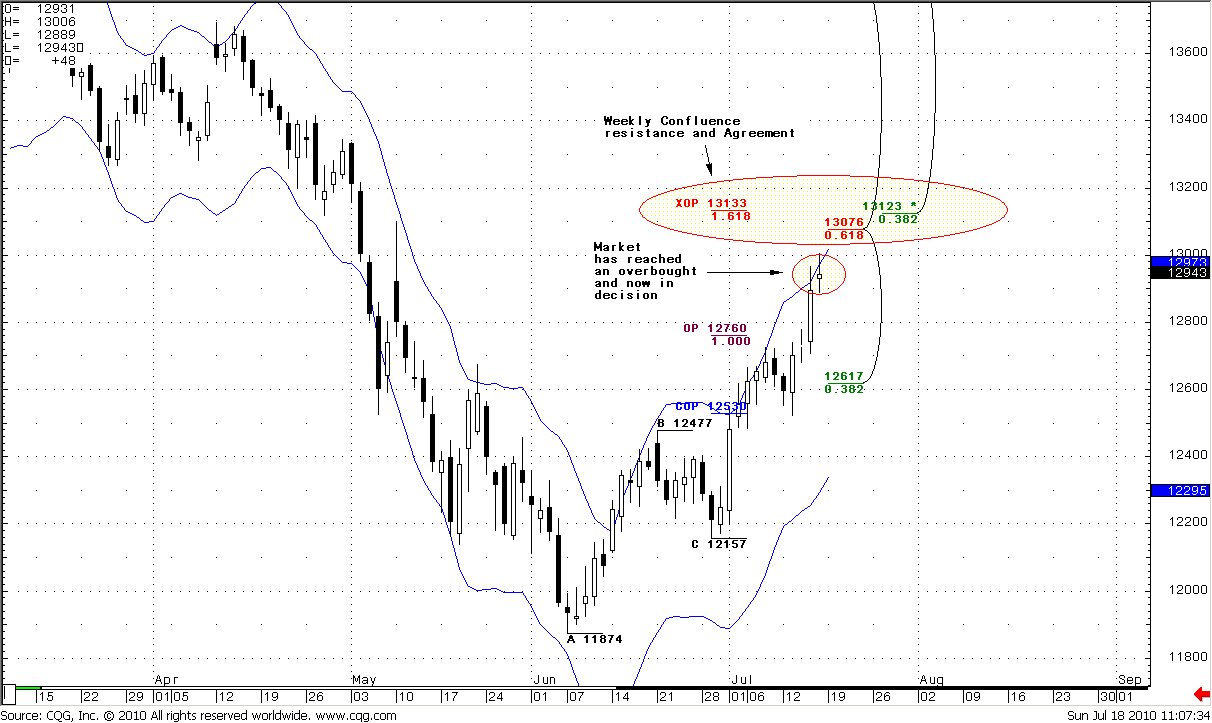
The daily chart is very interesting now. First of all let’s look at resistances and Fib work. As I’ve said, the daily chart has something to add to the weekly one. This is an XOP target at 1.3133 that creates an Agreement with weekly Confluence resistance. When we’ve talked about reverse H&S pattern that only starts to materialize, I’ve said the very often the target of H&S is 1.618 expansion that is XOP. In general, area of XOP – is a level where bull party is over or at least time for pause. I expect that even B&B trade will not start from this area – the market should show some move down. This is an excellent area to establish short positions. By the way, 1.3125 is a weekly Pivot resistance 1.
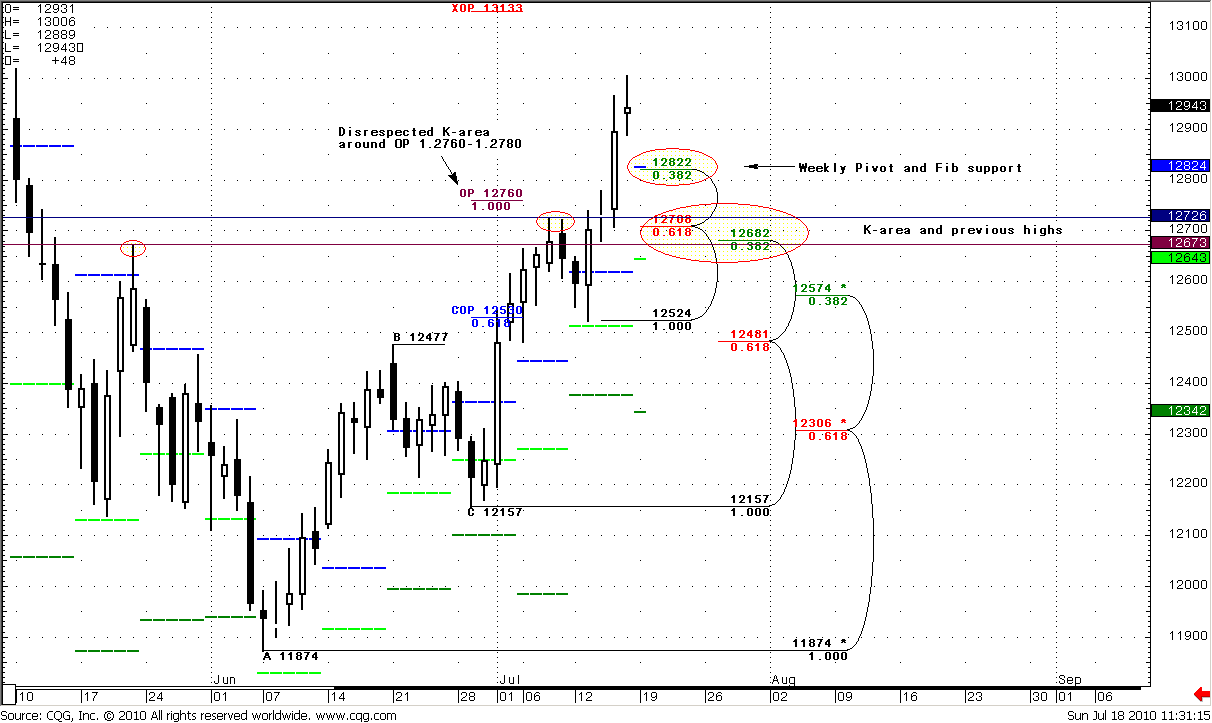
Second, during last two days the market has reached an overbought level and Friday is a doji. It means that the market in decision. Market is also at weekly 1.30 Fib resistance and psychological one. Daily trend is bullish, but this is not the time for enter long at weekly and daily Fib resistance and overbought area. Probability suggests that we should buy at pullback. To estimate possible levels to enter – let’s look at supports and Pivot work. For enter there can be 3 possible areas:
1.2822-1.2824 includes weekly Pivot point, Fib support and 50% retracement of a long previous Thursday’s bar;
1.2682-1.2708 – Daily Confluence support that also includes previous highs.
1.2760-1.2780 – Disrespected Fib confluence resistance (look for previous research to refresh in mind this area). Very often, when market has disrespected K-area – it returns to it during a pullback.
That’s being said, I expect that the market should reach XOP=1.3133, but the market is currently at Overbought and daily/weekly 1.30 resistance. For those who are bearish – wait until XOP will be reached and look for Sell signals in 1.3130-1.3190 area. For those who likes scalp trades – drop your time frame to 4-hour or even 1 hour, look for ABC’s that finishes around levels that I’ve pointed, wait for Buy signals in this areas and enter long with XOP=1.3133 target.
Let’s try to find out something on lower time frames…
Daily#1
Daily#2
1-Hour
The hourly trend is bearish. I see a H&S pattern forming. Usually, H&S patterns are symmetrical, not only in sense of price levels, but of time also. It means that shoulders should have an equal time periods from the Head. That’s why, on Monday opening I expect ABC up pattern at least to 1.2960 – this is a 50% retracement from Head down move also. Then, H&S will be nicely harmonized to start to work. For those of you who like scalp trade – this is an excellent place to try to enter short with 1.2820 target, because you can place a very tight stop.
As I’ve said many times – very often target of H&S is XOP that is 1.2809 – just below weekly Pivot=1.2822 and daily Fib support. This is an Agreement. Interesting, right? Just below this level you also can see a Triangle consolidation that market has entered when It reached OP on Thursday. This is a support. I think it should hold if market intends to go higher.
The strategy for Monday as follows: wait until ABC of right shoulder will be accomplished around 1.2960 area. For those who likes scalp trades – you can enter short with a tight stop just above the head and XOP=1.2809 target or at least 1.2822 (weekly Pivot point).
For the others – wait when market will reach 1.2809-1.2822 target, then you can enter long only after the moment when hourly trend will turn bullish and market will rise above weekly pivot (if it will move below first, of cause). Target - daily XOP=1.3133
That is my trading plan for next week – Enter long in 1.28-1.2822 area on Monday – if weekly Pivot will hold the market with target 1.3133. Stop below 1.2760.
Good luck.
Last edited:
")