Euro Forex Pro weekly 21-25 June, 2010

EUR/USD Update, Thu 24, June

Good morning,

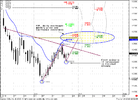
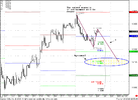
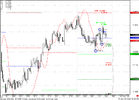
EUR/USD almost reached a weekly pivot support 1 and then has reversed up.
Was it a turn to new highs? I do not know, because I have some suspicions about this.
From the one side - there is a H&S reverse pattern that you can see on daily and 4-hour chart and from that point of view our next Logical Profit Objective (LPO) COP just below 1.26 area monthly Pivot point, daily overbought and confluence resistance area.
From the other side - market falls hardly before current pullback. When market changes direction, usually it makes deep retracement, so will it be ABC retracement on 4- hour chart. Probably.
At the same time, from the technical point of view trend is bullish on daily, 4-hour chart and 1-hour chart, market is above weekly pivot point and Buying is more logical then Selling in these circumstances.

That's being said, in current situation I prefer to see something more clear...
Probably, entering Long at weekly Pivot 1.2304, if market will show some signs here not bad idea. If it will move below pivot - then the probablility of ABC retracement becomes greater.
 

Attachments

  • EUR_USD_D_24_06_10.PNG
    EUR_USD_D_24_06_10.PNG
    38.2 KB · Views: 81
  • EUR_USD_4H_24_06_10.PNG
    EUR_USD_4H_24_06_10.PNG
    31.6 KB · Views: 78
Hah quite an astonishing movement here. Long tails everywhere. Right now, it is slowly trying to creep up up up and than gets wack down, but it does that again up up up and than *smack* it goes down again.

It is interesting to see whether it can keep going up like this and keep breaking the strong selling until it stops.
 
Sive, Weekly B&B if we close this week above 1.22428?

Hi, Sentinel
Yes, I think so. But, I prefer 2-3 closes above 3x3 for B&B. Besides, market is oversold on monthly, and there is a risk that retracement up on weekly will be a bit deeper, may be to 1.26 area. But thrust is OK, and in perspective this will be a B&B.
 
EUR/USD Update, Fri 25, June

Hello, everybody
There was a very choppy action during previous days. Today is Friday, so I do not expect rush action. Here is a 4-hour chart. Daily and 4-hour trends are bullish. So, market has reached COP and retraced a bit lower. At the same time market is above weekly pivot point. So, till the end of Friday I expect that market can reach OP target at 1.2412 area.
 

Attachments

  • EUR_USD_4H_25_06_10.PNG
    EUR_USD_4H_25_06_10.PNG
    33.5 KB · Views: 47
Trend assessment

Sive,

thank you for all the effort you put in publishing the info and answering questions. I hope that the past month's loosing streak does not discourage you from that. Actually, how do you, as a professional trader, look at an experience of loosing for a month? What are your thoughts?

Second question. I understand your way of entry and exit, but how do you assess the context - the trend? Besides DiNapoli's directional patterns.

Rasto
 
Sive,

thank you for all the effort you put in publishing the info and answering questions. I hope that the past month's loosing streak does not discourage you from that. Actually, how do you, as a professional trader, look at an experience of loosing for a month? What are your thoughts?Rasto

Hi, Rasto
Well, loss is a part of all this stuff. I understand your question and reducing of my demo for 20% is a large amount. If you can see I have the same issue twice during the year - large drawdowns on the account. It's bad.
But this is a demo, sometimes I have no time to carefully work with it. But I have to trade anyway, because I have time limit, it's a demo, otherway if I will not trade during the month, this demo will expire and it will be closed...
This combination leads to drawdowns. You should understand that FPA is not my primary occupation, now there are a lot of interesting situations besides FOREX. I'll do my best in weekly and daily analysis, but sometimes I do not have a moment to trade carefully with demo.

Second question. I understand your way of entry and exit, but how do you assess the context - the trend? Besides DiNapoli's directional patterns.
Rasto
MACD is a trend indicator, sometimes I use MACD Predictor - but this is the same stuff that MACD is. When MACD lines cross - MACD Predictor crosses price line.
 
TF and trends

Hi, Rasto
Well, loss is a part of all this stuff. I understand your question and reducing of my demo for 20% is a large amount. If you can see I have the same issue twice during the year - large drawdowns on the account. It's bad.
But this is a demo, sometimes I have no time to carefully work with it. But I have to trade anyway, because I have time limit, it's a demo, otherway if I will not trade during the month, this demo will expire and it will be closed...
This combination leads to drawdowns. You should understand that FPA is not my primary occupation, now there are a lot of interesting situations besides FOREX. I'll do my best in weekly and daily analysis, but sometimes I do not have a moment to trade carefully with demo.


MACD is a trend indicator, sometimes I use MACD Predictor - but this is the same stuff that MACD is. When MACD lines cross - MACD Predictor crosses price line.


Sive,

I agree that having to trade contributes to losses. I actually heard that one of the biggest advantages small-scale traders, such as me, have over professionals (besides many disadvantages), is that we do not have to trade all the time. We can wait for the high probability setup even if it means not trading for a while.

What timeframes do you trade for the different instruments on the live accounts?

Speaking of the context. When I compare two trades that you described awhile back (Oct 29 and Nov 3). Oct 29, the context was MACD on 1H uptrend and MACD on 5M down trend. The trade worked very well. If you had waited for MACD on 5M to turn up, you would have lost about the half of the trade.

Then, on Nov 3, the context was MACD on 1H uptrend (although very weak) and MACD on 5M was fading but still above the signal line. In an analysis after wards you have mentioned that it would had been better to wait till both trends turn in the same direction. That raises two questions. Does turning up mean something more that just being above the signal line? And should I always wait for the both (context TF and entry TF) to have MACD signaling the same trend?

Rasto
 
What timeframes do you trade for the different instruments on the live accounts?
Rasto

Well, usually I don't scalp. It means daily and weekly my major time frames.
But, in general, it does not depend on time frame, except the fact that the smaller time frame - the faster you should make a decision.

Speaking of the context. When I compare two trades that you described awhile back (Oct 29 and Nov 3). Oct 29, the context was MACD on 1H uptrend and MACD on 5M down trend. The trade worked very well. If you had waited for MACD on 5M to turn up, you would have lost about the half of the trade.

Then, on Nov 3, the context was MACD on 1H uptrend (although very weak) and MACD on 5M was fading but still above the signal line. In an analysis after wards you have mentioned that it would had been better to wait till both trends turn in the same direction. That raises two questions. Does turning up mean something more that just being above the signal line? And should I always wait for the both (context TF and entry TF) to have MACD signaling the same trend?
Rasto

In general, it works like this. Let's assume that you would like to make a trade at 5 min chart. Then your context is 1-hour chart trend, let's it be up.
So, you want to enter long on a retracement lower, and currently 5-min trend is down. For expample - market declines to 0.382 retracement on hourly time frame, market finds support there and 5-min trend reverses up and shows a thrust on 5 min from this hourly Fib. support. So, you have both trends up and have to enter on small retracement down on 5 -min chart at this time. Or you may enter right at 0.382 hourly support before 5-min trend turns up, but this is more risky. The point is that in DiNapoli method trend change confirms only at close price. You can see MACD line cross, but until closing current bar - trend has not confirmed yet.
It sounds a bit confusing, but if you carefully read this stuff, you'll understand.
 
Back
Top